Week 6 Fuel cell powered vehicle model
AIM:
To model a fuel cell-powered electric vehicle using Simulink model
Procedure:
# For the electric vehicle the drive cycle should be prepared and to be imported in the signal builder.
# Simulation cycle should be changed according to the given time value
# Running the simulation and analyzing the results for both fuel flow and fuel flow voltage
Circuit model:
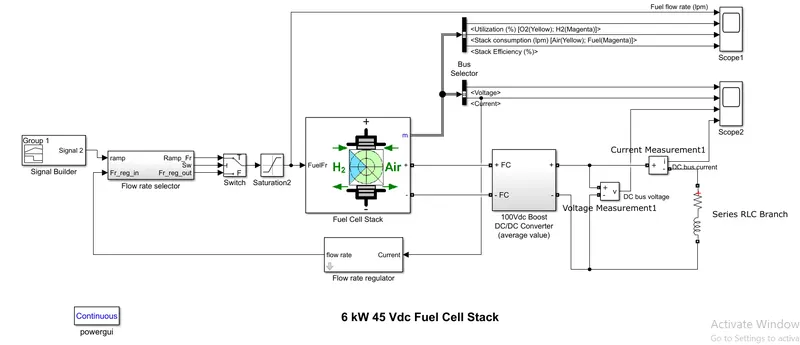
Working of Model:
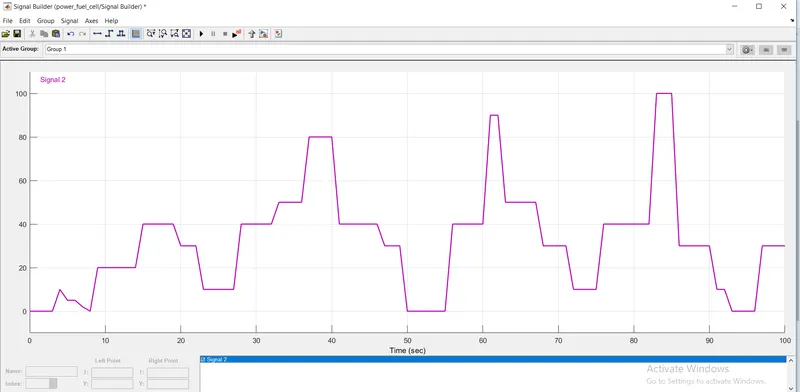
# The signal builder block is used for feeding the drive cycle of an electric vehicle by importing the created excel sheet for the drive cycle.
# Fuel flow rate is used to select the flow rate at the given time and speed data from the drive cycle given. Where it calculates and selects the data which is to be sent for the switch and it is a subblock that consists of a number of subblocks that work in.
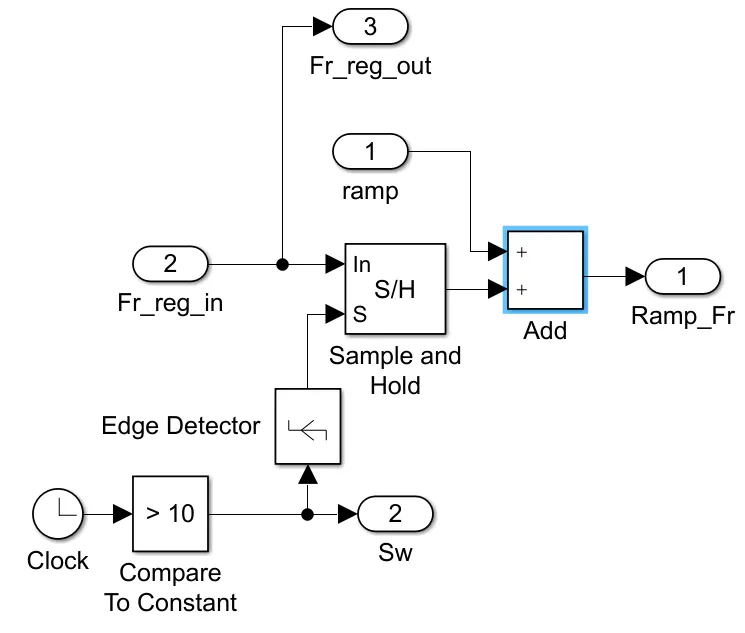
The above block diagrams are the subblocks of the fuel rate selector
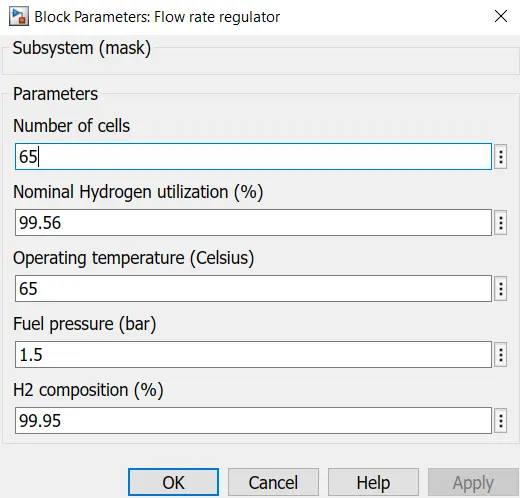
# Here the switch is used to operate whenever power from the fuel flow regulator is supplied wherefrom the fuel cell stack the current is flowing through the flow regulator the amount of flow is regulated by checking its fuel flow regulator parameters. The regulator does not regulate only the current its also regulates the no.of.cells used in a fuel cell, hydrogen utilization, operating temperature, fuel pressure, and H2 composition taken from one of the outputs of the fuel cell stack.
# A 100V DC booster used for DC/DC conversion of the fuel cell stack power. Where the output voltage is higher than the source voltage so the booster is used. The booster chopper inbuilt
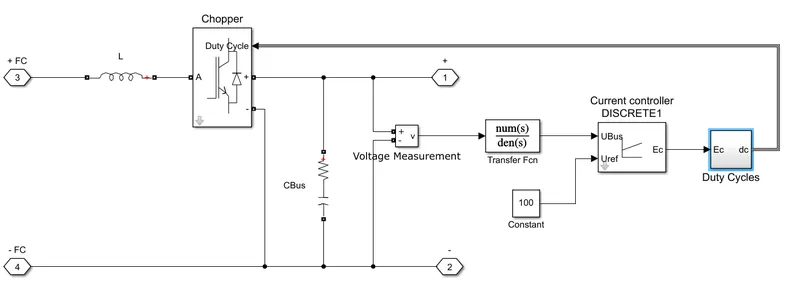
The above blocks are the subblocks of the 100V DC/DC booster
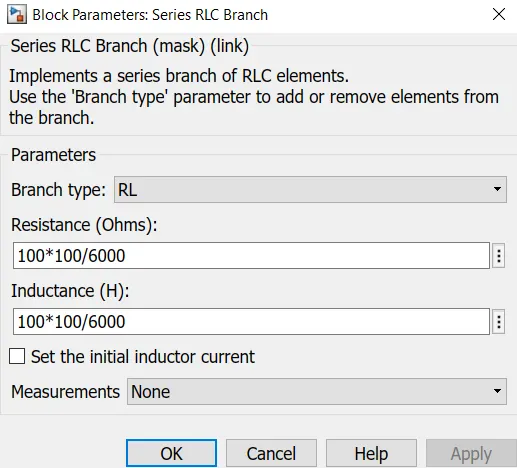
# The Series RLC Branch block implements a single resistor, inductor, or capacitor, or a series combination of these where the current measurement and voltage measurement and DC/DC booster negatives are connected with the RLC circuit negative. Current, voltage measurements and booster positives are connected with another end of the RLC circuit.
# The voltage and current measurement outputs are connected with scope 2 which consists of Fuel cell voltage, current, DC/DC converter voltage and DC/DC converter current signals are available on Scope2.
# Scope1 consists of Fuel flow rate, Hydrogen and oxygen utilization, fuel and air consumption, and efficiency are available on which is connected with fuel cell output. The input drive cycle from saturation is also connected with scope1 for the time and speed data of the electric vehicle.
Steps involved in building the model:
# Signal builder block is used in the first step for the model as input data.
# Step 2
flow rate selector is used and one input is connected with the signal builder and another input is connected with the flow rate regulator block.
# Step 3
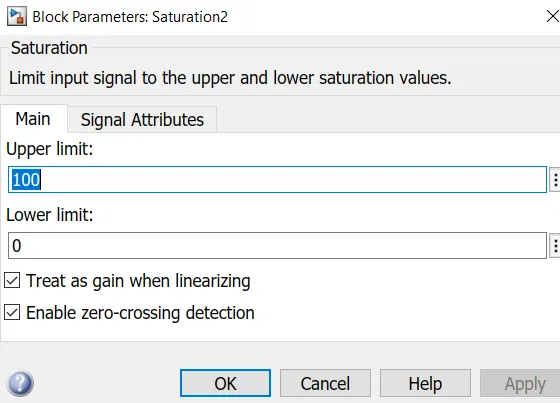
Switch block input is created and flow rate regulator output is connected with the input of the switch and saturation block is used for giving the upper limit used in the model. The input of the switch is connected with the input of saturation.
# Step 4
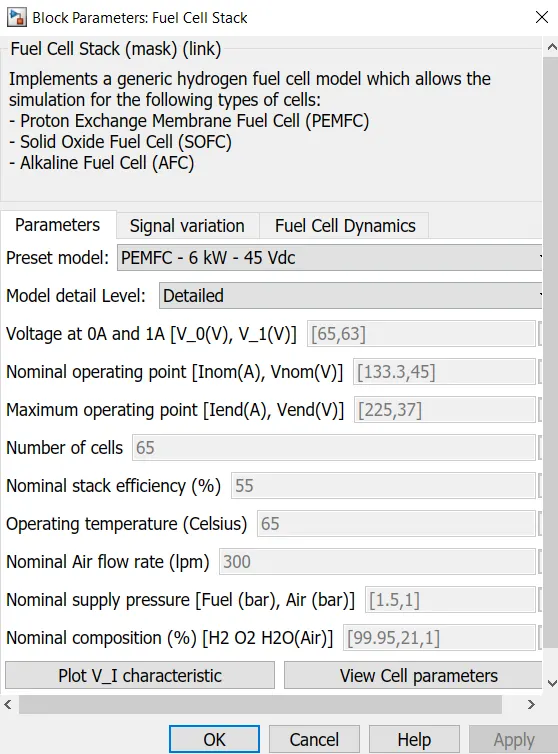
Fuel cell stack block is created and the parameters of the cells are given the input of block is connected with saturation block output and the output of fuel cell stack positive and negatives are connected with DC booster block inputs at which the DC booster block is created.
# Step 5
Voltage and current measurement blocks are created along with RLC circuit block where the negatives of voltage, current measurement, and DC booster block is connected with RLC circuit's negative and positives of booster block is connected with current and voltage measurement blocks and the outputs of the blocks are connected to scope2
# Step 6
Two scope blocks are created one is for Fuel flow rate, Hydrogen, and oxygen utilization, fuel, and air consumption, and efficiency are available on the Scope1 another one is for Fuel cell voltage, current, DC/DC converter voltage and DC/DC converter current signals are available on the Scope2.
Steps involved to configure the model:
Step 1: Importing drive cycle into the signal builder
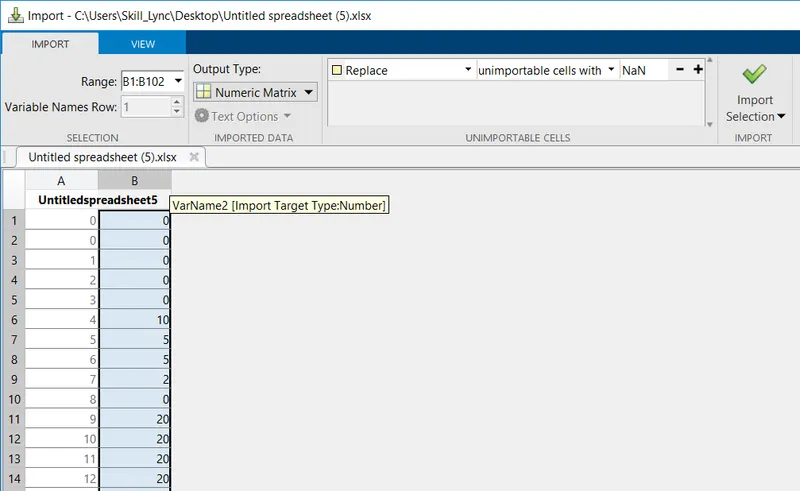
Current cycle profile
Step 2: Saturation block configuration
The upper limit of the model should be set in this block to perform simulation
Step 3: Fuel cell configuration
The type of cell used is selected and its parameters are entered in the fuel cell configuration block
Step 4: Flow regulator block configuration
Where in this block the number of cells to be used hydrogen utilization percentage, operating temperature, fuel pressure values are given.
Step 6: RLC circuit Configuration
Result: SCOPE 1
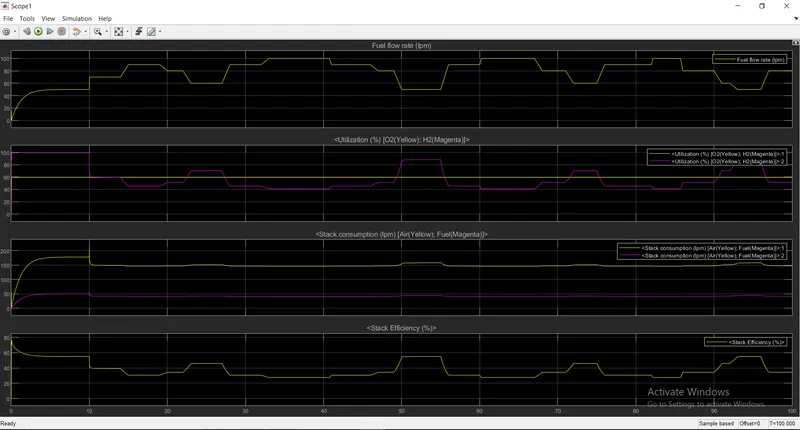
# Where the above graph shows the fuel flow rate increases gradually with respect to the speed and decreases with respect to the speed
# Hydrogen, oxygen utilization graph is almost similar to the stack efficiency percentage but at the time of starting from 0 to 10-sec hydrogen and oxygen utilization are constant but in stack efficiency, it reduces gradually from the peak.
# The stack consumption increases gradually at the start of the vehicle at a time period of 0 to 10-sec then it maintains a constant graph and slightly rises when the vehicle reaches its top speed.
Result: Scope2
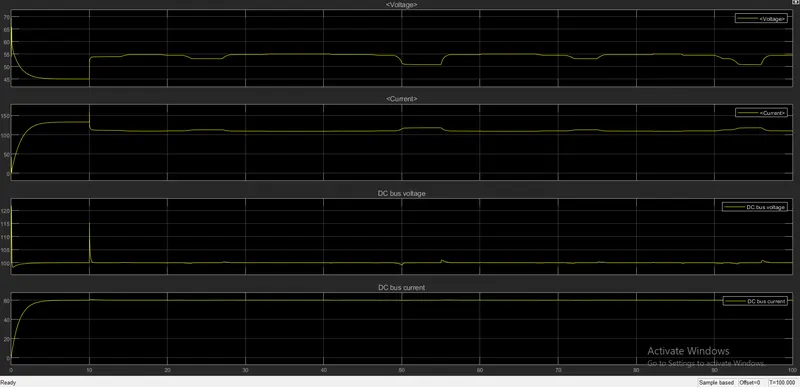
# The DC bus current starts gradually according to the speed of the vehicle at the starting time period of 0 to 10-sec. After that, it maintains a constant graph whatever the speed cycle of the vehicle does.
# DC bus voltage reduces suddenly within a time period of 0.5sec at the time of starting the vehicle and from the time period of 0 to 10-sec it maintains a constant voltage of 100V and suddenly voltage reaches the peak and rises down at a time period of 10sec to 10.2 sec and again it maintains a constant voltage.
# Where the current increases gradually at the start and reaches the peak value where at 10secs time period it increases and decreases at the same point then maintains a constant current at 102amps at the time period of 50secs to 55 secs it increases slightly and constant current is maintained.
# Voltage drops from 65V to 45V at the time period of 0 to 10sec then increases at the time of 10secs with a voltage of 45V. Then reduces at 22-26 secs time period of 52V it reaches to 55V and maintains the voltage then again reaches 48V at the time period of 52-56 secs again it reaches 55V and maintains a constant voltage.