Week 6 - Data analysis
Objective:
- Data visualization
- Compatibility check
- Basic performance calculation
The python code is attached below:
import matplotlib.pyplot as plt
import numpy as np
import math

print("Please make sure that the CONVERGE data file is saved in the same path directory where Python code is saved")

# Compatibility Check

file_name = input('Enter the CONVERGE file having out Extension = ')

if file_name == 'engine_data.out':

    print('\nData file is successfully opened.')

else:

    print('\nFile not recognized. Please provide a valid CONVERGE output file\n')

# Empty array of inputs

crank = []
Pressure = []
Max_Pres = []
Min_Pres = []
Mean_Temp = []
Max_Temp = []
Min_Temp = []
Volume = []
Mass = []
Density = []
Integrated_HR = []
HR_Rate = []
C_p = []
C_v = []
Gamma = []
Kin_Visc = []
Dyn_Visc = []
linecount = 1
label = []
unit = []

for line in open(file_name, 'r'):
    if '#' in line:
        if linecount == 3:
            for j in range(1, 18):
                label.append(line.split()[j])

    if '#' in line:
        if linecount == 4:
            for k in range(1, 18):
                unit.append(line.split()[k])

        linecount = linecount + 1
    if '#' not in line:
        crank.append(float(line.split()[0]))
        Pressure.append(float(line.split()[1]))
        Max_Pres.append(float(line.split()[2]))
        Min_Pres.append(float(line.split()[3]))
        Mean_Temp.append(float(line.split()[4]))
        Max_Temp.append(float(line.split()[5]))
        Min_Temp.append(float(line.split()[6]))
        Volume.append(float(line.split()[7]))
        Mass.append(float(line.split()[8]))
        Density.append(float(line.split()[9]))
        Integrated_HR.append(float(line.split()[10]))
        HR_Rate.append(float(line.split()[11]))
        C_p.append(float(line.split()[12]))
        C_v.append(float(line.split()[13]))
        Gamma.append(float(line.split()[14]))
        Kin_Visc.append(float(line.split()[15]))
        Dyn_Visc.append(float(line.split()[16]))

Inp = np.array(
    [crank, Pressure, Max_Pres, Min_Pres, Mean_Temp, Max_Temp, Min_Temp, Volume, Mass, Density, Integrated_HR, HR_Rate,
     C_p, C_v, Gamma, Kin_Visc, Dyn_Visc])

x = int(input("Enter X-axis Parameter : "))
y = int(input("Enter Y-axis Parameter: "))

fig_name = (str(label[y]) + '  vs  ' + str(label[x]))
plt.figure()
plt.plot(Inp[x], Inp[y])
plt.xlabel(str(label[x]) + str(unit[x]))
plt.ylabel(str(label[y]) + str(unit[y]))
plt.title(fig_name)
plt.show()

# Basic performance calculation - power out put

if x == 7 and y == 1 or x == 1 and y == 7:
    RPM = 1500
    Area = np.trapz(Inp[y], Inp[x])
    Work_done = Area * 1000
    Power = 2 * math.pi * RPM * Work_done / 60
    Fuel_per_Stroke = 20 * 1e-6
    Fuel_per_Sec = Fuel_per_Stroke * RPM * (0.5 / 60)
    Fuel_per_Hour = Fuel_per_Sec * 3600
    BSFC = Fuel_per_Hour / Power

    print('Area under the P-V diagram (Work done):', Work_done, 'kJ')
    print('Power Output of this Engine : ', Power, 'kW')
    print('Specific Fuel Consumption:', BSFC, 'g/kWh')
The code starts with importing the differrent modules for ploting, numercial calculations and math operations. Which is followed by receiving the file name from the user. The file name is then checked, if the name matches "Data file is successfully opened." is printed else "File not recognized. Please provide a valid CONVERGE output file" is printed. Then the empty arrays are created for each parameters, followed by opening and reading through the lines. The lable, units and values are split into its respective arrays, followed by storing them using Inp = np.array([crank, Pressure, Max_Pres, Min_Pres, Mean_Temp, Max_Temp, Min_Temp, Volume, Mass, Density, Integrated_HR, HR_Rate, C_p, C_v, Gamma, Kin_Visc, Dyn_Visc]). The inputs from the columns can be plotted as per user's input of the x-parameter and y-parameter. The basic calculations are then performed if the x-parameter is 1 and y-parameter is 7 or vice versa, followed by printing the values.
Results:
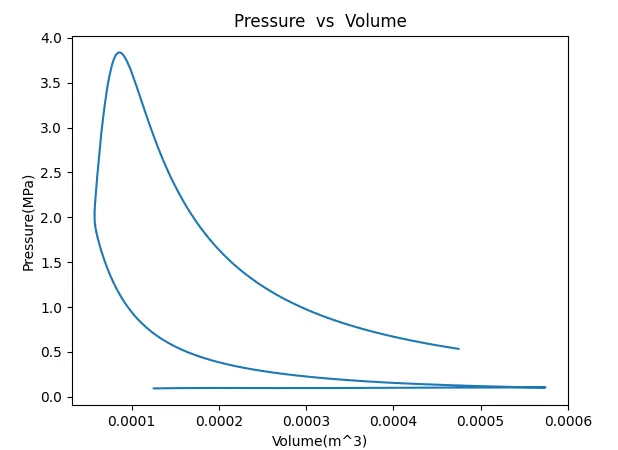
The plot Pressure vs Volume is illutrated below
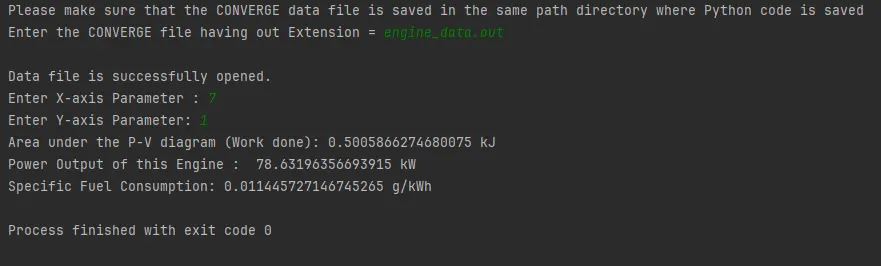
The Basic Calculations as calculated in the python code is illustrated below.
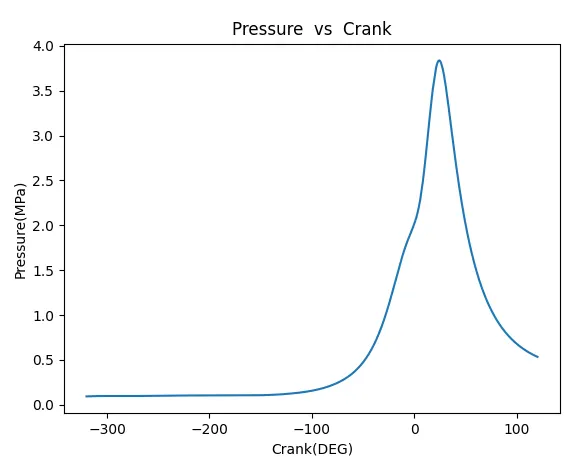
The plot between Pressure and Crank angle is shown below