Week 6 - Data analysis
Aim:
To write a programme that can do
- Data Vizualisation
- Compatibility Check
- Perform basic calculations
Explainations:
Step 1:
We imported required library tools such as matplotlib.pyplot & scipy
Step 2:
We gave the code to perform the compatibilty check on the file
Step 3:
- We then created list of empty arrays for all the variables available on the file
- Then gave an option for the user to select any 2 parameters from the file
Setp 4:
Performed the neccessary coding so that the user can plot a diagram as per their requirement.
Setp 5:
Calculated all the basic calculations such as Area under the curve, Power Output and Specific Fuel Consumption.
PYTHON PROGRAMMING:
# Import Modules
import matplotlib.pyplot as plt
from scipy.integrate import simps

# Compatability test

filename = input('Enter the Converge output file name:')

if filename == 'engine_data.out':
	print("\n Congrats for entering the correct file name. you may now proceed...")


	# Basic Initialisation

	line_count = 1

	#  Creating empty sets for each variable in the file.

	Crank = []
	Pressure = []
	Max_Pressure = []
	Min_Pressure = []
	Mean_Temp = []
	Max_Temp = []
	Min_Temp = []
	Volume = []
	Mass = []
	Density = []
	Integrated_HR = []
	HR_Rate = []
	C_p = []
	C_v = []
	Gamma = []
	Kin_Visc = []
	Dyn_Visc = []
	label = []
	unit = []

	# File Parsing Starts here
    # Importing the given data of the file.
	for line in open('engine_data.out'):

		if '#' not in line:
			Crank.append(float(line.split()[0]))
			Pressure.append(float(line.split()[1]))
			Max_Pressure.append(float(line.split()[2]))
			Min_Pressure.append(float(line.split()[3]))
			Mean_Temp.append(float(line.split()[4]))
			Max_Temp.append(float(line.split()[5]))
			Min_Temp.append(float(line.split()[6]))
			Volume.append(float(line.split()[7]))
			Mass.append(float(line.split()[8]))
			Density.append(float(line.split()[9]))
			Integrated_HR.append(float(line.split()[10]))
			HR_Rate.append(float(line.split()[11]))
			C_p.append(float(line.split()[12]))
			C_v.append(float(line.split()[13]))
			Gamma.append(float(line.split()[14]))
			Kin_Visc.append(float(line.split()[15]))
			Dyn_Visc.append(float(line.split()[16]))


		if '#' in line:
			if line_count is 3:
				for j in range(1,18):
					label.append(line.split()[j])           # Extracting and addding Labels into empty created label = [] list from the given data


			if line_count is 4:
				for k in range(1,18):
					unit.append(line.split()[k])           # Extracting and addding Units into empty created unit = [] list from the given data

			line_count +=1

	# Variables in the given engine_data. out file
	Variables = [Crank,Pressure,Max_Pressure,Min_Pressure,Mean_Temp,Max_Temp,Min_Temp,Volume,Mass,Density,Integrated_HR,HR_Rate,C_p,C_v,Gamma,Kin_Visc,Dyn_Visc]


	# Code to access the data of x-axis and y-axis for the desired plot
	print('\nSelect the numbers from the following list of the Variables')
	print('\n 0. Crank \n 1. Pressure \n 2. Max_Pressure \n 3. Min_Pressure \n 4.Mean_Temp \n 5.Max_Temp \n 6.Min_Temp \n 7.Volume \n 8. Mass \n 9. Density \n 10.Integrated_HR \n 11.HR_Rate \n 12.C_p \n 13.C_v \n 14.Gamma \n 15.Kin_Visc \n 16.Dyn_Visc')

	# Selecting the desired parameters for the desired graph output.
	print('\nChoose x and y Variables by selecting integers from the options given above.')
	x = int(input ('\nEnter the variable for x-axis: '))
	y = int(input ('\nEnter the variable for y-axis: '))

	# Code to plot a graph as per the user.
	plt.plot(Variables [x],Variables [y], linewidth = 3)
	plt.title (str(label[y]) + " vs " +  str(label[x]) + '  Plot')
	plt.xlabel(str(label [x]) + str(unit[x]))
	plt.ylabel( str(label [y]) + str(unit[y]))
	plt.savefig(str(label[y]) + " vs " +  str(label[x]) + '  Plot')
	plt.show()

# Finding area by Simpson rule
Area = float(simps(Pressure, Volume))
Area= Area * 1e+6
print('Area under the curve is: '+ str(Area)+ 'J')

# Calculating Power output
# Inputs
rpm = 1500
rps = 1500/60
stroke_cycle = rps/2
fuel_consumption=20
n = 1

Power_Output = (n*Area*stroke_cycle)/1000
print('power_output from engine: '+ str(Power_Output)+'kW')

# Calculating Specific Fuel consumption
SFC = fuel_consumption  * pow(10,-6) * stroke_cycle * 3600 / (Power_Output * 1000)
print('specific fuel consumption, sfc is: '+str(SFC)+'(kg/hr)/(kW)')
OUTPUTS:
Compatibility Check:

P-V diagram of the Engine
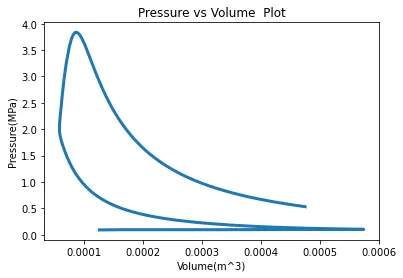
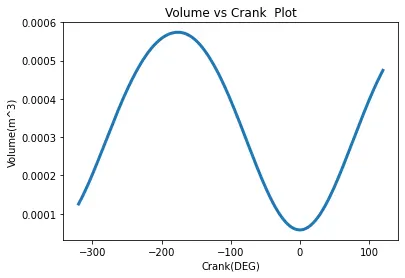
CRANK-PRESSURE Diagram
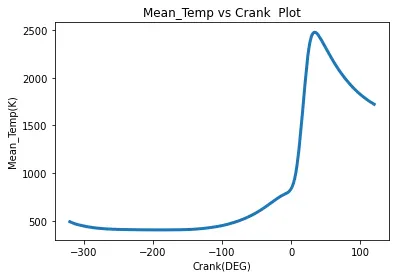
CRANK-Mean TEMPERATURE
Basic calculations:
-
- Conclusion:

Hence data analysis is finally completed