Project 1 - Parsing NASA thermodynamic data
PARSING OF NASA THERMODYNAMIC DATA
AIM: TO WRITE A CODE IN MATLAB TO PARSE THE NASA THERMODYNAMIC DATA FILE AND THEN CALCULATE THERMODYNAMIC PROPERTIES OF VARIOUS GAS SPECIES.
OBJECTIVE:
- TO WRITE A FUNCTION THAT EXTRACTS THE 14 COEFFICIENTS AND CALCULATES THE ENTHALPY, ENTROPY AND SPECIFIC HEATS FOR ALL THE SPECIES.
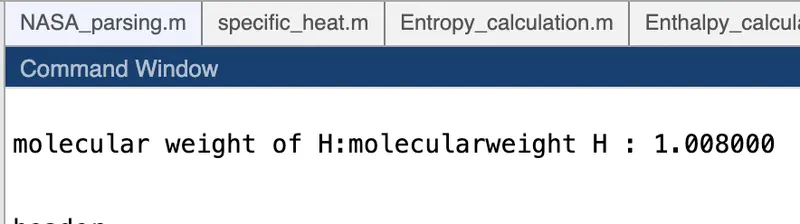
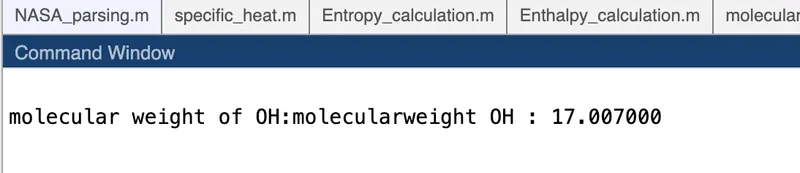
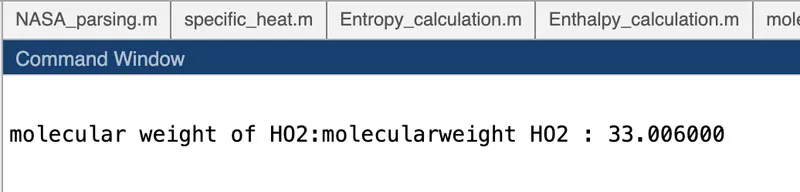
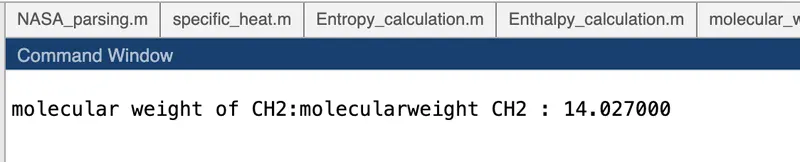
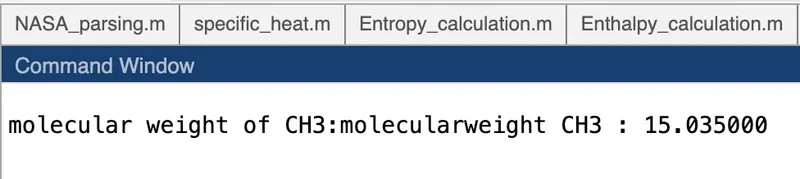
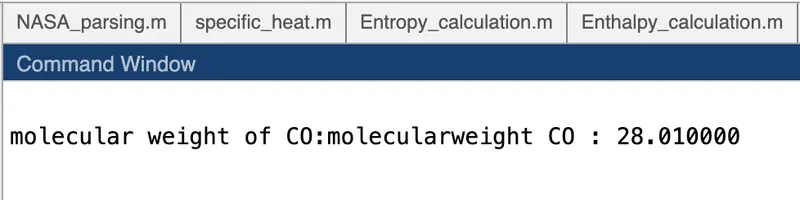
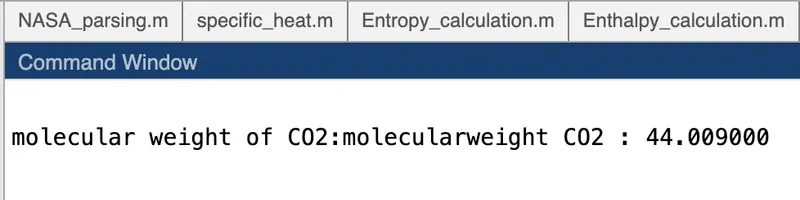
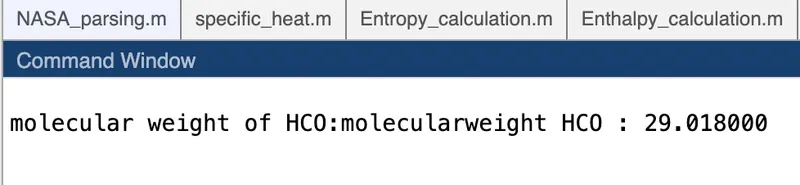
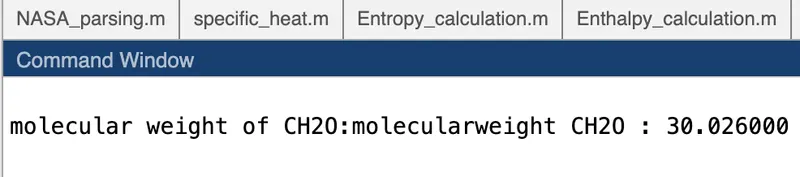
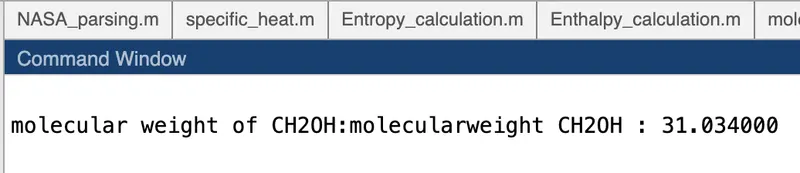
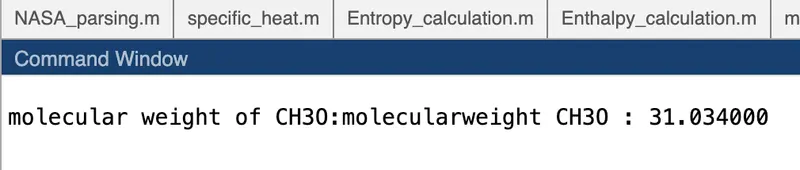
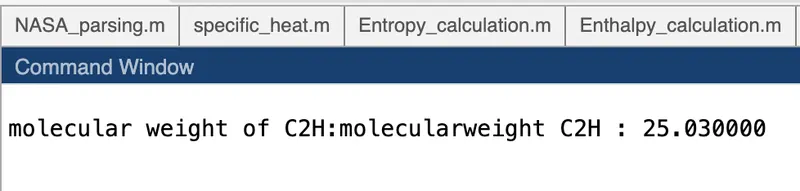
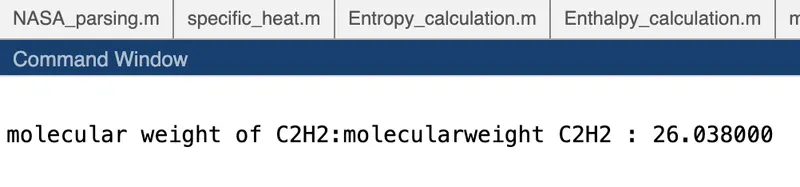
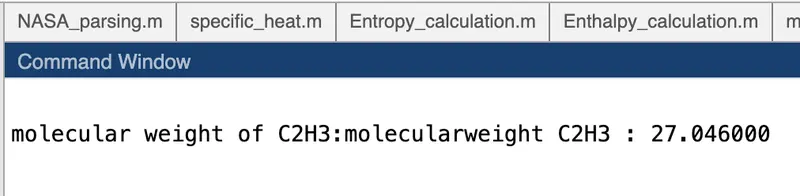
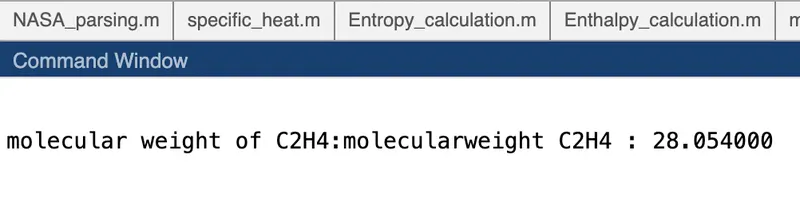
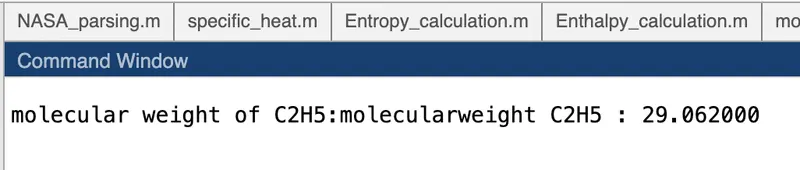
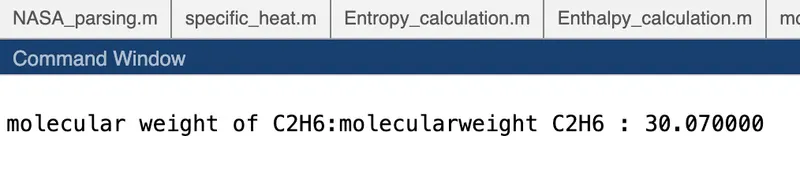
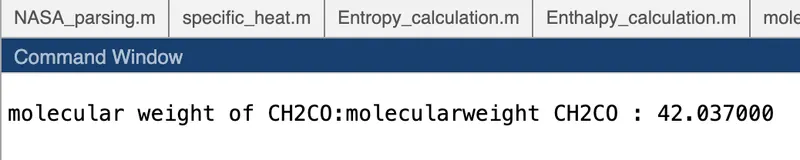
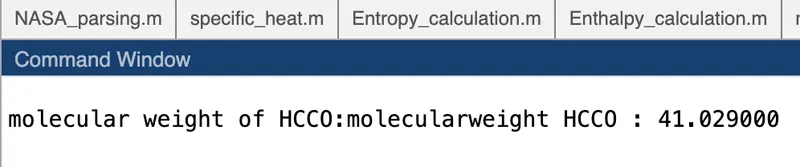
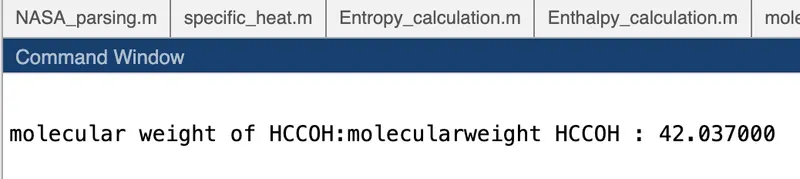
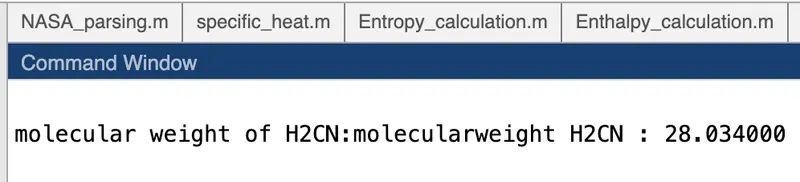
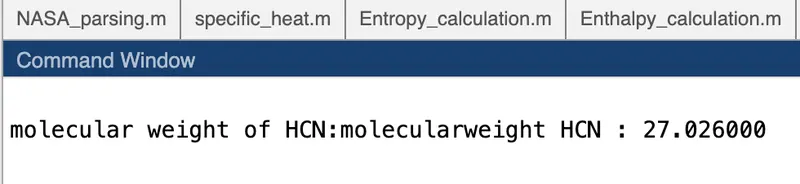
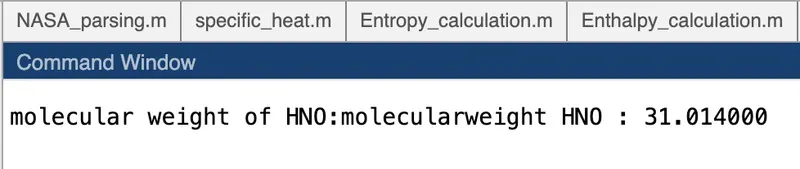
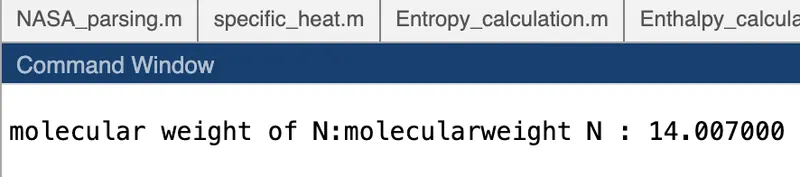
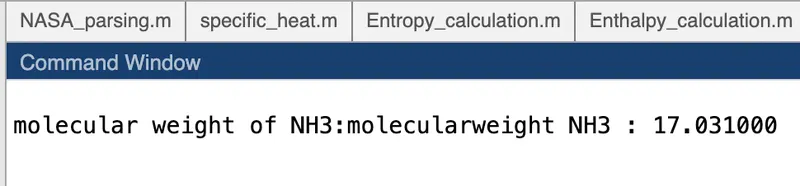
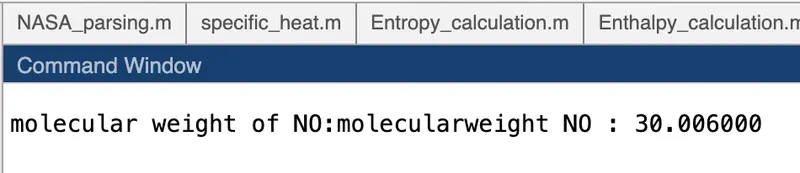
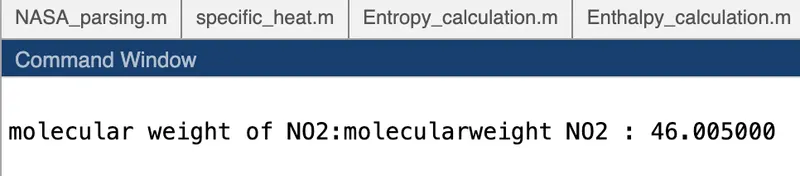
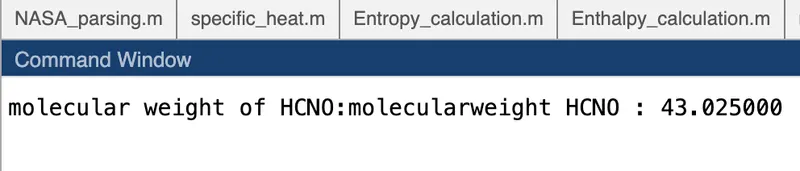
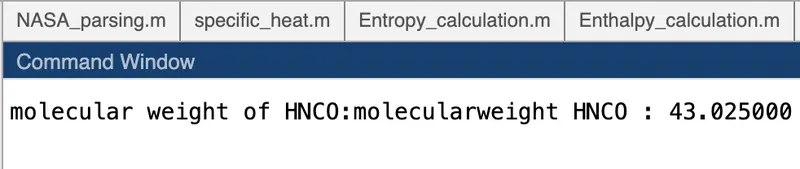
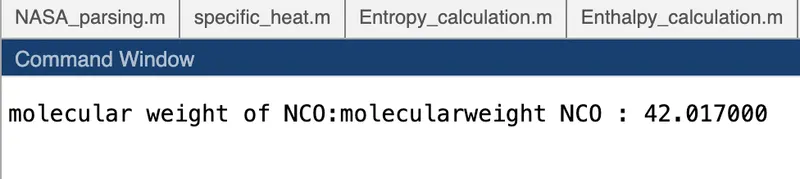
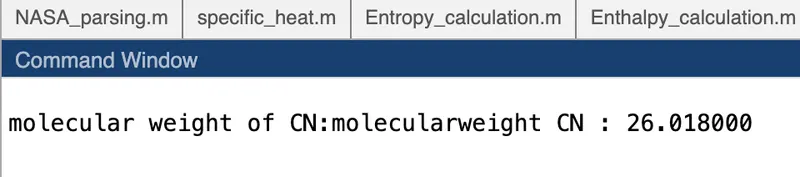
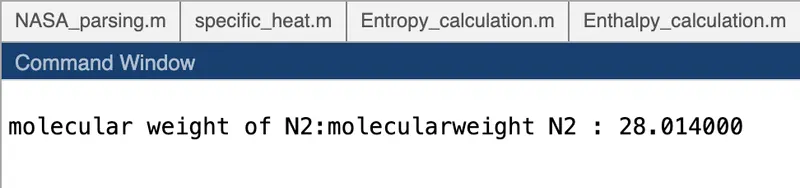
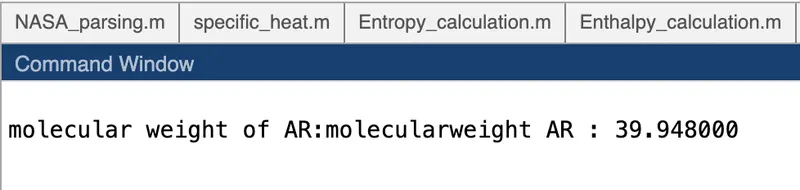
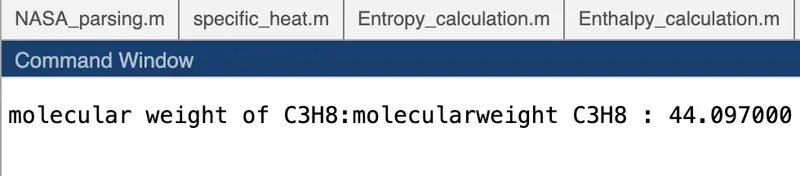
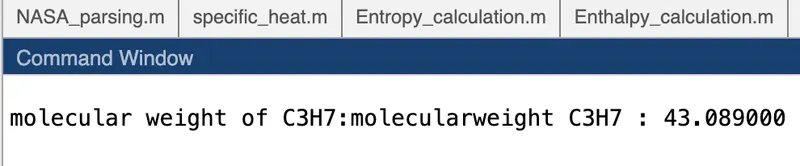
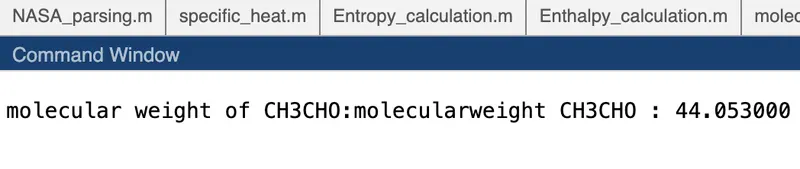
- TO CALCULATE THE MOLECULAR WEIGHT OF EACH SPECIES AND DISPLAYING THE OUTPUT IN THE COMMAND WINDOW
- TO PLOT ENTHALPY, ENTROPY AND SPECIFIC HEATS FOR THE LOCAL TEMPERATURE RANGE(LOW TO HIGH) FOR ALL SPECIES.
- TO SAVE PLOTS AS IMAGES WITH APPROPIATE NAMES AND THEN DUMP THEM IN SEPERATE FOLDERS FOR EACH SPECIES.
NASA thermodynamic file consists of 14 coefficiennts for 53 different elements. These coefficients are utilized to determine the enthalpy, entropy and specific heat for each element. Each element has their own local temperature(low to high).
AR C C2H. C2H2. C2H3. C2H4
C2H5 C2H6. C3H7. C3H8. CH CH2
CH2(S) CH2CHO CH2CO CH2O. CH2OH. CH3
CH3CHO CH3O. CH3OH. CH4 CN. CO
CO2 H. H2 H2CN. H2O. H2O2
HCCO CCOH. HCN HCNN HCNO. HCO
HNCO HNO. HO2 HOCN N N2
N2O NCO NH. NH2. NH3. NNH
N NO2 O O2 OH
WHAT IS KNOWN AS FILE PARSING?
File parsing in MATLAB refers to the process in which information can be read from a particular text file and then how we can use it in computer programming.
There are seveeral steps which are aas follows:
- DEfining the function
- cerating an input parser object
- adding inputs
- setting properties for parsing
- parsing the inputs
- using inputs in the function
- calling the function
Enthalpy, entropy and specific heat
Enthalpy, entropy and specific heats are the 3 quantities which play a major role in thermodynamics. These quantities are required to estimate how the combustion is going on and how efficient it is going to be.
Enthalpy:Enthalpy is a thermodynamics property of a substance and is defined as the sum of its internal energy and the product of its pressure and volume.
Entropy: Entropy represents the unavailability of a system's thermal energy for conversion into mechanical work, often interpreted as the degree of disorder or randomness in the system.
Specific Heat:Specific heat of solids and liquids is only a function of temperature but specific heat of gaseous substances is a function of temperature and process.
NASA came up with polynomials that can be used to evaluate the thermodynamic properties such as Enthalpy, entropy, Specific Heat.They have also documented the coefiicients that are required to evaluate these polynomials for 1000+ speceis.
The NASA polynomials are:
`C_p/(R) = a1 + a2*T + a3*T^2 + a4*T^3 + a5*T^4`
`H/(RT) = a1 + a2*T/2 + a3*(T^2)/3 + a4*(T^3)/4 + a5*(T^4)/5 + (a6)/T`
`S/R = a1*lnT + a2*T + a3*(T^2)/2 + a4*(T^3)/3 + a5*(T^4)/4 + a7`
where, R is the universal gas constant
T is the temperature and
a1,a2,a3,a4,a5,a6,a7 are the numerical coefficents supplied in the thermodynamic file.
The first 7 coefficients are High temperature coefficients(above 1000K) and the second 7 coefficients are low temperature coefficients(below 1000K).
CODING
- SPECIFIC HEAT
`C_p/(R) = a1 + a2*T + a3*T^2 + a4*T^3 + a5*T^4`
%specific heat calculation function
function Cp = specific_heat(a1,a2,a3,a4,a5,a8,a9,a10,a11,a12,Temp,R,local_mid_temp)
%comparing with local temperature
%if less than local temperature-minimum coefficients are taken
if Temp <= local_mid_temp
    Cp = R*(a8+(a9*Temp)+(a10*(Temp).^2)+(a11*(Temp).^3)+(a12*(Temp).^4));
else
    Cp = R*(a1+(a2*Temp)+(a3*(Temp).^2)+(a4*(Temp).^3)+(a5*(Temp).^4));
    %else maximum coefficients taken
end
end
- ENTHALPY
`H/(RT) = a1 + a2*T/2 + a3*(T^2)/3 + a4*(T^3)/4 + a5*(T^4)/5 + (a6)/T`
function H = Enthalpy_calculation(a1,a2,a3,a4,a5,a6,a8,a9,a10,a11,a12,a13,Temp,R,local_mid_temp)
%%comparing with local temperature
%if less than local temperature-minimum coefficients are taken
if Temp <= local_mid_temp
    H = R*Temp.*(a8+(a9.*(Temp)/2)+((a10*(Temp).^2)/3)+((a11*(Temp).^3)/4)+((a12*(Temp).^4)/5)+(a13./Temp));
else
     H = R*Temp.*(a1+(a2.*(Temp)/2)+((a3*(Temp).^2)/3)+((a4*(Temp).^3)/4)+((a5*(Temp).^4)/5)+(a6./Temp));
     %else maximum coefficients taken
end
end
- ENTROPY
function S = Entropy_calculation(a1,a2,a3,a4,a5,a7,a8,a9,a10,a11,a12,a14,Temp,R,local_mid_temp)
%%comparing with local temperature
%if less than local temperature-minimum coefficients are taken
if Temp <= local_mid_temp
    S = R.*(a8.*log(Temp)+(a9.*(Temp)+(a10*((Temp).^2)/2)+(a11*((Temp).^3)/3)+(a12*(Temp).^4)/4)+a14);
else
    S = R.*(a1.*log(Temp)+(a2.*(Temp)+(a3*((Temp).^2)/2)+(a4*((Temp).^3)/3)+(a5*(Temp).^4)/4)+a7);
     %else maximum coefficients taken
end
end
- MOLECULAR WEIGHT
%calculation molecular weight
function [W] = molecular_weight(species_name)
% Standard atomic names(creating array containing atomic names)
atomic_name = ['H','C','O','N','A'];
%HYDROGEN,CARBON,OXYGEN,NITROGEN,ARGON
fprintf('molecular weight of ')
fprintf(species_name);
fprintf(':');
%standard atomic numbers
atomic_weight = [1.008, 12.011, 15.999, 14.007, 39.948];
%molecule starting range
W = 0;
%adding atomic number to get particular values
for i = 1:length(species_name)
    for j = 1:length(atomic_name)
        if strcmpi(species_name(i),atomic_name(j))
            W = W + atomic_weight(j);
            position = j;
        end
    end
    n = str2double(species_name(i));
    if n>1
         W = W + atomic_weight(position)*(n-1);
    end
end
fprintf('molecularweight %s : %f',species_name,W );
disp(' ')
MAIN CODING FOR PARSING NASA THERMODYNAMIC FILE
clear all
close all
clc

%Reading NASA thermodynamic file
f1 = fopen('THERMO.dat','r')

%Skipping 1st 5 lines of the file
for i=1:5
    a = fgetl(f1)
end
for i=1:53
header = fgetl(f1)
b = strsplit(header,' ')
end1 = length(b);
species_name = b{1};


local_low_temp = str2double(b{end1-3});
local_mid_temp = str2double(b{end1-1});
local_high_temp = str2double(b{end1-2});

%Extracting line 1 coefficient values
line1 = fgetl(f1)
posE1 = strfind(line1,'E')
a1 = str2double(line1(1:posE1(1)+3));
a2 = str2double(line1(posE1(1)+4:posE1(2)+3));
a3 = str2double(line1(posE1(2)+4:posE1(3)+3));
a4 = str2double(line1(posE1(3)+4:posE1(4)+3));
a5 = str2double(line1(posE1(4)+4:posE1(5)+3));

%Extracting line 2 coefficient values
line2 = fgetl(f1)
posE2 = strfind(line2,'E')
a6  = str2double(line2(1:posE2(1)+3));
a7  = str2double(line2(posE2(1)+4:posE2(2)+3));
a8  = str2double(line2(posE2(2)+4:posE2(3)+3));
a9  = str2double(line2(posE2(3)+4:posE2(4)+3));
a10 = str2double(line2(posE2(4)+4:posE2(5)+3));

%extracting line 3 coefficent values
line3 = fgetl(f1)
posE3 = strfind(line3,'E')
a11 = str2double(line3(1:posE3(1)+3));
a12 = str2double(line3(posE3(1)+4:posE3(2)+3));
a13 = str2double(line3(posE3(2)+4:posE3(3)+3));
a14 = str2double(line3(posE3(3)+4:posE3(4)+3));

%creating a range for temperature values
Temp = linspace(local_low_temp,local_high_temp,1000);

%giving universal gas constant in unit[J/(mol-K)]
R = 8.314;

%Calculation of specific heat
Cp = specific_heat(a1,a2,a3,a4,a5,a8,a9,a10,a11,a12,Temp,R,local_mid_temp);
%Entropy calculation
S = Entropy_calculation(a1,a2,a3,a4,a5,a7,a8,a9,a10,a11,a12,a14,Temp,R,local_mid_temp);
%Enthalpy calculation
H = Enthalpy_calculation(a1,a2,a3,a4,a5,a6,a8,a9,a10,a11,a12,a13,Temp,R,local_mid_temp);

%calculation of molecular weight
W = molecular_weight(species_name);

%read and write molecular list
molecular_list = fopen('molecular weight.txt','a+');
fprintf(molecular_list,'molecular weight of %s is %f n',species_name,W);
fclose(molecular_list);

%plotting(Cp,H,S,Temp)
%temperature vs Specific heat
figure(1)
plot(Temp,Cp,'linewidth',2,'color','b')
grid on;
xlabel('Temperature in K')
ylabel('Cp in J/(mol-K)')
title('Temperature vs Specific heat')


%Temperature vs Entropy
figure(2)
plot(Temp,S,'linewidth',2,'color','r')
grid on;
xlabel('Temperature in K')
ylabel('S in J/K')
title('Temperature vs Entropy')

%Temperature vs Enthalpy
figure(3)
plot(Temp,H,'linewidth',2,'color','g')
grid on;
xlabel('Temperature in K')
ylabel('H in J/Kg')
title('Temperature vs Enthalpy')

%creating file to dump all speceies data and their plots
mkdir(species_name)
cd(species_name)
saveas(1,'Temperature vs Specific heat.jpg')
saveas(2,'Temperature vs Entropy.jpg')
saveas(3,'Temperature vs Enthalpy.jpg')
cd ..
end
SETPS AND EXPLAINATION FOR THIS CODE:
- at first we give basic commands such as clear all,close all and clc to clear all the variables, plots and clear the workspace
- then we open the NASA theermo.dat file and then read the same file using commands such as 'fopen' and 'r' command respectively
- we use fgetl command to get the lines of the fle
- then we use for end loop to skip the first 5 lines of the file
- then we again use the for end loop now to read the rest of the lines of the file.
- we use b = strsplit(header,' ') this command to read the header of the file
- then we find the local (low, high and mid) temperatures
- and give a linspace command to set the range between local low temperature and local high temperature with 1000 values in between them.
- then we extract all the 14 coefficient values of the species and this is set to repeat for all the species.
- after that the specific heat,enthalpy and entropy is calculated for all the species
- also the molucular weight of each and every species is calculated.
- then plot command is used to plot the specific heat, entropy and enthalpy vs temperature for all the species
- then we created a file to dump all the species and their respective file using mkdir command.
SYNTAX USED IN THIS PROGRAMME:
- fopen - to open a file
- fgetl - to get the lines of the file
- strsplit - to split string or charecter vector at specified delimeter
- str2double - convert string array to number array
- linspace - to create linearly spaced vectors
- fprintf - to write formatted data in file
- fclose - to close the file
- mkdir - to create new directory
- cd - to change working directory
OUTPUT:
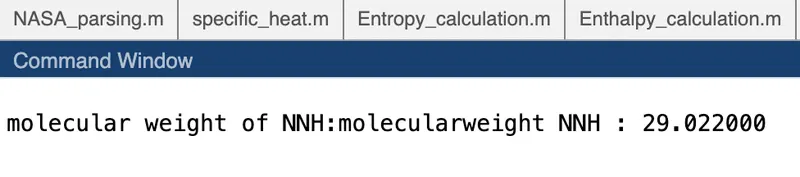
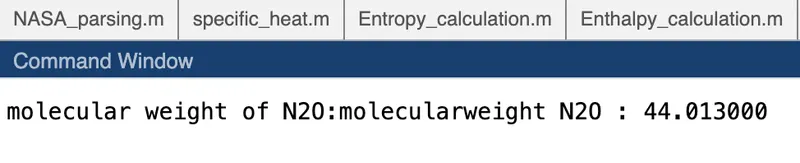
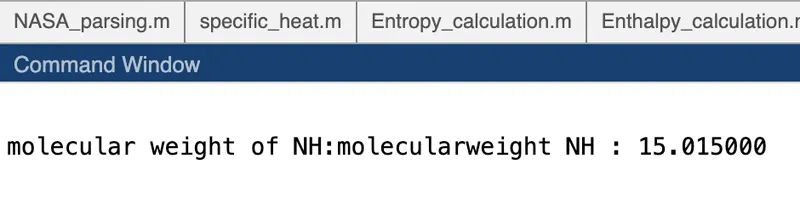
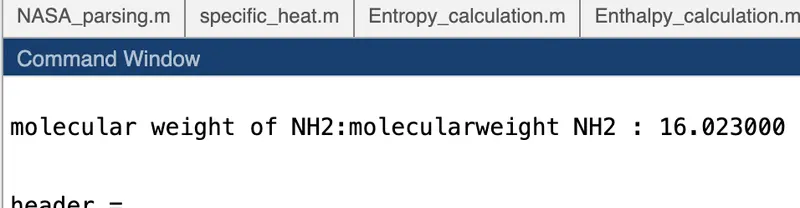
MOLECULAR WEIGHT FOR EACH SPECIES:












NOW SHARING THE SCREENSHOT OF ALL THE FILES SAVED
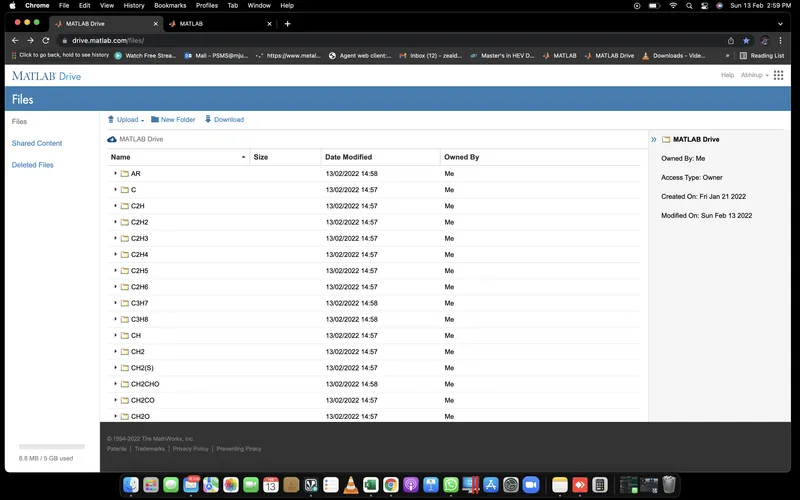
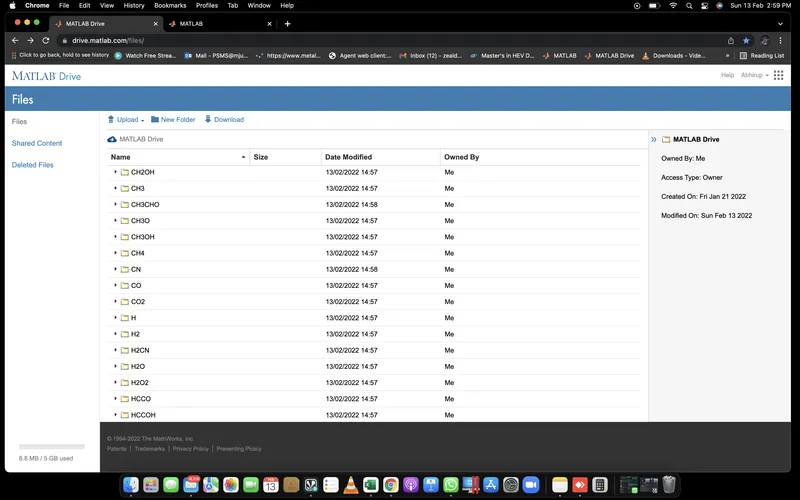
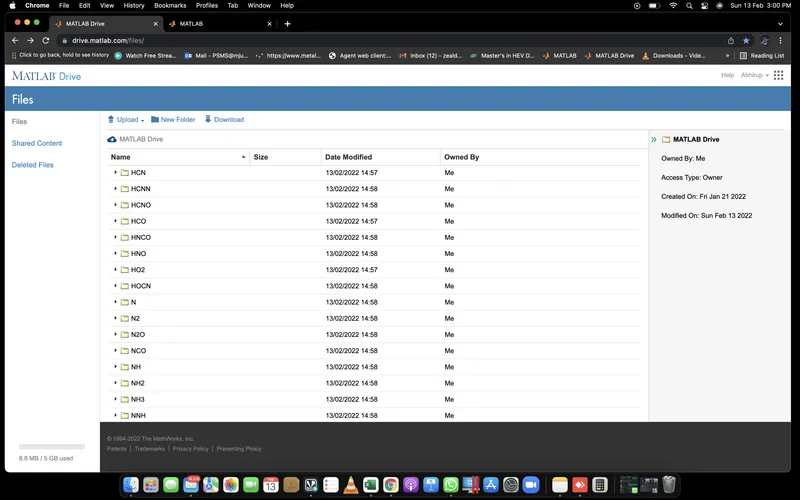
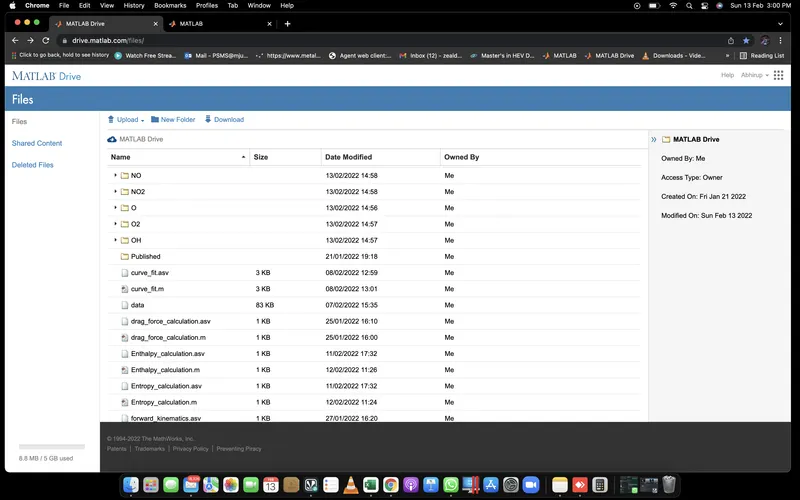
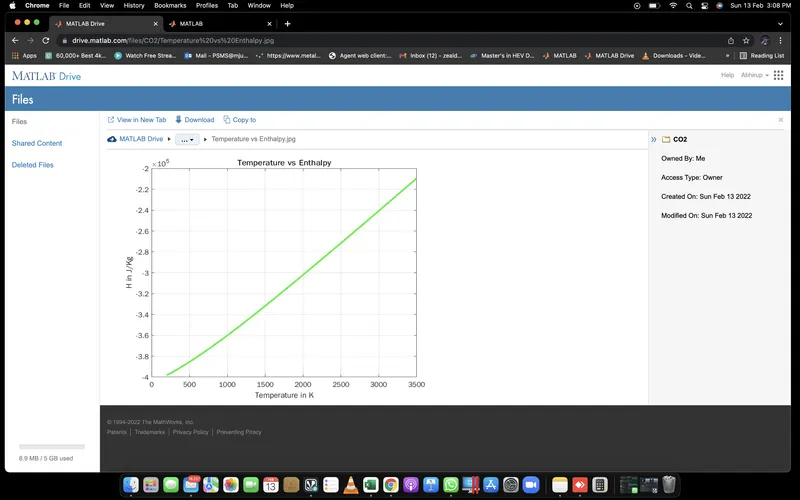
SHARING THE SCREENSHOTS OF THE PLOTS OF O2, CO2, N2
- ALL PLOTS OF O2
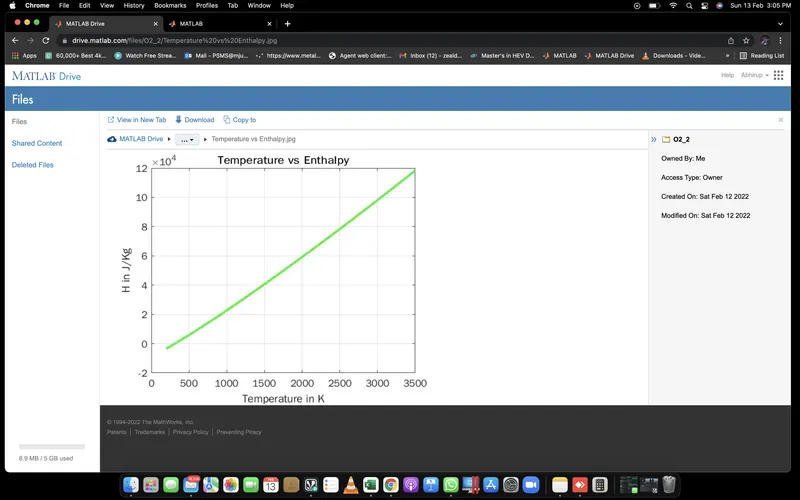
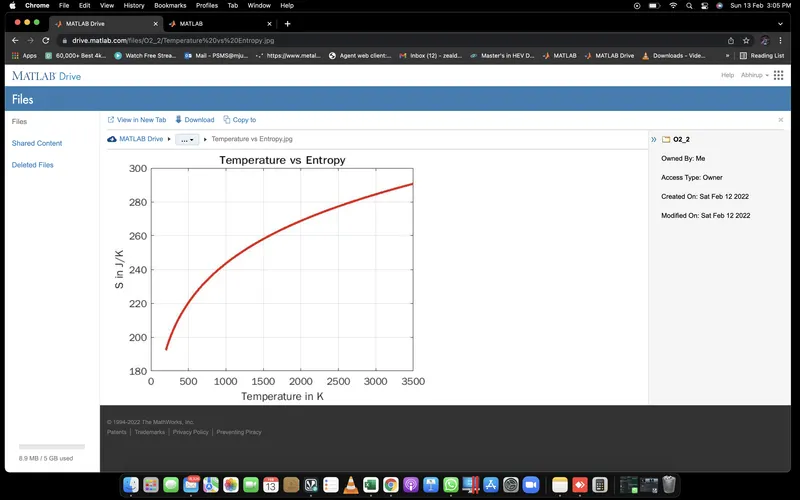
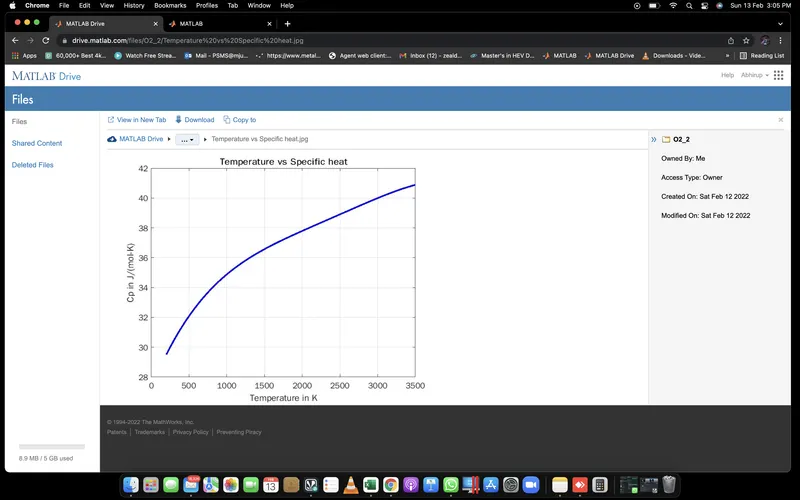
- ALL PLOTS FOR CO2
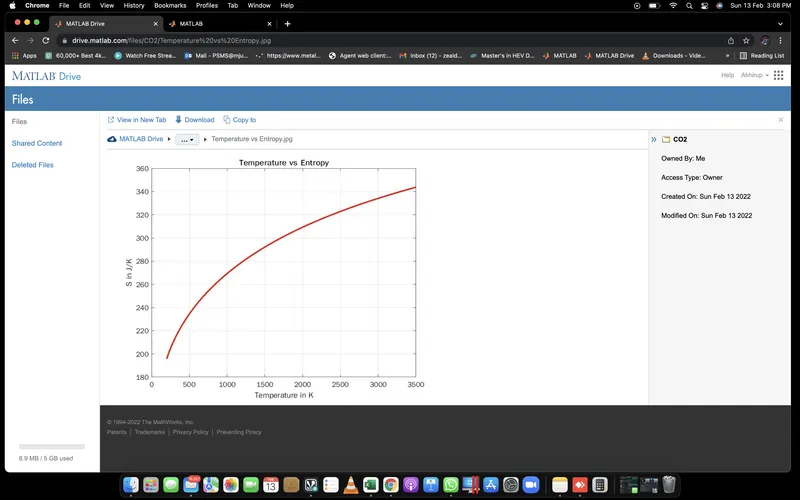
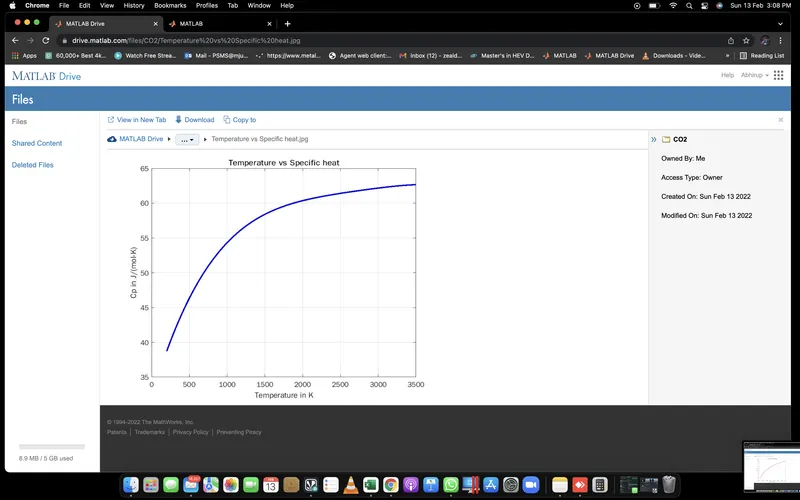
- ALL PLOTS FOR N2
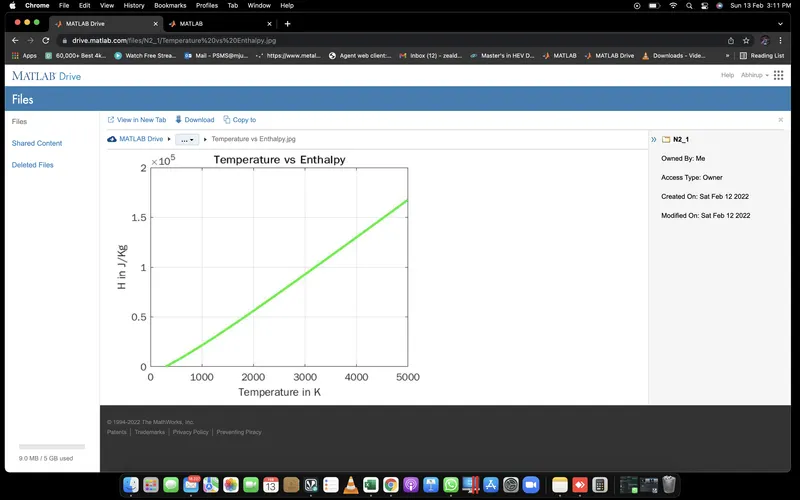
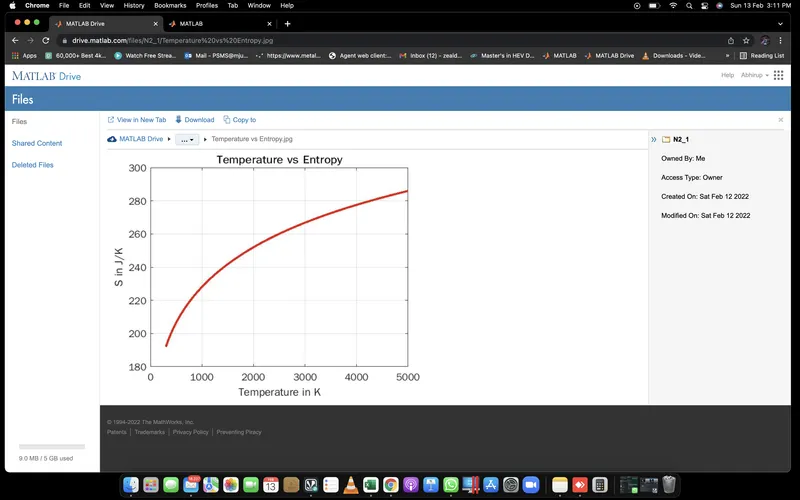
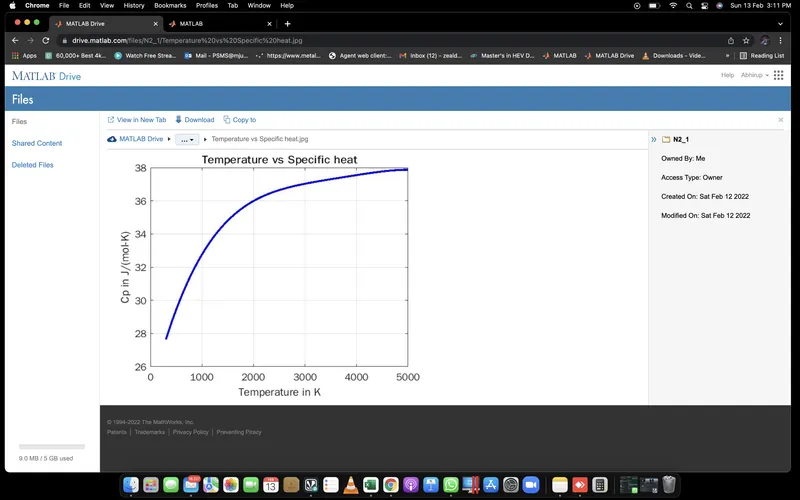
NASA PARSING DATA FILES WITH ALL PLOTS AND FOLDERS LINK DOWN BELOW
https://drive.google.com/drive/folders/15llbP8W2dD5xcs143vN9Q-_B8gr0tWv4?usp=sharing
MATERIALS AND REFERENCES USED:
- YOUTUBE
- WIKIPEDIA