Week 6 - Data analysis
Python code:
import math
import numpy as np
import matplotlib.pyplot as plt
line_count = 1
crank = []
pressure = []
volume = []
for line in open('engine_data.out'):
if '#' not in line:
data = line.split()
crank.append(float(data[0]))
pressure.append(float(data[1]))
volume.append(float(data[7]))
line_count = line_count + 1
plt.figure(1)
plt.plot(crank,pressure,color='g',linewidth= 3)
plt.xlabel('Crank (deg)')
plt.ylabel('Pressure (MPa)')
plt.title('Pressure vs Crank')
plt.savefig('P Vs C.png')
plt.grid()
plt.show()
plt.figure(2)
plt.plot(volume,pressure,color='r',linewidth = 3)
plt.xlabel('Volume (m^3)')
plt.ylabel('Pressure (MPa)')
plt.title('P-V diagram')
plt.savefig('P-V diagram.png')
plt.grid()
plt.show()
P = 1000000*np.array(pressure)
V = np.array(volume)
AREA = np.trapz(P,V)
print('Net workdone (Area under P-V diagram)=',AREA,'Joules')
Power = (AREA*2*math.pi*(1500/60))/1000
print('Power output of the system=',Power,'KW')
SFC = 20*pow(10,-6)*3600/Power
print('Brake specific fuel consumption=',SFC,'g/KWh')
Output:
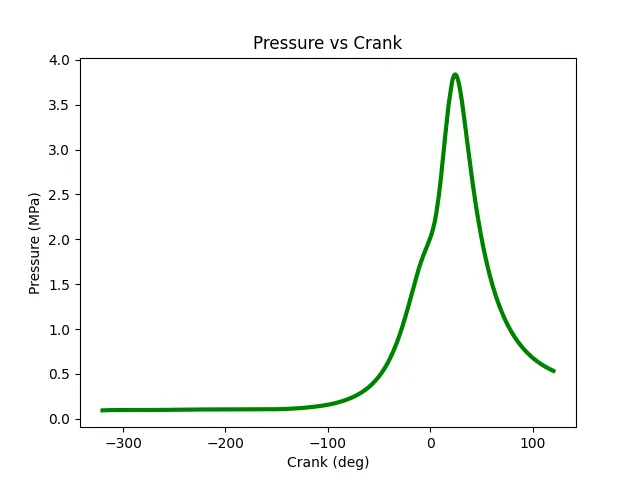
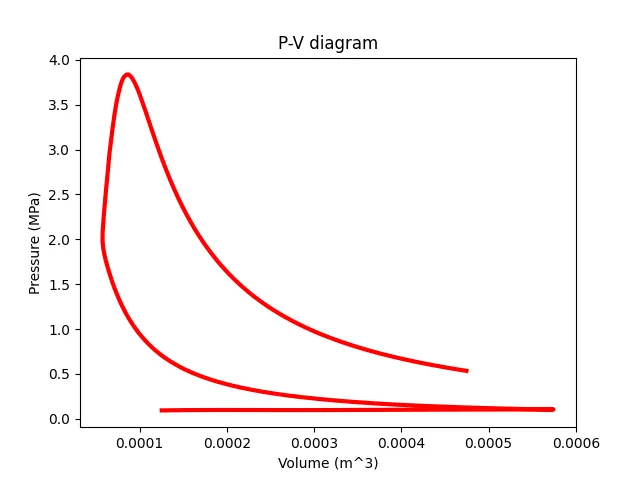
Net workdone (Area under P-V diagram)= 500.5866274680076 Joules
Power output of the system= 78.63196356693916 KW
Brake specific fuel consumption= 0.0009156581717396209 g/KWh