Week 6 - Data analysis
AIM :
To write a Python script to analyse and parse the provided engine data file.
OBJECTIVES :
1. Data Visualizer
- Write a python script which takes the column number as an input and outputs the respective parameter plots, corresponding to the column number.
- Automate the plot title and labels such that the information should be automatically extracted from the respective columns for any combination of the inputs provided and be displayed on the plot.
- Each file should automatically be saved by the names of the extracted labels.
2. Compatibility Check
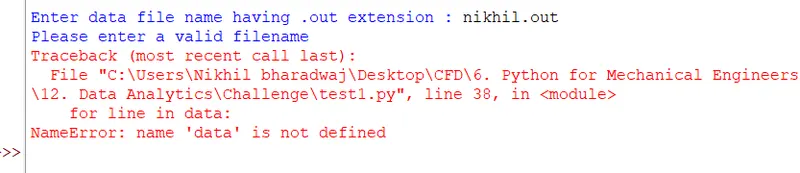
If an incompatible file is provided, it should throw an error urging us to enter a valid filename. On entering a valid filename, it should print a message showing “File Successfully Opened”.
3. Performance Calculations
- Calculate the area under the P-V diagram.
- Calculate the power output of the engine. Assume engine running at 1500 RPM.
- Calculate the specific fuel consumption (BSFC) when the engine consumes 20µg of fuel per stroke.
GOVERNING EQUATIONS :
Given Data :
1. Engine Rotation Speed ( `n` ) = `1500` `"rpm"`
2. Fuel Consumed per Stroke = `20` `mug`
Formulae :
1. Work
Area under the P-V diagram = Work done by the engine
Work done = Area * `10^3` in `kW`
2. Power Output
`P = (2pi*n*W)/60`
Where,
`n` = Engine speed (`"rpm"`)
`W` = Work done by the engine (`kW`)
3. Brake Specific Fuel Consumption
`BSFC = "Fuel Consumption per Hour" / "Power Output"`
PROGRAM & EXPLANATION :
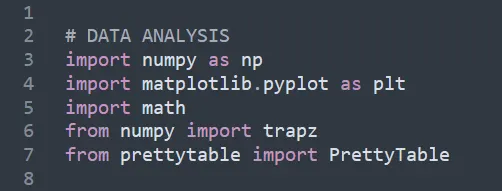
The first and foremost step in writing the program is importing the necessary modules. Here, we import the “PrettyTable” module as well, by the use of which we are going to create a table of the extracted data. The following modules are imported into Python.
Compatibility Check :
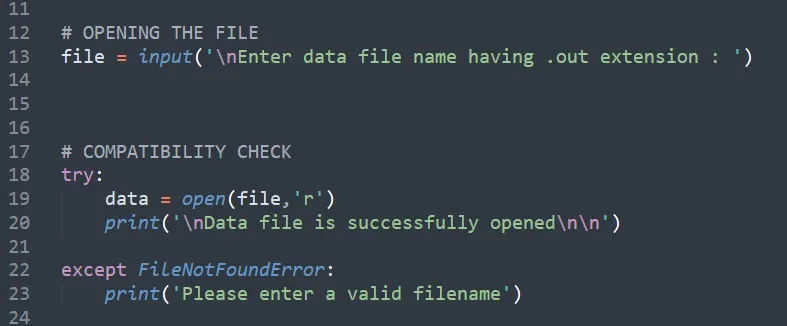
In this step, we are going to import the data file into the program and check for compatibility.
- We input the name of the file having a “.out” extension, which is saved in the same directory as that of the program.
- We define a try-except command such that if the input file name is compatible, it successfully opens the file reads its contents. If an incompatible file name in provided, it throws an error message urging us to input a valid filename.
Column Numbers, Parameters & Units :
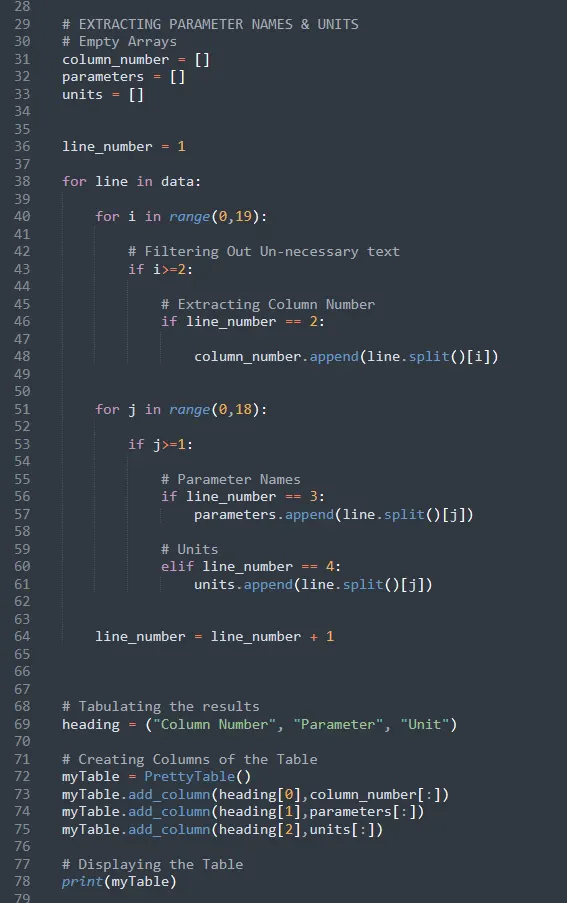
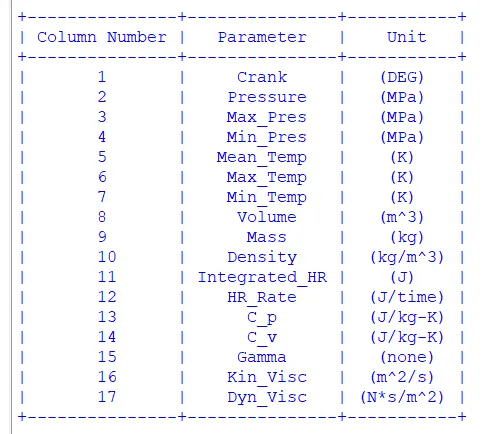
In this step, we extract the column numbers, parameter names and their respective units from the given data file and tabulate them altogether.
- We define empty arrays for column numbers, parameters and units which are going to be appended later on.
- For the respective lines of the data file, we use a for loop to split the words or values with respect to the spaces in-between them. Splitting the contents of the 2nd line of the file gives us the values of column numbers. Similarly, the 3rd and 4th lines give us the parameter names and units. A for loop ensures the operation is carried out for the entire range of values and thereby extracting the required data of all 17 parameters. Finally, they are appended onto their respective empty arrays.
- We use the “PrettyTable” function to create a tabulation of all the extracted information.
Data Extraction & Label Automation :
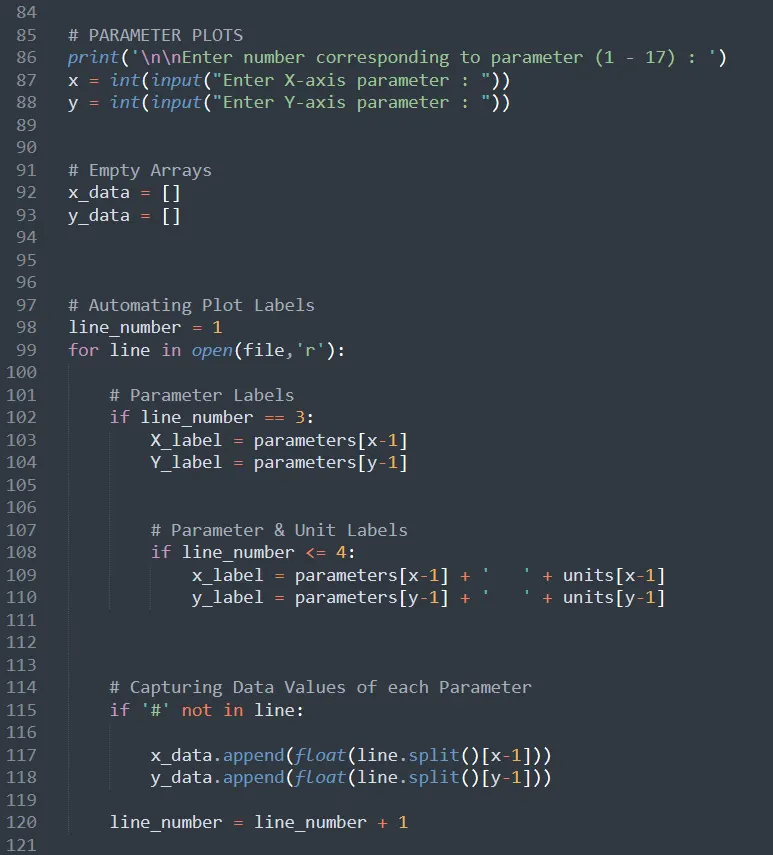
In this step, we extract the numerical values from the file and also automate the x & y – labels such that for any combination of column number input, the titles are automatically generated with the plots.
- We provide ‘x’ and ‘y’ as user-defined inputs, representing the column numbers corresponding to the parameter. Two empty arrays for the x and y – data are also created, which is going to be appended later on.
- Next, we automate the x and y – labels using for and if loops such that for every input value of x and y, the respective plot labels are automatically updated. Therefore, the parameter name as well as its unit is displayed on the plot labels.
- Finally, we extract the numerical data from the file by reading all the lines which do not contain the symbol “#” and append them to their respective empty arrays.
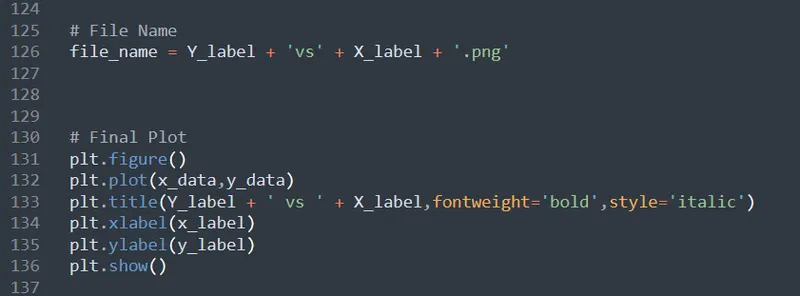
Final Plot :
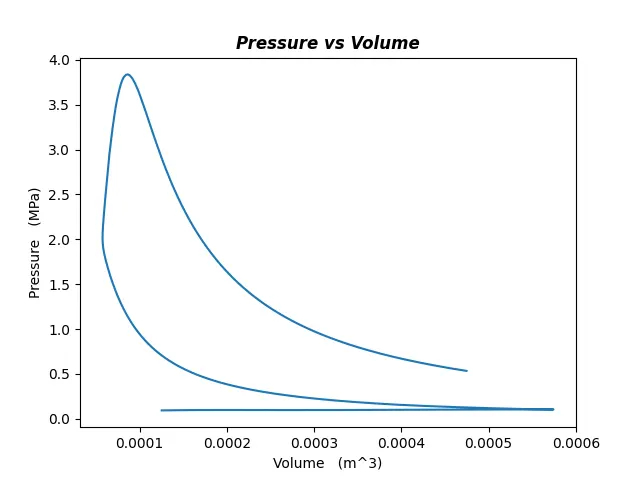
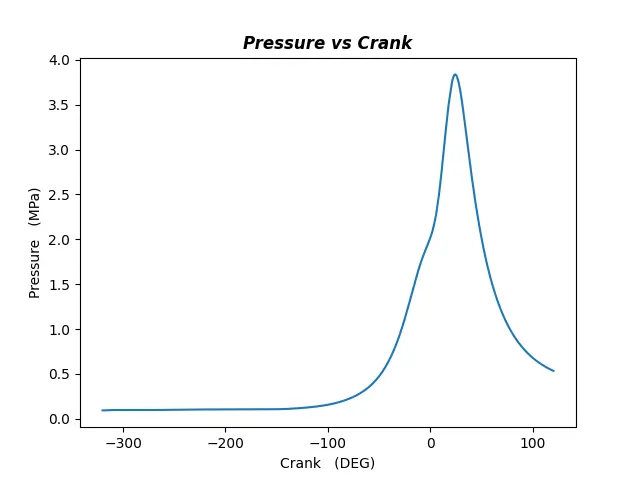
The plots of the extracted x & y-data values are thereby obtained. The respective plot labels are automatically generated, corresponding to the input parameters.
Performance Calculations :
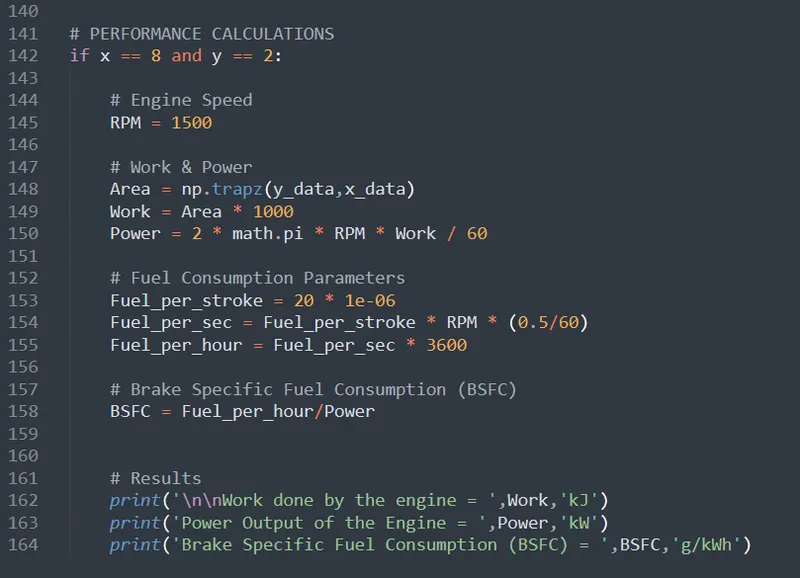
In this step, the various performance parameters of the engine are calculated.
- The work done by the engine (`kW`) is found out by calculating the area under the `P-V` plot.
- For a given engine speed of `1500` rpm, the power output of the engine is calculated as well.
- Finally, the specific fuel consumption (BSFC) of the engine is calculated as the ratio of the fuel consumed by the engine per hour to the power output of the engine.
RESULTS :
The following results are obtained from the above program.
1. Compatibility Check
By providing the proper file name, the file is read and a popup is displayed as follows.

In the case of an incompatible file name is provided, the following error message is displayed.
2. Tabulated Results
The following extracted data of the column numbers, parameter names along with their units are tabulated as shown below.
3. P-V Plot
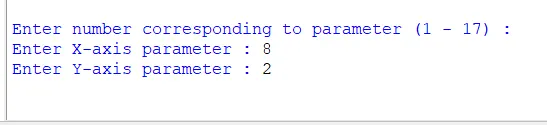
The user-defined inputs of the respective parameters are provided as follows.
The output plot is obtained as follows.
4. Crank Angle vs Pressure Plot
The inputs provided are as follows.

The output plot is obtained as shown.
Final Program Code :
# DATA ANALYSIS
import numpy as np
import matplotlib.pyplot as plt
import math
from numpy import trapz
from prettytable import PrettyTable


# OPENING THE FILE
file = input('\nEnter data file name having .out extension : ')


# COMPATIBILITY CHECK
try:
	data = open(file,'r')
	print('\nData file is successfully opened\n\n')

except FileNotFoundError:
	print('Please enter a valid filename')


# EXTRACTING PARAMETER NAMES & UNITS
# Empty Arrays
column_number = []
parameters = []
units = []


line_number = 1

for line in data:

	for i in range(0,19):

		# Filtering Out Un-necessary text
		if i>=2:

			# Extracting Column Number
			if line_number == 2:

				column_number.append(line.split()[i])


	for j in range(0,18):

		if j>=1:

			# Parameter Names
			if line_number == 3:
				parameters.append(line.split()[j])

			# Units
			elif line_number == 4:
				units.append(line.split()[j])


	line_number = line_number + 1


# Tabulating the results
heading = ("Column Number", "Parameter", "Unit")

# Creating Columns of the Table
myTable = PrettyTable()
myTable.add_column(heading[0],column_number[:])
myTable.add_column(heading[1],parameters[:])
myTable.add_column(heading[2],units[:])

# Displaying the Table
print(myTable)


# PARAMETER PLOTS
print('\n\nEnter number corresponding to parameter (1 - 17) : ')
x = int(input("Enter X-axis parameter : "))
y = int(input("Enter Y-axis parameter : "))


# Empty Arrays
x_data = []
y_data = []


# Automating Plot Labels
line_number = 1
for line in open(file,'r'):

	# Parameter Labels
	if line_number == 3:
		X_label = parameters[x-1]
		Y_label = parameters[y-1]


		# Parameter & Unit Labels
		if line_number <= 4:
			x_label = parameters[x-1] + '   ' + units[x-1]
			y_label = parameters[y-1] + '   ' + units[y-1]


	# Capturing Data Values of each Parameter
	if '#' not in line:

		x_data.append(float(line.split()[x-1]))
		y_data.append(float(line.split()[y-1]))

	line_number = line_number + 1


# File Name
file_name = Y_label + 'vs' + X_label + '.png'


# Final Plot
plt.figure()
plt.plot(x_data,y_data)
plt.title(Y_label + ' vs ' + X_label,fontweight='bold',style='italic')
plt.xlabel(x_label)
plt.ylabel(y_label)
plt.show()


# PERFORMANCE CALCULATIONS
if x == 8 and y == 2:

	# Engine Speed
	RPM = 1500

	# Work & Power
	Area = np.trapz(y_data,x_data)
	Work = Area * 1000
	Power = 2 * math.pi * RPM * Work / 60

	# Fuel Consumption Parameters
	Fuel_per_stroke = 20 * 1e-06
	Fuel_per_sec = Fuel_per_stroke * RPM * (0.5/60)
	Fuel_per_hour = Fuel_per_sec * 3600

	# Brake Specific Fuel Consumption (BSFC)
	BSFC = Fuel_per_hour/Power


	# Results
	print('\n\nWork done by the engine = ',Work,'kJ')
	print('Power Output of the Engine = ',Power,'kW')
	print('Brake Specific Fuel Consumption (BSFC) = ',BSFC,'g/kWh')
CONCLUSIONS :
The Python program to parse the given engine data file has been successfully written and the respective outputs have been obtained as shown above.
A compatibility check has been carried out such that if the proper file name is not provided, an error message is displayed. Similarly, the column numbers, parameter names along with their units and also the respective numerical values have been extracted from the data file and have been tabulated.
The x and y-labels of the plots have been automated in such a way that for every combination of the input, the plot labels are automatically generated. By providing the column number as an input, we obtain our respective plots.
The respective engine performance parameter calculations have been carried out and the values have been obtained as shown above.