Week 6 - Data analysis
Aim:
To write a script that does the following.
- The script should take column numbers as the input and plot the respective columns as separate images
- Each file should be saved by the name of the column
- The plot labels should be extracted from the file. If, I request for a plot between column 1 (crank angle) and column 8(volume), then the label information should automatically be extracted and must appear as labels in the plots. THIS SHOULD NOT BE DONE MANUALLY
Theory:
What is Data Analysis?
Ans: Data Analysys deals with the field of computational linguistics where it commomnly defines the Natural Language Processing, which concerned with the programming of computers to process and analyse the human written lnguage.
Why do we require Data Analysis?
Ans: Data Analysis is necessary because different application needs the data to be in different forms. File Parsing allow transforming the in a way that canbe understood by a specific software. Data Analysis helps to automate the certain things, and also reduces the human effort besides that it can be used for the application of machine learning automation etc.
- Data visualizer:
The script is to take column numbers as the input and plot the respective columns as separate images. Each file is to be saved by the name of the column. Also, the plot labels is to be extracted from the file. That is, if a request for a plot between column 1 (crank angle) and column 8(volume), then the label information is to be automatically extracted and appear as labels in the plots. -
Compatibility check:
The code is to exit gracefully, if a non-compatible file is provided as an input. It is expected to say something like "File not recognized. Please provide a valid CONVERGE output file". -
Basic performance calculation:
Calculation of the area under the P-V diagram, where P is in column 2 and V is in column 8.
Calculation of the power output of the engine at RPM of 1500.
Calculation of specific fuel consumption, if the engine consumes 20 micro grams of fuel (per 1 stroke cycle).
Problem Statement:
- Analyse the given data file'engine_data.out'
- Visualise the data available in the file.
- Include the complatibility check.
- Do some performance calculation.
Solution Procedure:
- File reading
- Extraction of all data
- Tabulate the column number,value,units
- Take user defined x and y data
- plot for that x and y data
- calculation of specific fuel consumption
Code:
import matplotlib.pyplot as plt
import numpy as np
from scipy.integrate import simps
file_name = input('Enter the CONVERGE file having .out Extension: ')
# Compatibility Check
try:
    f = open(file_name)
    f.close()
except FileNotFoundError:
    print('File Not Recognized')
    exit()
# Data Check
i = 0
for line in open(file_name):
    if '#' not in line:
        break
    i = i+1
j = 0
for line in open(file_name):
    j = j+1
    if j>1:
        break
if j == 1:
    print('No data present')
    exit()
# Data Extraction from the file
i = 0
for line in open(file_name):
    if i == 2:
        c = line.split()
        i = 0
        break
    if i == 1:
        b = line.split()
        i = i+1
    if 'column' in line.split():
        a = line.split()
        i = 1
# Removing columns and '#' from the lists 'a','b' and 'c' and converting the existing data to 64-bit integer format
a.remove("column")
a.remove("#")
a= np.array(a,dtype = np.int64)
b.remove("#")
c.remove("#")
num_col = len(a) # Number of columns (or) Number of Variables
data_counter = 0
# Obtaining the data
data = np.arange(0,num_col)
for line in open(file_name):
    if '#' not in line:
        d = line.split()
        d = np.array(d,dtype = np.float32)
        data = np.vstack([data,d])
        data_counter = data_counter + 1
data = np.delete(data,0,0)
# Visualizing the data
print("Type - ")
for i in a:
    print("{} for {}".format(i,b[i-1]))
print(' ')
x = input("Plot between any 2 variables (y/n): ")
while (x.lower()=='y'):
    cn1 = input("Column number of X variable: ")
    cn2 = input("Column number of Y variable: ")
    cn1 = int(cn1)
    cn2 = int(cn2)
    plt.figure()
    plt.plot(data[:,cn1-1],data[:,cn2-1])
    plt.xlabel('{} {}'.format(b[cn1-1],c[cn1-1]))
    plt.ylabel('{} {}'.format(b[cn2-1],c[cn2-1]))
    plt.title('{} {} vs {} {}'.format(b[cn2-1],c[cn2-1],b[cn1-1],c[cn1-1]))
    z = 'n'
    z = input(" Save the plot (y/n): ")
    if (z.lower() == 'y'):
        plt.savefig("{}-{}.png".format(b[cn2 - 1],b[cn1-1]))
    plt.show()
    print('')
    x = input("Plot between any 2 other variables (y/n): ")
print('')
x = input("Single Variable plot (y/n): ")
while (x.lower()=='y'):
    cn = input("Column number of the variable")
    cn = int(cn)
    plt.figure()
    plt.plot(np.arange(0,data_counter),data[:,cn-1])
    plt.xlabel('Data Point Number')
    plt.ylabel('{} {}'.format(b[cn - 1], c[cn - 1]))
    z = 'n'
    z = input(" Save the plot (y/n): ")
    if (z.lower() == 'y'):
        plt.savefig("{}.png".format(b[cn-1]))
    plt.show()
    print('')
    x = input("Single Variable plot (y/n): ")
print('')
# Engine Calculations
print("Performance of the Engine")
b_1 = [i.lower() for i in b]
pressure_column = b_1.index('pressure')
volume_column = b_1.index('volume')
Pressure = data[:,pressure_column]
Volume = data[:,volume_column]
A = 0 # Area under the PV curve
A = simps(Pressure, Volume, even = 'First')*np.power(10,6) # Work done per cycle
# Power Output
rpm = float(input("RPM: "))
f = float(input("Fuel consumed per cycle (in micrograms): "))
n = rpm/(120)
P = A*n
f = (f*n*3600)/np.power(10,9)
sfc = (f*1000)/P # Specific Fuel Consumption
print("Area under PV curve = {} J".format(A))
print("Power output at {} rpm = {} W".format(rpm,P))
print("Specific fuel Consumption = {} Kg/KW.hr".format(sfc))
Code Explanation:
Compatibility is the input file is checked using the try and except command. The general instructions are provided to make sure the input file name is proper. First the for loop is run in order to extract the Parameters present in the file and their corresponding units. The user is then notified about the available parameters from the file for selection for comparison purposes by displaying the detected parameters with their units. The user is allowed to input the number corresponding to the parameter for both x-axis and y-axis for comparison. The for loop is run again in order to extract the data for the respective 2 chosen parameters only. The lines with no '#' symbols were considered as those were the lines with data. Then the comparison graph is plotted and shown making sure that it shows appropriate information on the parameters used in x and y axis. For extracting this label, again the line.split command is used for the line 3.
The program was developed such a way that if the user choose the Pressure and Volume as variables, then the additional Performance calculations were done. That is, if the user choose the x-axis parameter as "8' and y-axis parameter as "2", then the program automatically calculates the area under the PV diagram, which is actually the work done by the engine. The other calculations include Power output of the engine and Specific fuel consumption.
Outputs of the script:
The program first displays the available parameters in the file and initially ask to choose the parameter that needs to be taken in x-axis for comparison as shown above. 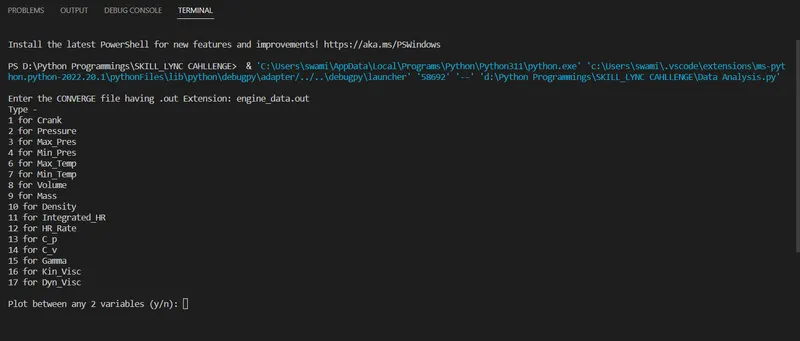
Here, the parameters crank and HR_rate were chosen, and the following figure was obtained.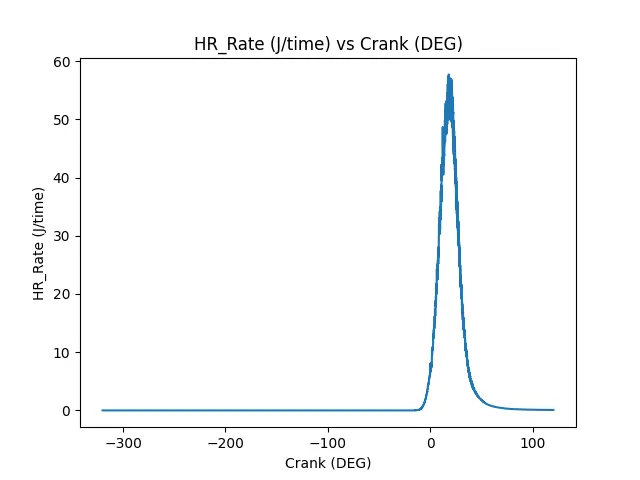
If the parameters volume and pressure were chosen for comparison, additional performance calculations would have been done as shown below with corresponding graph:
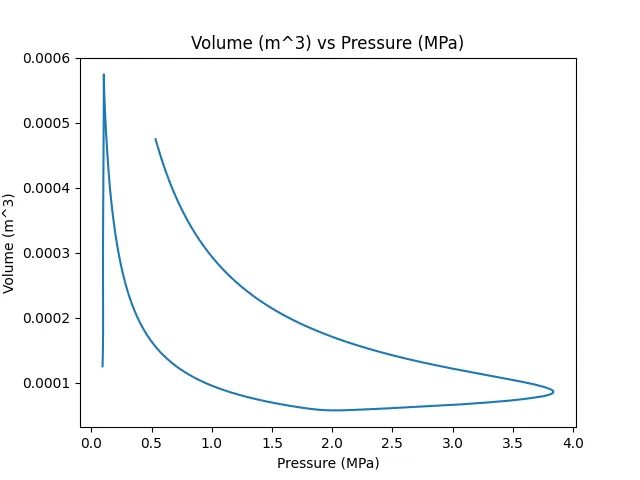
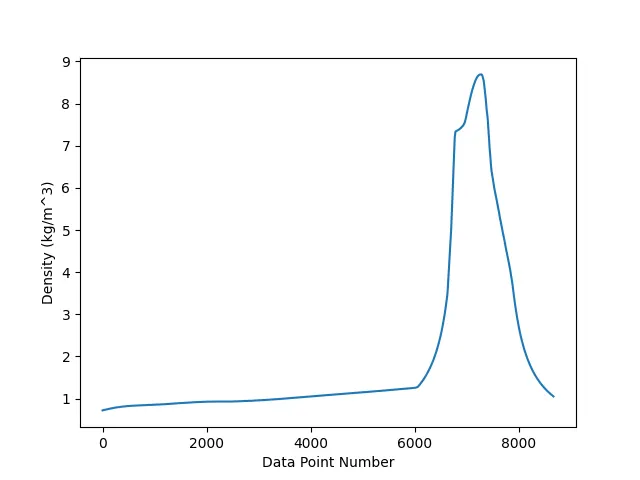
Plot based on single parameter density:
Calculations:
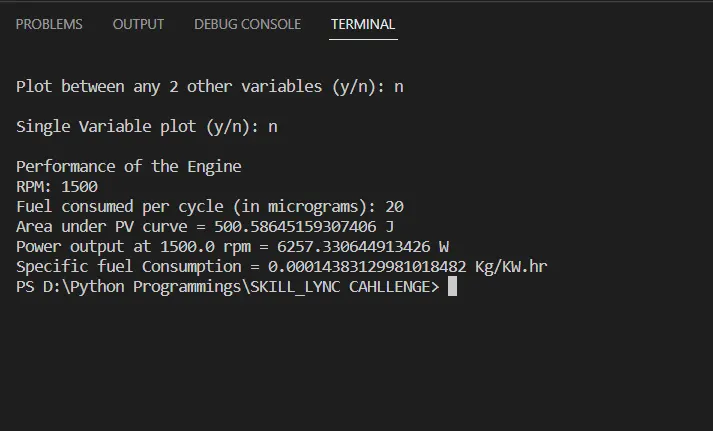
If other parameters too where chosen, then their corresponding figures would have been appeared here.
Conclusion:
The theoretical concepts of engine parameters and file parsing has been understood. A program in PYTHON was created for file parsing. File parsing was done successfully for the Engine Parameter data, and their plots was created for comparison according to the chosen parameters. These plotted images were stored separately according to their parameter names automatically. The Engine performance parameters such as Work done, Power and Specific fuel consumption was calculated.