Project 1 - Parsing NASA thermodynamic data
●Aim:
• To write a function that extracts the 14 co-efficients and calculates the enthalpy, entropy and specific heats for all the species in the data file. You will be reading this file NASA thermodynamic data.
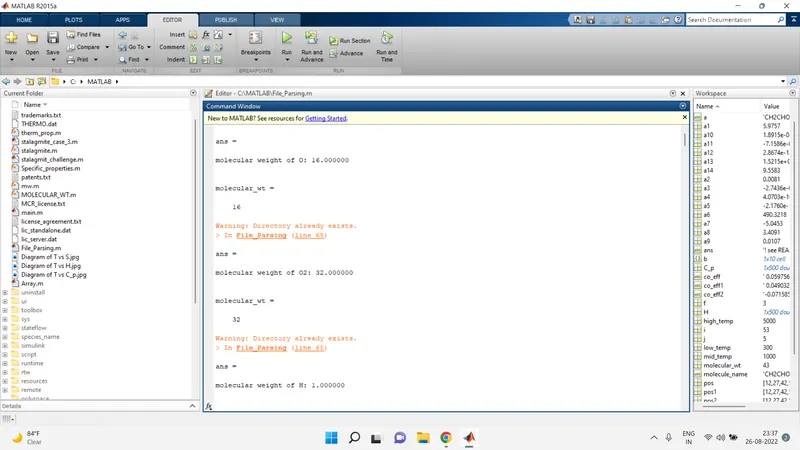
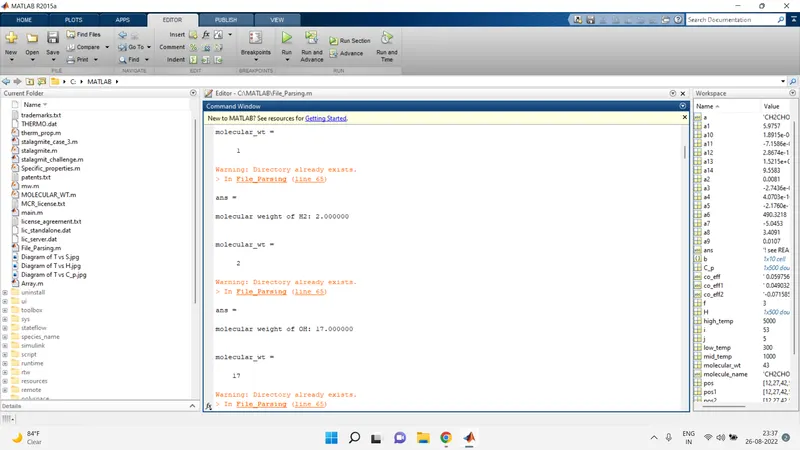
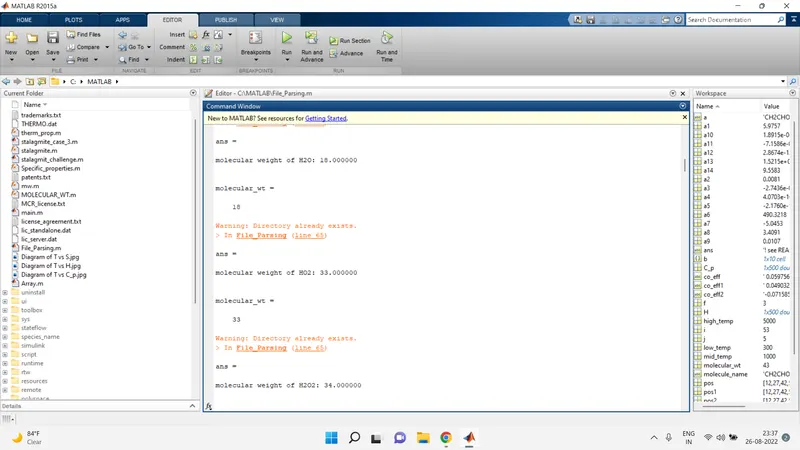
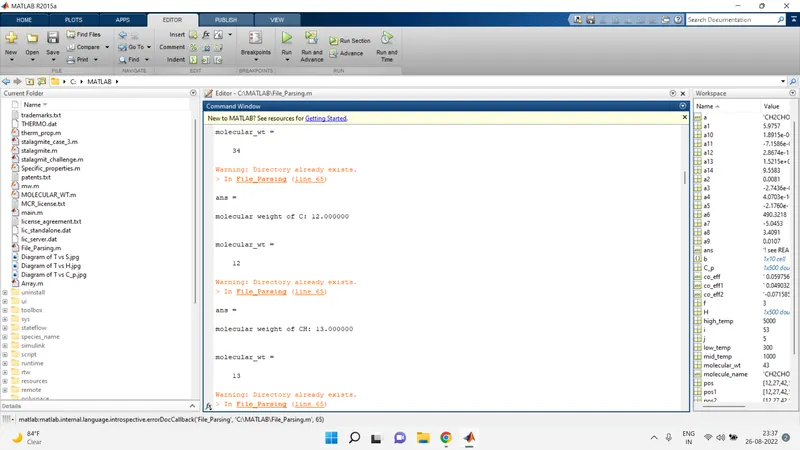
• To calculate the molecular weight of each species and display it in the command window.
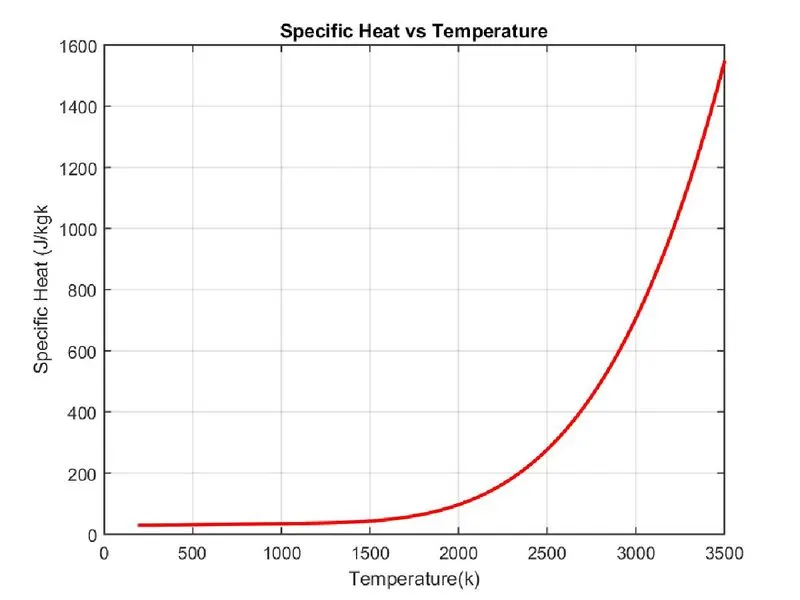
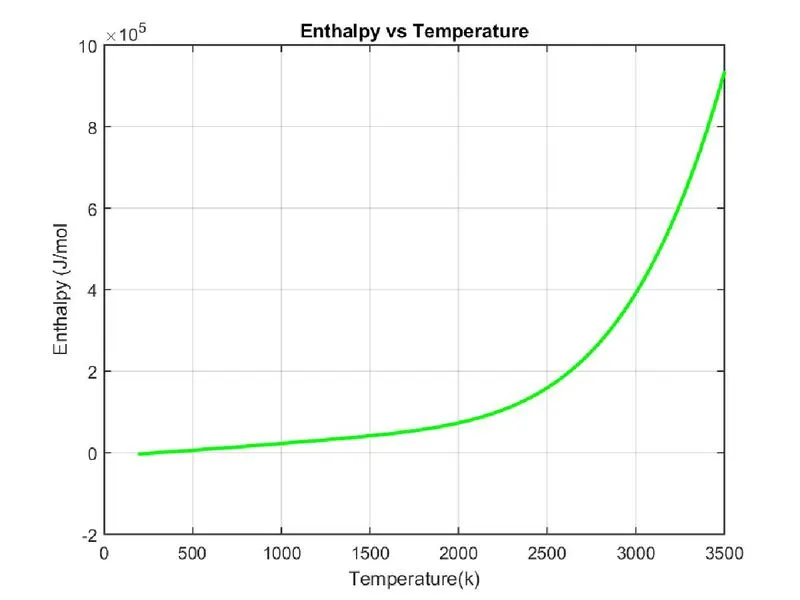
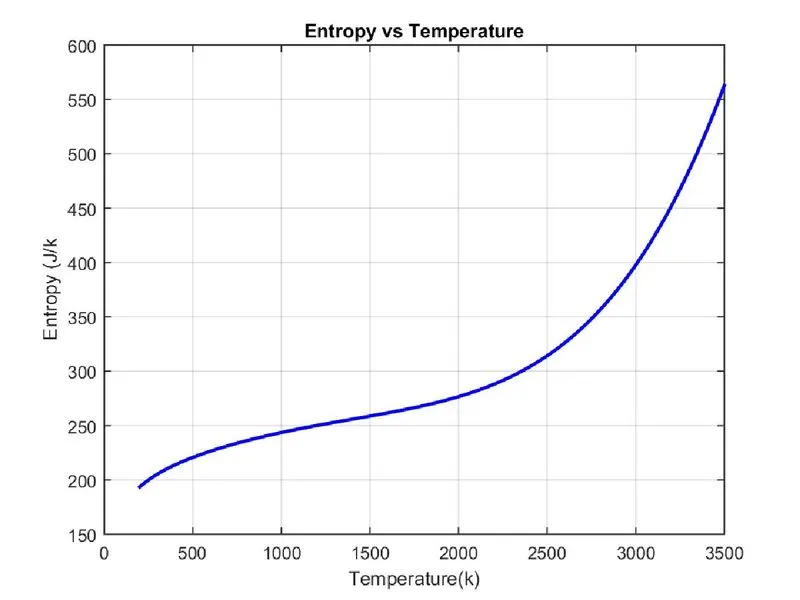
• To plot the Cp, Enthalpy and Entropy for the local temperature range (low temperature : high temperature) specific for each species.
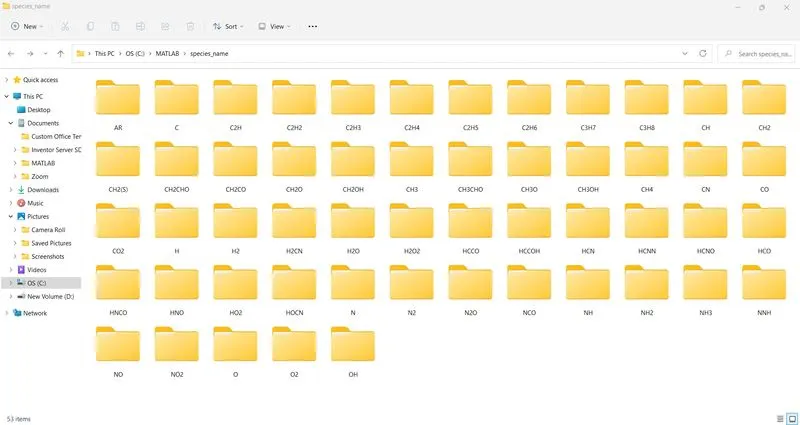
• To save the plots as images with appropriate names and dump them in separate folders for each species with suitable name. All these should be generated automatically.
●Theory:
File Parsing deals with the field of computational linguistics, where it commonly defines the natural language processing. Parser helps to split the large input data in to smaller data and will process the data.
●Why is it necessary?
It is necessary because different application needs the data to be in differen forms. It allows transforming the data in a way theat can be understood by a specific software. the obvious example is programs - they are written by humans, but they must be executed by computers.
●Equation Used:

Where, Cp = specific heat in J/kgK
H = enthalpy of elements in J/mol
S = entropy of elements in J/K
R = universal gas constant in Kj/kgK
Program 1

%fumction for specific heat
function [C_p,H,S] = therm_prop(a1,a2,a3,a4,a5,a6,a7,a8,a9,a10,a11,a12,a13,a14,mid_temp,T)
R = 8.314;
if T> mid_temp
    C_p = R*(a1 + a2*T + a3*T.^2 + a4*T.^3 + a5*T.^4) ;
    H = R*T.*(a1 + a2*T/2 +a3*T.^2/3 + a4*T.^3/4+ a5*T.^4/5 + a6./T);
    S = R*(a1*log(T) + a2*T + a3*T.^2/2 +a4*T.^3/3 + a5*T.^4/4 + a7);
else
     C_p = R*(a8 + a9*T + a10*T.^2 + a11*T.^3 + a12*T.^4) ;
    H = R*T.*(a8 + a9*T/2 +a10*T.^2/3 + a11*T.^3/4+ a12*T.^4/5 + a13./T);
    S = R*(a8*log(T) + a9*T + a10*T.^2/2 +a11*T.^3/3 + a12*T.^4/4 + a14);
end

Program 2

function [molecular_wt] = mw(species_name)
elements = ['H','C','N','O','A'];
atomic_wt = [1,12,14,16,40];
molecular_wt = 0;
for i = 1:length(species_name)
    for j = 1:length(elements)
        if strcmpi(species_name(i),elements(j))
            molecular_wt = molecular_wt + atomic_wt(j);
            position = j;
        end
    end
    f = str2double(species_name(i));
    if f>1
        molecular_wt = molecular_wt + atomic_wt(position)*(f-1);
    end
end
sprintf('molecular weight of %s: %f' ,species_name,molecular_wt)
end

Program 3
% NASA file parsing
clear all
close all
clc

f = fopen('THERMO.dat','r');
%skipping comment lines
for j = 1:5
    fgetl(f);
end

for i =1:53
a = fgetl(f);
b = strsplit(a,' ');
%extraction o0f species
species_name = b{1};

%extraction of local temperature
pos_dot = strfind(a,'.');
low_temp = a(pos_dot(1)-3:pos_dot(1)+3);
low_temp = str2num(low_temp);
high_temp = a(pos_dot(2)-4:pos_dot(2)+3);
high_temp = str2num(high_temp);
mid_temp = a(pos_dot(3)-4:pos_dot(3)+3);
mid_temp = str2num(mid_temp);

%extraction of coefficient

co_eff = fgetl(f);

pos = strfind(co_eff,'E');
a1 = str2double(co_eff(1:(pos(1)+3)));
a2 = str2double(co_eff((pos(1)+4):(pos(2)+3)));
a3 = str2double(co_eff((pos(2)+4):(pos(3)+3)));
a4 = str2double(co_eff((pos(3)+4):(pos(4)+3)));
a5 = str2double(co_eff((pos(4)+4):(pos(5)+3)));

co_eff1 = fgetl(f);
pos1 = strfind(co_eff1,'E');
a6 = str2double(co_eff1(1:(pos(1)+3)));
a7 = str2double(co_eff1((pos(1)+4):(pos(2)+3)));
a8 = str2double(co_eff1((pos(2)+4):(pos(3)+3)));
a9 = str2double(co_eff1((pos(3)+4):(pos(4)+3)));
a10 = str2double(co_eff1((pos(4)+4):(pos(5)+3)));

co_eff2 = fgetl(f);
pos2 = strfind(co_eff2,'E');
a11 = str2double(co_eff2(1:(pos(1)+3)));
a12 = str2double(co_eff2((pos(1)+4):(pos(2)+3)));
a13 = str2double(co_eff2((pos(2)+4):(pos(3)+3)));
a14 = str2double(co_eff2((pos(3)+4):(pos(4)+3)));

%calculation of C_p,H,S

T = linspace(low_temp,high_temp,500);
R = 8.314;

[C_p,H,S] = therm_prop(a1,a2,a3,a4,a5,a6,a7,a8,a9,a10,a11,a12,a13,a14,mid_temp,T);

molecule_name = char(species_name);
[molecular_wt] = mw(species_name)

% Changing the directory and save the plots in that directory
cd('C:\MATLAB\species_name')
mkdir(species_name)
cd(species_name)

%creating the plots
figure(1)
plot(T,C_p,'linewidth',2,'color','r');
xlabel('Temperature(k)');
ylabel('Specific Heat (J/kgk');
title('Specific Heat vs Temperature');
grid on
m1 = 'Specific Heat of %s';
m2 = species_name;
m3 = sprintf(m1,m2)


figure(2)
plot(T,H,'linewidth',2,'color','g');
xlabel('Temperature(K)');
ylabel('Enthalpy (J/mol');
title('Enthalpy vs Temperature');
grid on
m1 = 'Enthalpy of %s';
m2 = species_name;
m3 = sprintf(m1,m2)

figure(3)
plot(T,S,'linewidth',2,'color','b');
xlabel('Temperature(K)');
ylabel('Entropy (J/K');
title('Entropy vs Temperature');
grid on
m1 = 'Entropy of %s';
m2 = species_name;
m3 = sprintf(m1,m2)

% creating file name and save to it
saveas(figure(1),'Diagram of T vs C_p.jpg')
saveas(figure(2),'Diagram of T vs H.jpg')
saveas(figure(3),'Diagram of T vs S.jpg')
cd ..
cd ..
end
● Outputs:
• Screenshot of the window where all the folders are saved:
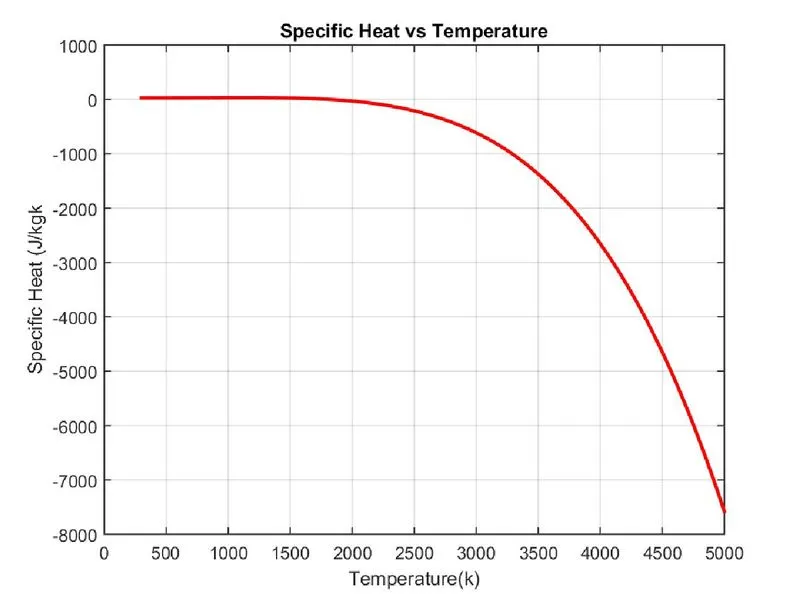
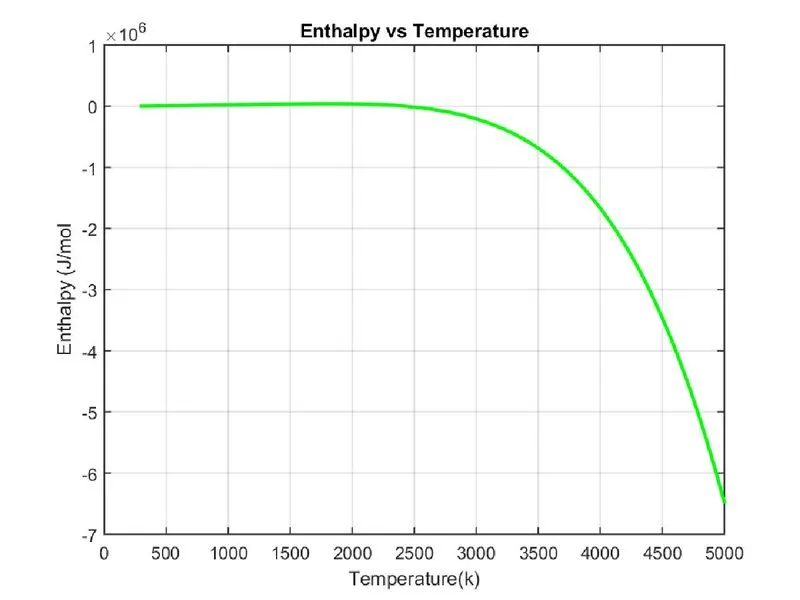
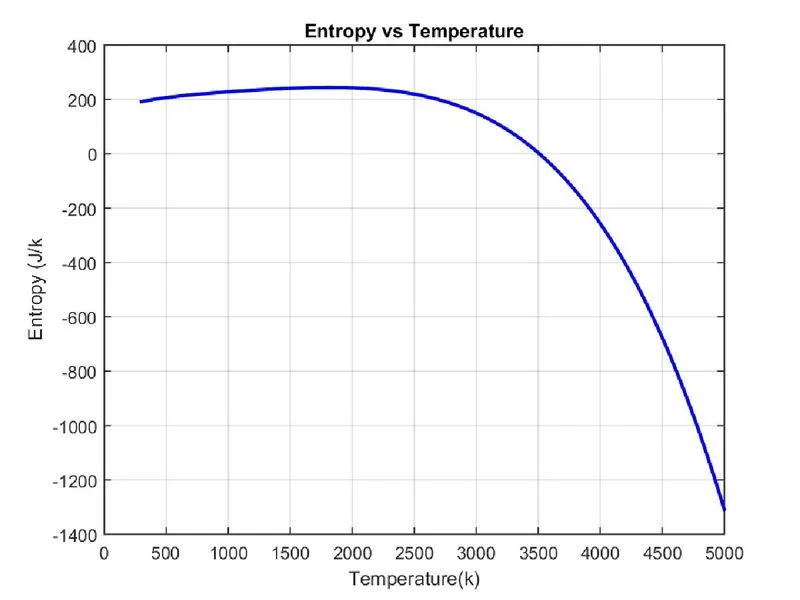
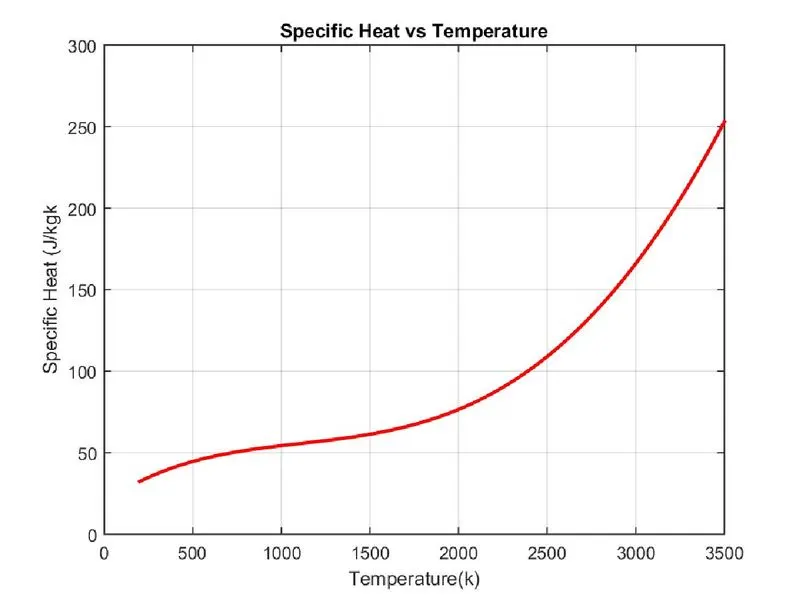
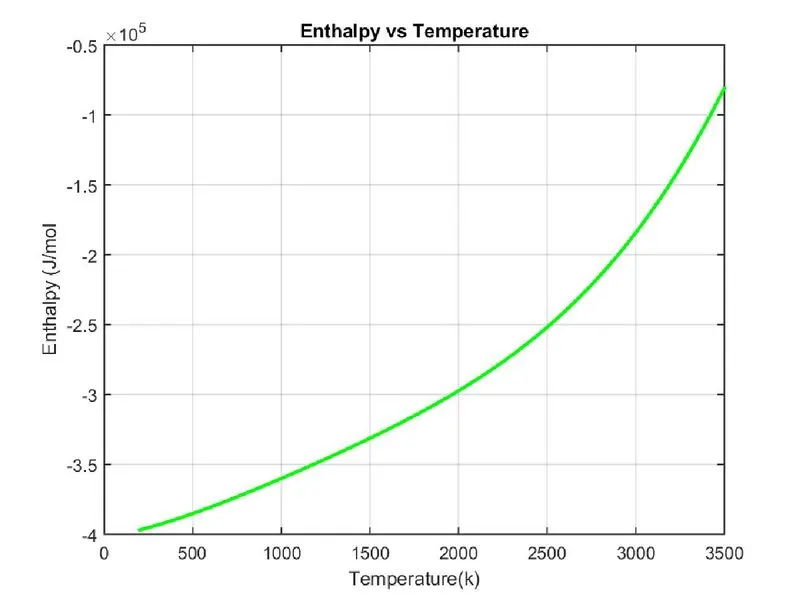
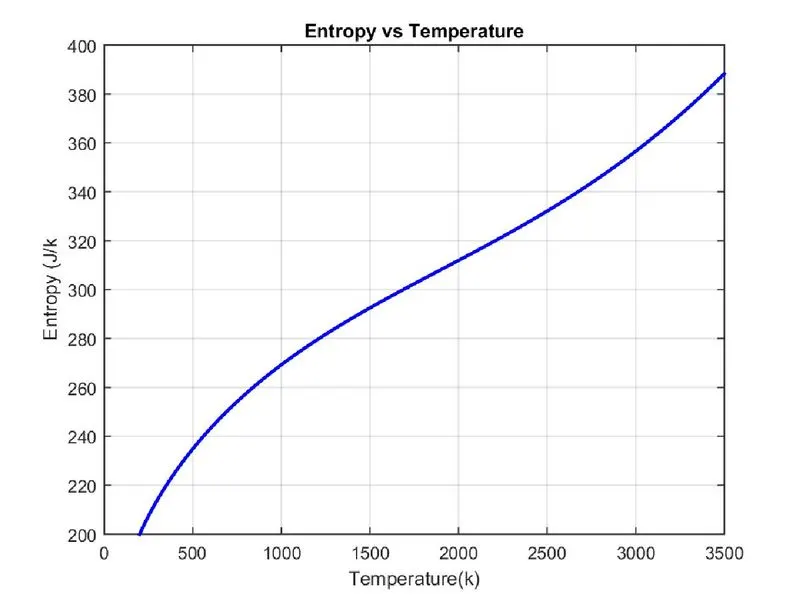
• Plots for o2, N2 and Co2 species :
• Plots of O2:
Plots of N2:
Plot of CO2:
● Some screenshot of calculation of Molecular Weight:
● Program Explaination:(Logic behind the code)
In program1, the function, therm_prop is called in to the main code , to get the calculation of specific heat, entropy and enthalpy. the First 7 coefficients are High-temperature and the Second 7 are low-temperature. Here if - else command is
used to calculate high and low temperature coefficients.
In Program 2, the function deals with the molecular weight calculation of the species. After that the main programe(file_parsin comes. Here, we used the this program to plot the graphs and to perform file parsing. Initially thermo.dat file is opened by fopen command and the letter 'r' is used for reading that file. the data are extracted from the file by the help of the command fgetl. Then the splitstring command is used to split the string of choosen data. In the comment part of '%extraction of local temperature' the command strfind(a,'.') is used to find the posistion of decimal among the local temperature, and by follwing that the position of decimal of other elements has written here. The command str2num is used to convert the string in to number. Then the command co_eff = fgetl(f); is used to call the data of the 14 coefficients. here the command strfind used to get the position of"E" in the data. Then the position of each and evry coefficient is determined. After that, Str2double, this command is used to have the two number after decimal. This process is continued fo 14 coefficients. Next the value of T is described by the linspace of command and the number(500) shows the number of dividson we need to do within that set of value. Now for calculation of Cp,H,S and for teh molecular wt, the function is called. After that the folder is created by the command mkdir whichj indicate to make directory. Then the command cd is used to change the directory. To run this process for all the 53 elements a for loop is used. The command saveas is used to save the data. cd .. this commnad used for change the current folder.