Week 5 - Curve fitting
Aim:
To write code to fit a linear and cubic polynomial for the Cp data. Explain the results are good or bad.
What is Curve Fitting ?
Curve fitting is the process of constructing a curve, or mathematical functions, which possess the closest proximity to the real series of data. By curve fitting, we can mathematically construct the functional relationship between the observed dataset and parameter values, etc. It is highly effective in the mathematical modeling of some natural processes.
Answers of the questions:
1.What does popt and pcov mean?
Ans: popt- An array of optimal values for the parameters which minimizes the sum of squares of residuals.
pcov-2d array which contains the estimated covariance of popt.
2. What does np.array(temperature) do?
Ans: A Numpy module is usually handling the array or list, in order extract the one by one temperature value from temperature array to passing into respective equation like linear or cubic through which corresponding function
3.What does the * in *popt mean?
Ans: reference to popt / the values stored in the array popt.
4.What needs to be done in order to make the curve fit perfect?
Ans: In order to make perfect fit, we must consider error estimates as well. Perfect fit means, the curve should fit the original curve without showing any errors (such as centering and scaling erros) in that perticular degree of polynomial.
5.Show empirically as to how well your curve has been fit.
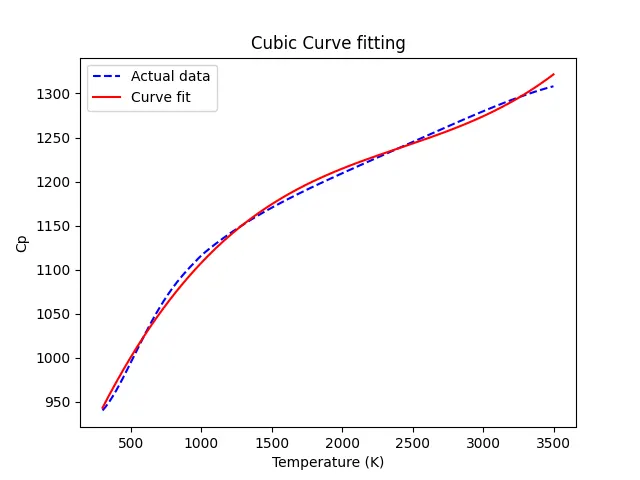
Ans: By observation, a cubic predicted curve has been almost fit into original data curve with some tolerance compared to linear predicted curve. If curve fit overlapped to original data with comes under the defined some tolerances, it is called best fit.
Code:
# importing modules
import math
import numpy as np
import matplotlib.pyplot as plt
from scipy.optimize import curve_fit


# Linear Curve fit function
def function_linear_curve(t, a, b):
    return a * t + b


# Cubic Curve fit function
def function_cubic_curve(t, a, b, c, d):
    return a * pow(t, 3) + b * pow(t, 2) + c * t + d


# Reading thermodynamic data file
def read_file():
    temperature = []
    cp = []
    for line in open('data', 'r'):
        values = line.split(',')
        temperature.append(float(values[0]))
        cp.append(float(values[1]))

    return [temperature, cp]

# read file data by calling function
temperature, cp = read_file()

# calculation of coefficient for linear curve
popt, pcov = curve_fit(function_linear_curve, temperature, cp)
fit_cp_l = function_linear_curve(np.array(temperature), *popt)

# plotting data for linear curve
plt.figure(1)
plt.plot(temperature, cp, 'b--')
plt.plot(temperature, fit_cp_l, color='red')
plt.legend(['Actual data', 'Curve fit'])
plt.xlabel('Temperature (K)')
plt.ylabel('Cp')
plt.title('Linear Curve fitting')
plt.show()

# calculation of coefficient for cubic curve
popt, pcov = curve_fit(function_cubic_curve, temperature, cp)
fit_cp_c = function_cubic_curve(np.array(temperature), *popt)

# plotting data for cubic curve
plt.figure(2)
plt.plot(temperature, cp, 'b--')
plt.plot(temperature, fit_cp_c, color='red')
plt.legend(['Actual data', 'Curve fit'])
plt.xlabel('Temperature (K)')
plt.ylabel('Cp')
plt.title('Cubic Curve fitting')
plt.show()


#Measuring the fitness characetristics of the curves
s = np.sum(cp)
l = np.size(cp)

# Finding mean of Cp data
m = s / l
print('Mean of all cp :', m,'\n')

# For Linear curve fit
linear_sse = 0
linear_ssr = 0
for i in range(l):
    linear_error = abs((np.sum((cp[i] - fit_cp_l[i]))))

    linear_sse = linear_sse + pow(linear_error, 2)
    linear_ssr = linear_ssr + np.sum(pow((fit_cp_l[i] - m), 2))

print('For Linear Curve Fit')
linear_sst = linear_sse + linear_ssr
print('Linear SST :', linear_sst)
linear_R2 = linear_ssr / linear_sst
print('Linear R2 :', linear_R2)
linear_rmse = pow((linear_sse / l), 0.5)
print('Linear RMSE :', linear_rmse ,'\n')

# For Cubic curve fit
cubic_sse = 0
cubic_ssr = 0
for j in range(l):
    cubic_error = abs(np.sum((cp[i] - fit_cp_c[i])))
    cubic_sse = cubic_sse + (pow(cubic_error, 2))
    cubic_ssr = cubic_ssr + np.sum(pow((fit_cp_c[i] - m), 2))

print('For Cubic Curve Fit')
cubic_sst = cubic_sse + cubic_ssr
print('Cubic SST :', cubic_sst)
cubic_R2 = cubic_ssr / cubic_sst
print('Cubic R2 :', cubic_R2)
cubic_rmse = pow((cubic_sse / l), 0.5)
print('Cubic RMSE :', cubic_rmse)
Code Explaination:
Importing the neccessary modules such as numpy, matplotlib, curve fit from scipy optimize and mean from statistics. Matplotlib modules is help us to plotting, numpy module is help to operting the arrays, mean module is help us to average the list and curve fit module is help us to finding the polynomial coefficients and finding the covariance of that polynomial.Defining the functions for both linear equation and cubic equation and also create a function to extracting the temperature & Specific heat value from data file. By using curve fit function to calculate the coefficients of polynomial & Covariance respective to type of polynomial euation. If we want to calculate those of the thing by using temperature, specific heat and respective function either linear or cubic. After that, we calculated the predicted specific heat values in each and every temperatures for both linear and cubic equation.We want to check the fit by uisng some goodness fit criteria like SSE, R Square, Rsquare Adjustable and RSME for both linear and cubic fit. Print it down the order of goodness of fit criteria values and make a plot in separately.
Result and Discussion:
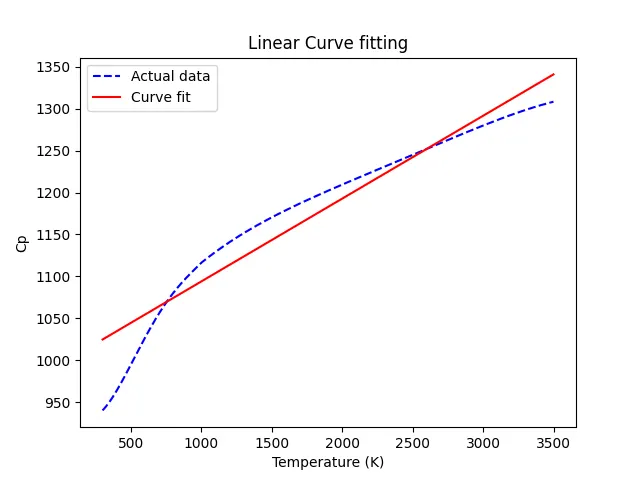
Actual Curve with linear curve :
To plot the both actual data and linear curve on a single image. It clearly shown, a linear fit should not match with each other.
Actual data curve with cubic curve :
To plot the both actual curve and cubic curve on a single image. It clearly shown, a cubic curve and original curve is almost match with eachother compared to linear predicted curve.
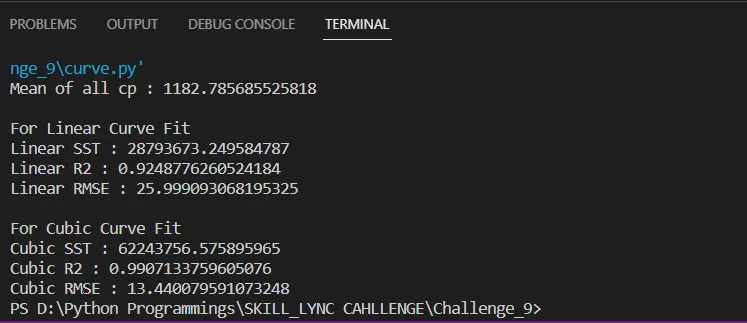
Snapshot of Goodness of Fit Criteria Values:
Conclusion:
A predicted cubic curve is almost overlapped with original data curve compared to linear predicted curve. So, Cubic curve is best curve fit.