Week 3 - Solving second order ODEs
Aim:
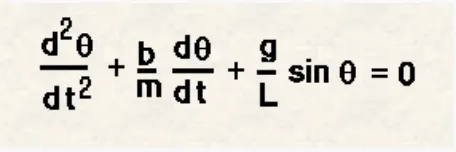
To write a program that solves the following ODE, which governs the motion of a Simple Harmonic Motion(SHM) and make a pendulum equation using python.
Theory:
What is Differential equation?
Ans: A differential equation is the one which involved with the one or more deriavtives including the study of change.
What is Ordinary Differnetial Equation?
Ans: ODE describes one or more function of one independent variable.
What is Partial Differnetial Equation?
Ans: A differential equation containing one or more function of two or more independent variable.
Application of Differential Equation:
- It is used in the study of changes where it helps in analyse the dynamic problem involving flow studies and behavioural studies.
- It helps in Computational simulation of real world problem.
- It is highly applied in fluid dynamics structural analysis and thermal studies.
Code:
import math
import matplotlib.pyplot as plt
import numpy as np
from scipy.integrate import odeint
# defining function
def function(theta,t,b,g,l,m):
    theta1 = theta[0]
    theta2 = theta[1]
    dtheta1_dt = theta2
    dtheta2_dt = -(b/m)*theta2-(g/l*math.sin(theta1))
    dtheta_dt = [dtheta1_dt,dtheta2_dt]
    return dtheta_dt
#Code:
# defining the value of input arguements
b=0.5
g=9.81
l=1
m=1
# inital condition
theta_0 = [0,5]
# creating an array for time
t = np.linspace(0,10,20)
# defining ODE function
theta = odeint(function,theta_0,t,args = (b,g,l,m))
# to create animation
ct = 1
x0 = 0
y0 = 0
for i in theta[:,0]:
    x1 = (x0+(l*math.sin(i)))
    y1 = (y0+(-l*math.cos(i)))
    filename = str(ct)+'.png'
    ct = ct+1

    plt.figure()
    plt.plot([-1,1],[0,0],"black")
    plt.plot([x0,x1],[y0,y1],"red")
    plt.plot(x1,y1,'o',markersize = '20')
    plt.xlim([-1.5,1.5])
    plt.ylim([-1.5,1.0])
    plt.savefig(filename)
Code Explanation:
Initially the required module such as math, matplotlib, and numpy module has been called in the starting of the function. To calclate this ode function one more module have been called that is the sscipy module.At the begining the function hasbeen defined to calculate the value of dtheta1_dt and dtheta2_dt and the value of theta1 and theta2 have been initiated as first and second column of the array theta. Later on the value of input arguements have been assigned. An array for time has been created with the help of numpy module. After that Ode function has been generated, incluiding the tje input arguments.
To create the plot for each and every position of the pendulum we need to calculate the cordinates of the pendulum, That is why a foe loop has been initiate to find the value of x1 and y1. To save each plot on the position of the pendulum plt.figure command hs been used, beside that to save the files in .png format and in respective numbers str(ct)+'.png' command is used. After that the plot has been generated.
Result And Discussion:
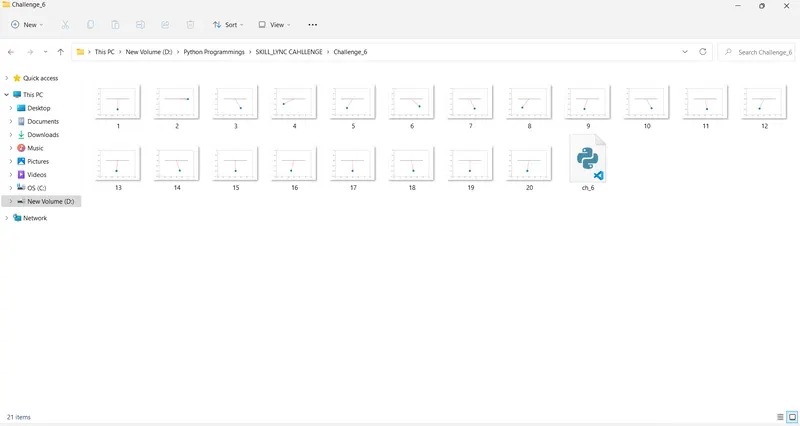
- The plot have been created for each annd every angular displacement.
Youtube link for the Animation video:
Screenshot of the folder where all plots are saved: