Week 6 - Data analysis
AIM
To write a script that does data analysis on python
OBJECTIVES
- Visualising the data to plot graph between any two quantities according to user input
- Compatibility check code should exit gracfully if a non compatible file is provided as an input
- To calculate basic engine performance calculations
INTRODUCTION
Data analysis is a process of inspecting , cleansing , transforming and modelling data with the goal of discovering useful information , informing conclusion and supporting decision - making .Data analysis has in multiple facts and approaches , encompassing diverse techniques under a variety of names and is used in different bussiness , science and social science domains .In today bussiness world data analysis plays a role in making decision more scientific and helping bussiness operate more effectively
Data analysis is a somewhat abstarct concept to understand without the help of examples.So that the better illustrate how and why data analysis is important for bussiness here are the 4 types of data analysis and examples each
- Descriptive Analysis Descriptive data analysis looks at past and tells what happened.This is often used when tracking key performance indicators , revenue , sales leads and more
- Diagnostic Analysis Diagnostic data analysis aims to determine why something happened .Once your descriptive analysis shows that something negative or positive happened diagnostic analysis can be done to figure out the reason .A bussiness may see that leads increased in the month october and use diagnostic analysis to determine which marketing efforts contributed the most
- Predictive Analysis Predictive data analysis predicts what is likely to happen in future .In this type of research trends are dervied from past data which are then used to form predictions about the future .For example to predict next year revenue data from previous years will be analyzed.
- Prescriptive Analysis Prescriptive data analysis combines the information found from the previous 3 types of data analysis and forms a planof action of the organization to face the issue or decision .This is where the data driven choices are made
These 4 types of data analysis can be applied to any issue with data related to it. With the internet data can be found about pretty much everything
GOVERNING EQUATION
Since the data file given consists of various parameters for an engine .Several calculations can be made from it .But for our interest the following parameters are to be calculated
- Work done by the engine (w_(out)) This can be found by plotting p-v diagram of the engine and calculating area under the curve
- Power = (w_(out)*rpm*n)/(60*1000*2) in kw here n is the number of cylinders of the engine .Rpm is the engine speed in minutes its to be converted into seconds by dividing by 60 2 in denominator term is present beacuse the given engine is a 4 stroke engine
- Specific fuel consumption(SPC) (FC)/(Power ) where FC is the amount of fuel consumed by the engine (kg)/(hr)
INPUTS RPM = 1500 Fuel consumed per stroke = 20 micro grams
PRODECURE
- At first important modules such as math, matplotlib, numpy, scipy are imported for their various functions
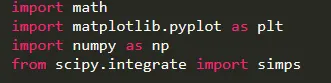
- For checking compatibility of the program try and except command is used according to thier syntax and the given data file is opened using open command within a loop .If the file name is misspelled or is wrong the code will yield error with following message file not recognized .Please provide a valid converge output file and will not execute and exit
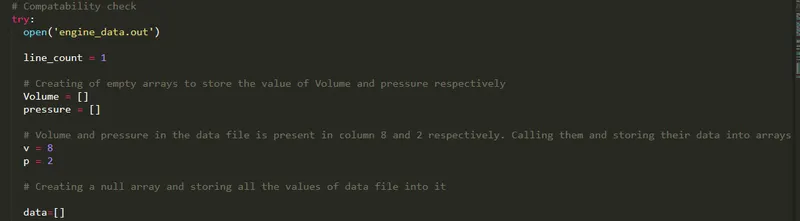

- For the purpose of plotting curve between two quantities according to user input first a line counter is intiated from 1 and null arrays of volume and pressure and data is created for the further uses. Now an if loop is iterated with condition that if not in line all the numerical values present in the data file is now to be stored in the data array as string by default
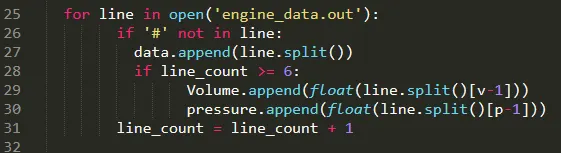
- Now another if loop is executed within with the condition that if line counter is greater than or equal to 6 all the data will be stored in pressure and volume array respectively
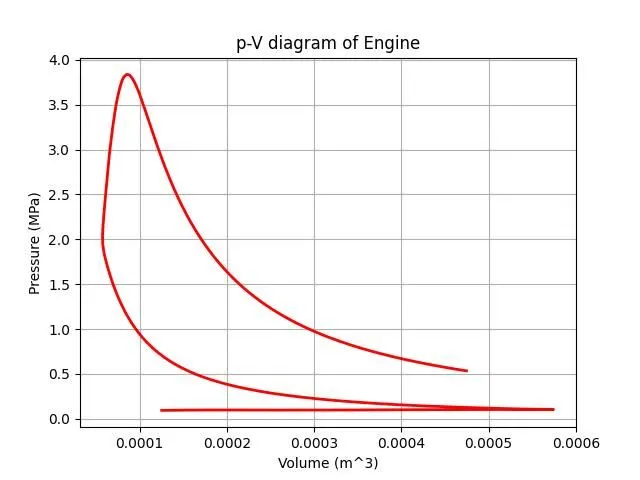
- For plotting p-v diagram the above pressure and volume array are plotted accordingly
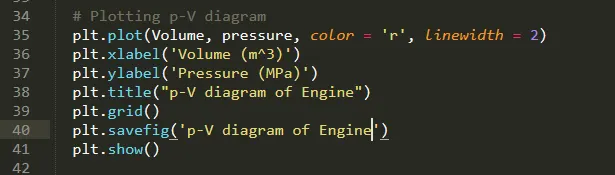
- For engine performance calculations first area under pv curve is to be calculated and this can be done by either trapezoid method or simpson method .Here it has been calculated by both methods by entering required inputs and the necessary formulas
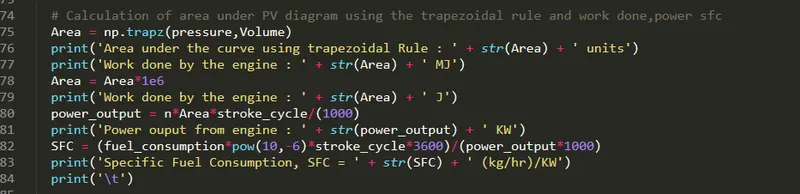
- The array of data obtained earlier consists of column matrixof strings of each quantities present inside it so that column matrix is transposed into several row matrices according to various quantites using np.transpose command and is further converted into float data types using as type command

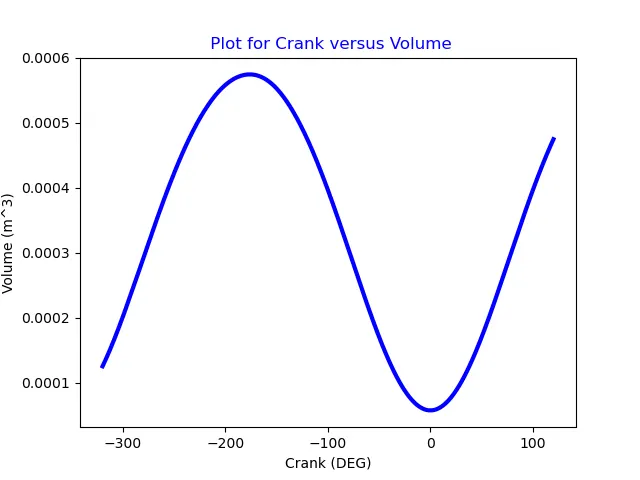
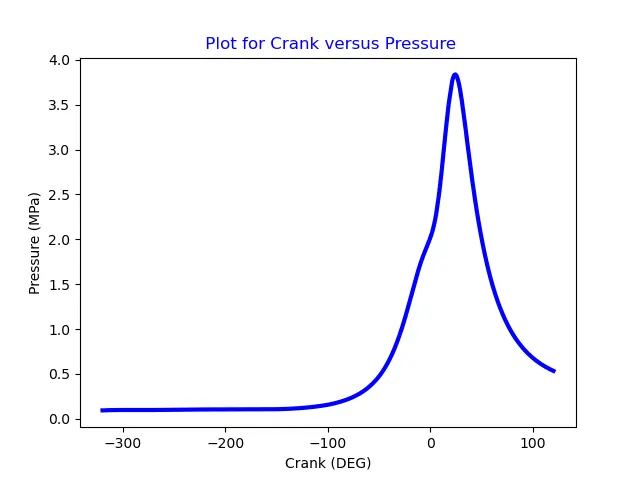
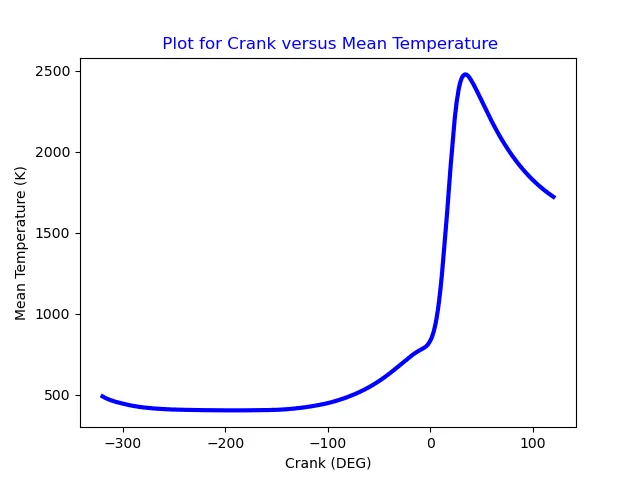
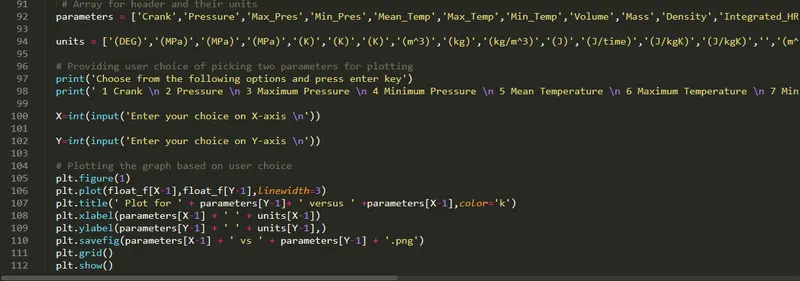
- Two arrays of name of the parameters and thier units are made according to data file given and then user has to choose from them to plot respective graphs .For thsi the two inputs of user is taken using input command in python 3 and its datatype is set as int and plotted using plt.plot command .Basically user is entering column number as input and accordingly result is generated
# A program to calculate engine parameters and to plot graph between two quantites according to user input
import math
import matplotlib.pyplot as plt
import numpy as np
from scipy.integrate import simps

# Compatability check
try:
  open('engine_data.out')

  line_count = 1

  # Creating of empty arrays to store the value of Volume and pressure respectively
  Volume = []
  pressure = []

  # Volume and pressure in the data file is present in column 8 and 2 respectively. Calling them and storing their data into arrays
  v = 8
  p = 2

  # Creating a null array and storing all the values of data file into it

  data=[]

  for line in open('engine_data.out'):
        if '#' not in line:
          data.append(line.split())
          if line_count >= 6:
                Volume.append(float(line.split()[v-1]))
                pressure.append(float(line.split()[p-1]))
        line_count = line_count + 1


  # Plotting p-V diagram
  plt.plot(Volume, pressure, color = 'r', linewidth = 2)
  plt.xlabel('Volume (m^3)')
  plt.ylabel('Pressure (MPa)')
  plt.title("p-V diagram of Engine")
  plt.grid()
  plt.savefig('p-V diagram of Engine')
  plt.show()


  # Calculation of area under PV diagram using the simpsons rule

  area = simps(pressure, Volume)
  print('Area under the curve using Simpsons Rule : ' + str(area) + ' units')
  print('Work done by the engine : ' + str(area) + ' MJ')
  area = area*1e6
  print('Work done by the engine : ' + str(area) + ' J')

  #Inputs
  #Speed of an engine (RPM)
  rpm = 1500
  rps = 1500/60
  stroke_cycle = rps/2

  #Fuel consumption in micro grams per 1 stroke cycle
  fuel_consumption = 20

  #Engine Specifications
  #Number of cylinder=
  n = 1
  # 4 stroke engine

  # Calcualtions of Power output and specific fuel consumption

  power_output = n*area*stroke_cycle/(1000)
  print('Power ouput from engine : ' + str(power_output) + ' KW')
  SFC = (fuel_consumption*pow(10,-6)*stroke_cycle*3600)/(power_output*1000)
  print('Specific Fuel Consumption, SFC = ' + str(SFC) + ' (kg/hr)/KW')
  print('\t')

  # Calculation of area under PV diagram using the trapezoidal rule and work done,power sfc
  Area = np.trapz(pressure,Volume)
  print('Area under the curve using trapezoidal Rule : ' + str(Area) + ' units')
  print('Work done by the engine : ' + str(Area) + ' MJ')
  Area = Area*1e6
  print('Work done by the engine : ' + str(Area) + ' J')
  power_output = n*Area*stroke_cycle/(1000)
  print('Power ouput from engine : ' + str(power_output) + ' KW')
  SFC = (fuel_consumption*pow(10,-6)*stroke_cycle*3600)/(power_output*1000)
  print('Specific Fuel Consumption, SFC = ' + str(SFC) + ' (kg/hr)/KW')
  print('\t')


  # Tansposing columns into row matrix and converting them into float type from string type
  transpose=np.transpose(data)
  float_f=transpose.astype(np.float)

   # Array for header and their units
  parameters = ['Crank','Pressure','Maximum Pressure','Minimum Pressure','Mean Temperature','Maximum Temperature','Minimum Temperature','Volume','Mass','Density','Integrated HR','HR Rate','Cp','Cv','Gamma','Kinematic Viscosity','Dynamic Viscosity']

  units = ['(DEG)','(MPa)','(MPa)','(MPa)','(K)','(K)','(K)','(m^3)','(kg)','(kg/m^3)','(J)','(J/time)','(J/kgK)','(J/kgK)','','(m^2/s)','(Ns/m^2)']

  # Providing user choice of picking two parameters for plotting
  print('Choose from the following options and press enter key')
  print(' 1 Crank \n 2 Pressure \n 3 Maximum Pressure \n 4 Minimum Pressure \n 5 Mean Temperature \n 6 Maximum Temperature \n 7 Minimum Temperature \n 8 Volume \n 9 Mass \n 10 Density \n 11 Integrated HR \n 12 HR Rate \n 13 Cp \n 14 Cv \n 15 gamma \n 16 Kinematic Viscosity \n 17 Dynamic Viscosity')

  X=int(input('Enter your choice on X-axis \n'))

  Y=int(input('Enter your choice on Y-axis \n'))

  # Plotting the graph based on user choice
  plt.figure(1)
  plt.plot(float_f[X-1],float_f[Y-1],linewidth=3,color='blue')
  plt.title(' Plot for ' + parameters[X-1]+ ' versus ' +parameters[Y-1],color='blue')
  plt.xlabel(parameters[X-1] + ' ' + units[X-1])
  plt.ylabel(parameters[Y-1] + ' ' + units[Y-1],)
  plt.savefig(parameters[X-1] + ' vs ' + parameters[Y-1] + '.png')
  plt.grid()
  plt.show()

except:
  print('File not recognized. Please provide a valid CONVERGE output file')
RESULTS
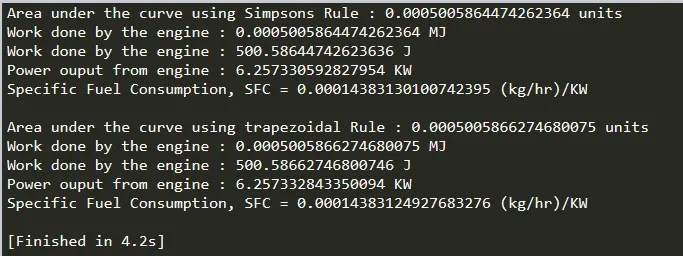
Upon executing the following program first a p-v diagram plot appears and according to the required calculation are made as
This was made possible only if correct data file is opened .If there were different files to be opened the following message is displayed in the command window