Week 6 - Data analysis
Aim: To write a code that reads the Engine Output parameter file and perform the following objectives.
Objective:
- To read the data from a given data file.
- To take the file name as input from the user and check whether the file is present or not.
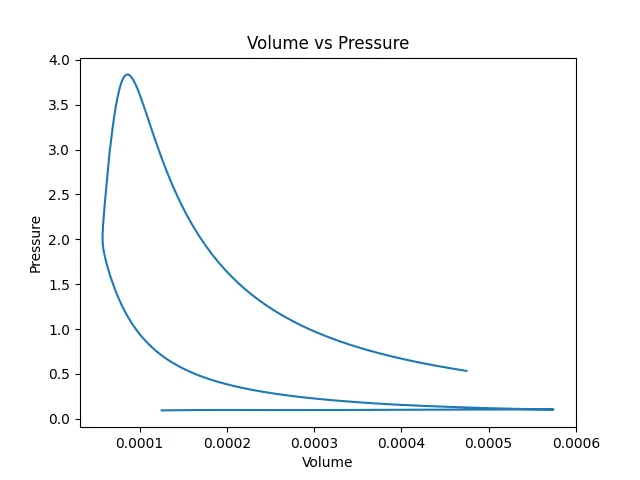
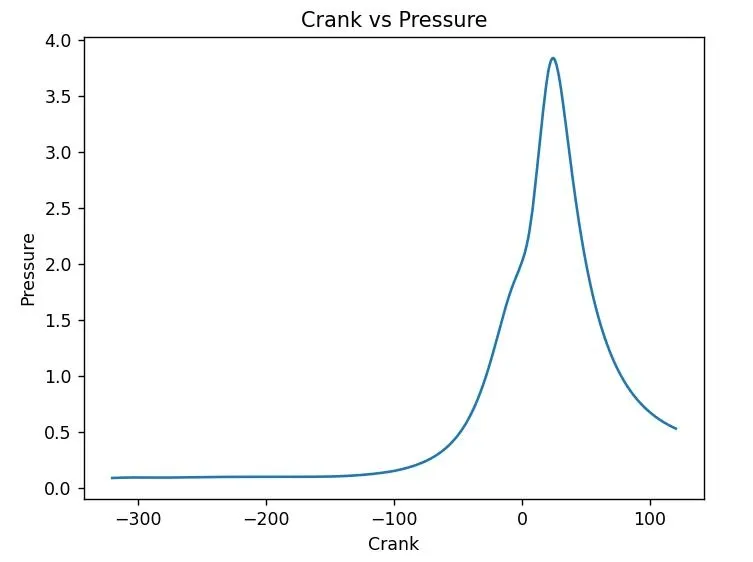
- To plot a graph between 2 parameters given by the user as input.
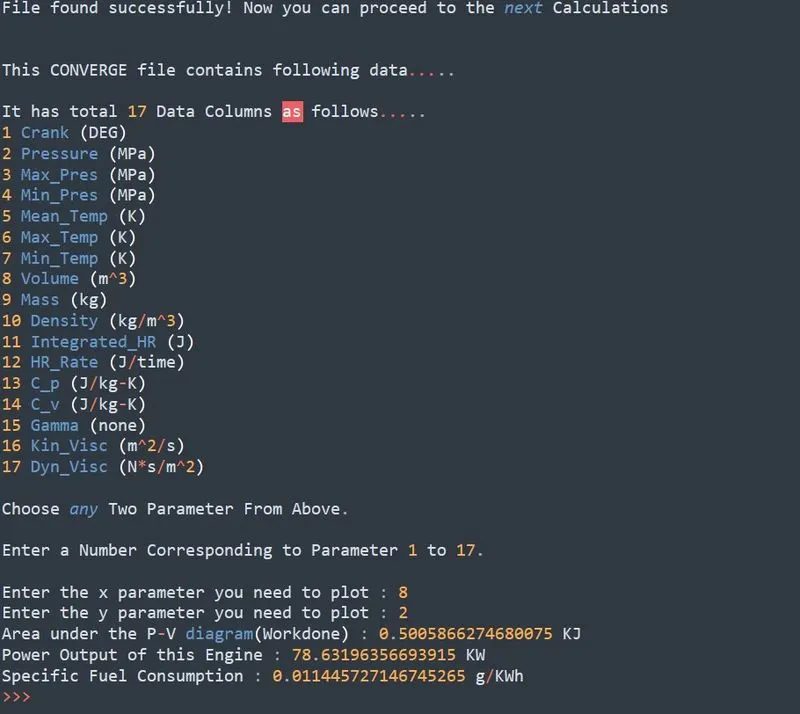
- To do basic performance calculations by calculating the area under the P-V diagram, the power output of this engine, and specific fuel consumption.
Code:
# Demonstrating the engine data analysis


#Importing the modules
import matplotlib.pyplot as plt
import math
import numpy as np


# Compatability Check
try:
	file = open('engine_data.out')
	print('File found successfully! Now you can proceed to the next Calculations\n')

except:
	print('File not recognized. Please provide a valid CONVERGE output file or filename\n')


line_count = 1
for line in file:
	if line_count==3:
		Parameter = line.split()
		Columns = len(Parameter)
		print('\nThis CONVERGE file contains following data.....')
		print('\nIt has total %d Data Columns as follows.....' %(Columns-1))

		for Line in file:
			if line_count ==4:
				Unit =Line.split()
			break

		for C_no in range(1,Columns):
			print(C_no,line.split()[C_no],Line.split()[C_no])
		break
	line_count = line_count + 1

print('\nChoose any Two Parameter From Above.\n')
print('Enter a Number Corresponding to Parameter 1 to 17.\n')

# taking inputs from users
x = int(input('Enter the x parameter you need to plot : '))
y = int(input('Enter the y parameter you need to plot : '))

x_data = []
y_data = []

line_count = 1
for line in open('engine_data.out', 'r'):

	if line_count == 3:
		X_label = line.split()[x]
		Y_label = line.split()[y]
	break

	if '#' not in line:
		x_data.append(float(line.split()[x-1]))
		y_data.append(float(line.split()[y-1]))

	line_count = line_count + 1

	filename = Pressure + ' vs ' + Volume + '.png'

plt.figure()
plt.plot(x_data,y_data)
plt.xlabel(Pressure)
plt.ylabel(Volume)
plt.title(Pressure+ ' vs ' + Volume)
plt.savefig(filename)
plt.show()

if x==8 and y==2:
	RPM =1500
	Area = np.trapz(y_data,x_data)                         #In MJ
	Workdone = Area*1000                                   #In KJ
	Power = 2*math.pi*RPM*Workdone/60                      #In KW
	Fuel_per_Stroke = 20*1e-6                              #In grams per stroke
	Fuel_per_Sec = Fuel_per_Stroke*RPM*(0.5/60)            #In grams per second
	Fuel_per_Hour = Fuel_per_Sec*3600                      #In grams per hour
	BSFC = Fuel_per_Hour/Power                             #In g/KWh

	print('Area under the P-V diagram(Workdone) :',Workdone,'KJ')
	print('Power Output of this Engine :',Power,'KW')
	print('Specific Fuel Consumption :',BSFC,'g/KWh')
Code Explanation :
- Importing useful modules from different libraries.
- The “try and except” command is used to check if the data file is in the same folder or if it has a name mistake.
- Then we are going to open the file using the “for loop” command and then we read the data line by line. And using some counting line, if and else commands to separate the heading and numerical data.
- Using “line.split” command to split all the data present in the data file.
- Getting input from the user. Here, the X-axis parameter is an independent variable and the Y-axis parameter is a dependent variable. This terminology is used for data visualization.
- Then we create two empty arrays for the x input and the y input and then we read the data again. The data is created than using the float, the values float, and append all the values for the x and y input arrays.
- We create the plot command for the x and y input arrays and then we make all the labels and the title of the graph by splitting a different parameter and then assigning it into X_label & Y_label w.r.t. given input. (For the title of the Plot). Then splitting different parameters plus their respective units. And, putting them into x_label & y_label w.r.t. given input.
- If '#' is not in a line then extract all that data in float form & appending it into x_data & y_data w.r.t. given input.
- Assigning a title, xlabel, ylabel & filename to a plot w.r.t. given input. And, saving it in a predefined directory.
- The above steps run in a while loop until the user gives an input ‘n’ to the question “Do you want a plot between any two variables
- After that, we calculate the area under the curve of a PV diagram and we know that the area under the curve is work done.
- Then we calculate the power output of the engine and Specific Fuel Consumption and then we print the values.
Results:
Plots:
1) Volume vs Pressure Plot
2) Crank vs Pressure Plot
Conclusion:
- The area under the PV Diagram curve is calculated. We know that the area under the PV diagram is work done.
- The specific Fuel Consumption(SFC) and power output of the engine were also calculated.
- The data visualization is shown in the output window.