Week 6 - Data analysis
AIM :
Data visualizer
- Your script should take column numbers as the input and plot the respective columns as separate images
- Each file should be saved by the name of the column
- The plot labels should be extracted from the file. If, I request for a plot between column 1 (crank angle) and column 8(volume), then the label information should automatically be extracted and must appear as labels in the plots. THIS SHOULD NOT BE DONE MANUALLY
Compatability check
- You code should exit gracefully, if a non-compatible file is provided as an input. It should say something like "File not recognized. Please provide a valid CONVERGE output file"
Basic performance calculation
- Calculate the area under the P-V diagram. P is in column 2 and V is in column 8.
- Calculate the power output of this engine. Assume that RPM is 1500
- This engine consumed 20 micro grams of fuel (per 1 stroke cycle). Calculate its specific fuel consumption.
CONVERGE DATA FILE:
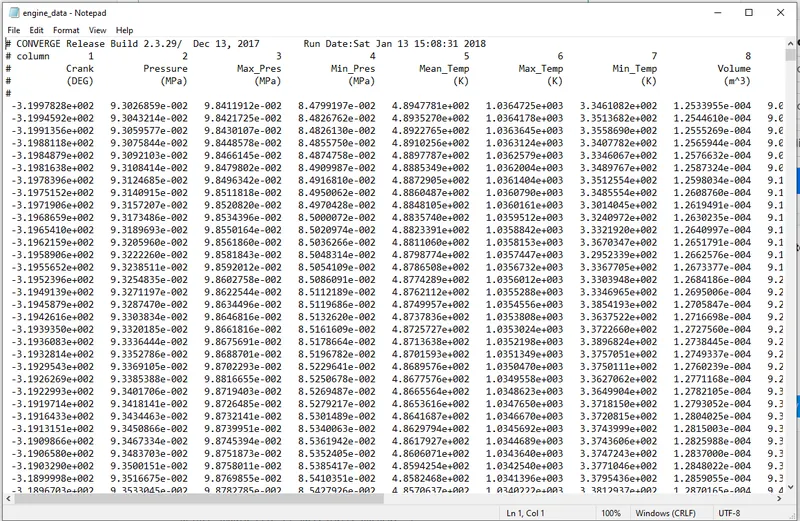
CODE:
#Python code for data analysis

import matplotlib.pyplot as plt
import math
import numpy as np
from numpy import trapz

print('General Instruction')
print('Please make sure that the CONVERGE data file is saved in the same directory where Python code is saved.')

file_name=input('Enter the CONVERGE file having .out extension : ')

#Compatability check
try :
    data = open(file_name,'r')
    print('\nData file is succesfully opened.')


except FileNotFoundError:
    print('\nPlease Enter a valid filename.\n')


line_count=1
for line in data:


    if line_count==3:
        Parameter=line.split()
        Columns=len(Parameter)
        print('\nThis CONVERGE file contains following data which is derived from I.C. Engine Simulation :')
        print('It has total %d Data Columns' %(Columns-1))


        for Line in data:
            if line_count==4:
                Unit=Line.split()
            break

        for C_no in range(1,Columns):
            print(C_no,line.split()[C_no],Line.split()[C_no])
        break
    line_count=line_count+1


print('\nChoose any Two Parameter From Above.')
print('Enter a number corresponding to parameter 1 to 17.\n')
x=int(input("Enter X-axis Parameter : "))

y=int(input("Enter Y-axis Parameter : "))


x_data=[]
y_data=[]


line_count=1
for line in open(file_name,'r'):
    if line_count==3:
        X_label = line.split()[x]
        Y_label = line.split()[y]
        if line_count<=4:
            x_label=line.split()[x]+Line.split()[x]
            y_label=line.split()[y]+Line.split()[y]


    if '#' not in line:
        x_data.append(float(line.split()[x-1]))
        y_data.append(float(line.split()[y-1]))

    line_count=line_count+1


filename=Y_label+'vs'+X_label+'.png'

plt.figure()
plt.plot(x_data,y_data)
plt.xlabel(x_label)
plt.ylabel(y_label)
plt.title(Y_label+' vs '+X_label)
plt.savefig(filename)
plt.show()

#performance calculation
if x==8 and y==2:
    RPM=1500
    Area=np.trapz(y_data,x_data)
    Workdone=Area*1000
    Power=2*math.pi*RPM*Workdone/60
    Fuel_per_Stroke=20*1e-6
    Fuel_per_Sec=Fuel_per_Stroke*RPM*(0.5/60)
    Fuel_per_Hour=Fuel_per_Sec*3600
    BSFC=Fuel_per_Hour/Power

    print('Area under the P-V diagram(Workdone) :',Workdone,'kJ')
    print('Power Output of this Engine :',Power,'kW')
    print('Specific Fuel Consumption :',BSFC,'g/kWh')
Code explanation:
- Importing useful modules from different libraries
- Printing general instructions and asking the user for input in the form of converge with .out extension
- In compatability check, if converge file exists then it prints 'data file is succesfully opened'.
- If the input given by user is non compatabile or entered incorrect file name without .out extension then it would print 'Please enter a valid file name' and stops doing further calculations.
- Here line_count is used for counting a lines in converge data file.
- Using split command when code runs through 3rd line to get parameter names
- Split command is used with () to identify where to split, it basically splits when there is a blank space.
- We print out that the following file has say x number of columns
- Once the code goes through 4th line we have units, so we want to extract the units, again using the split command with () option to split the data when eevr the code encounter blank space and this is saved as units.
- Then we ask the user to choose any 2 parameters out of the columns numbers, both x and y inputst are to be given individually.
- Defining an empty arrat x_data, y_data.
- In third line, splitting different parameters and then assigning into x_label and y_label wrt given input.
- Then splitting a different parameters plus their respective units and putting them into x_label,y_label wrt given input.
- If # is not in a line then extracting all the data in float form and appending into x_data,y_data wrt given input.
- Assigning x_label,y_label,title and saving the figure wiht a suitable name.
- When the x input is 8 and y input is 2 then code runs further to calculate the area under the P-V diagram using trapz from numpy and defining workdone in KJ, Power in KW, specific fuel consumption in g/KWh by using respective formulas.
- Sub;ime window is not meant for command prompt, it is meant for output. So we install SublimeREPL package to interact with the outputs and to give inputs as defined by user.
COMPATABILITY CHECK
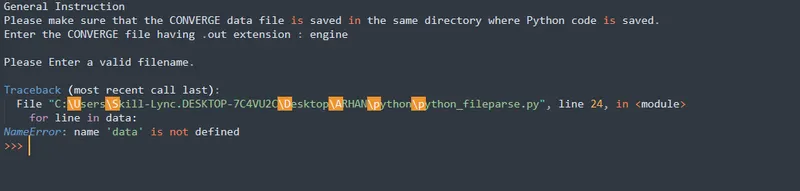
- It can be noted that if file name is entered incorrect then the python code exits and doesnt perform any calculations. Hence we can say that this code is potentially good enough for performing data analysis.
RESULTS:
- Result for calculating area under pv diagram, power outpur and SFC
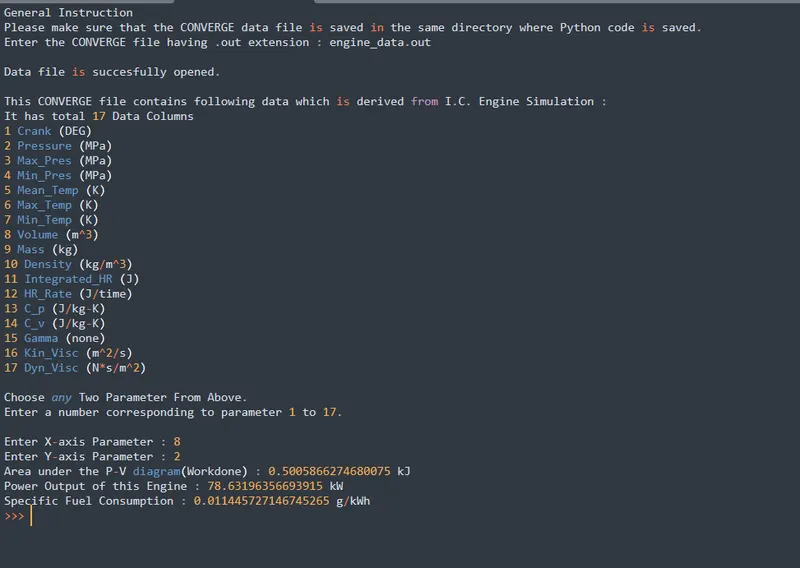
- Plot for Pressure vs Volume
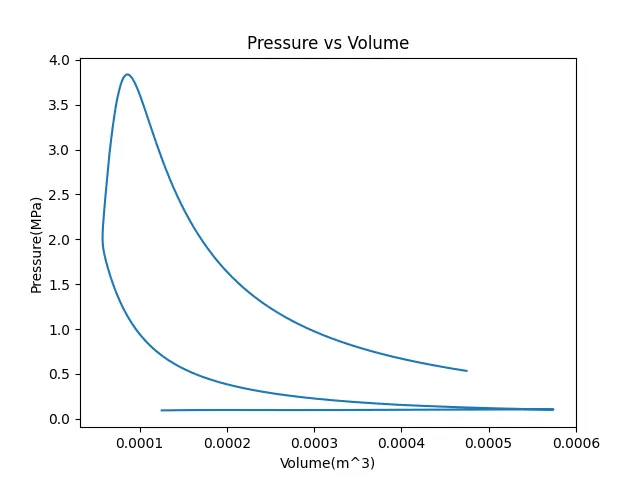
- Plot for pressure vs crank
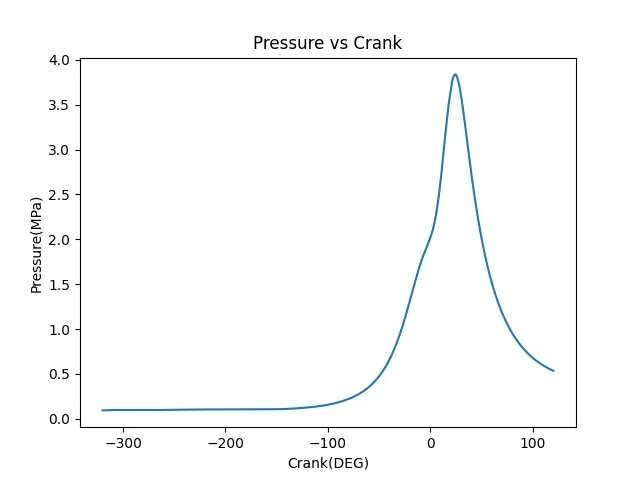
- Plot for variation of cv with mean temperature
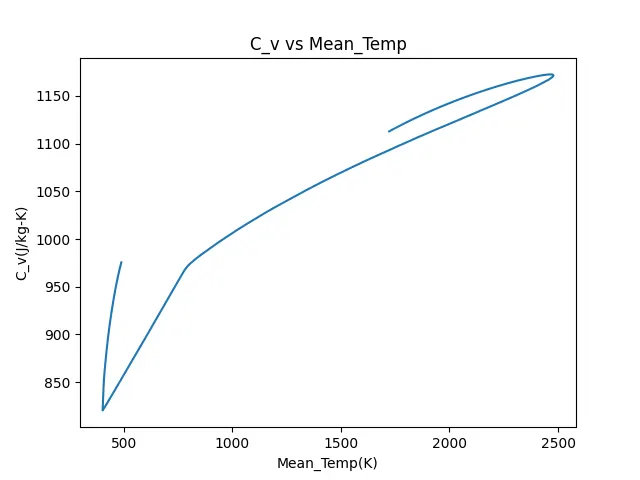
- Plot for variation of cp with mean temperature
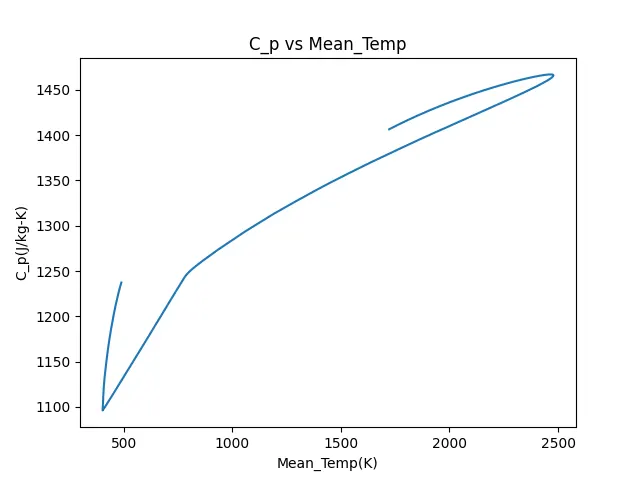
- Plot for variation of cp with volume
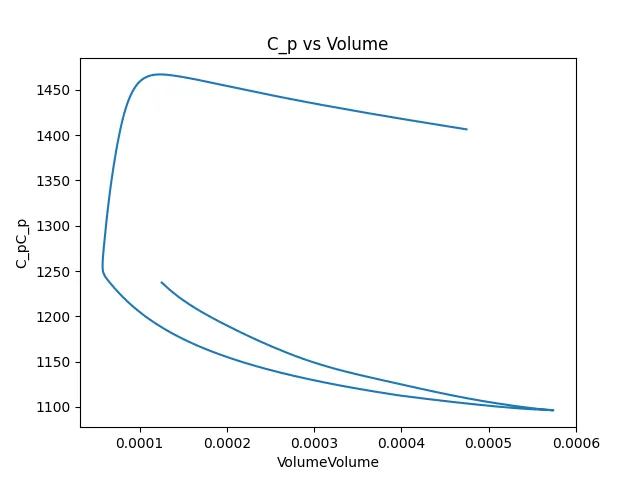
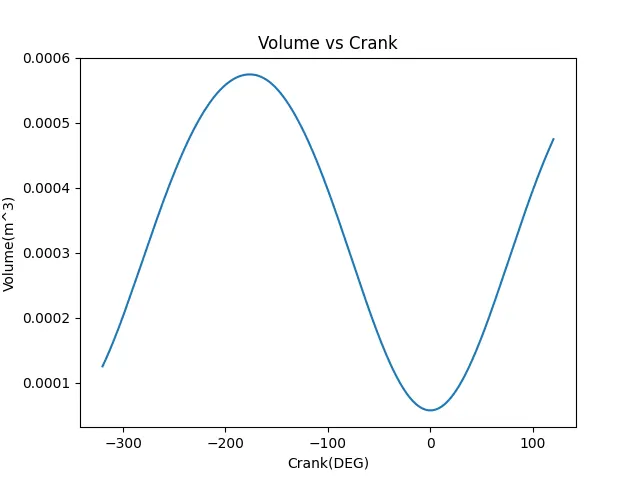
- Plot for variation of volume with crank
Conclusion:
- Area under PV diagram is 0.050058 KJ
- Power output of this engine is : 78.6319 KW.
- Specific fuel consumption : 0.011445 g/KWh.