Project 1 - Parsing NASA thermodynamic data
AIM:
- To Write a function that extracts the 14 co-efficients and calculates the enthalpy, entropy and specific heats for all the species in the data file.
- Calculate the molecular weight of each species and display it in the command window.
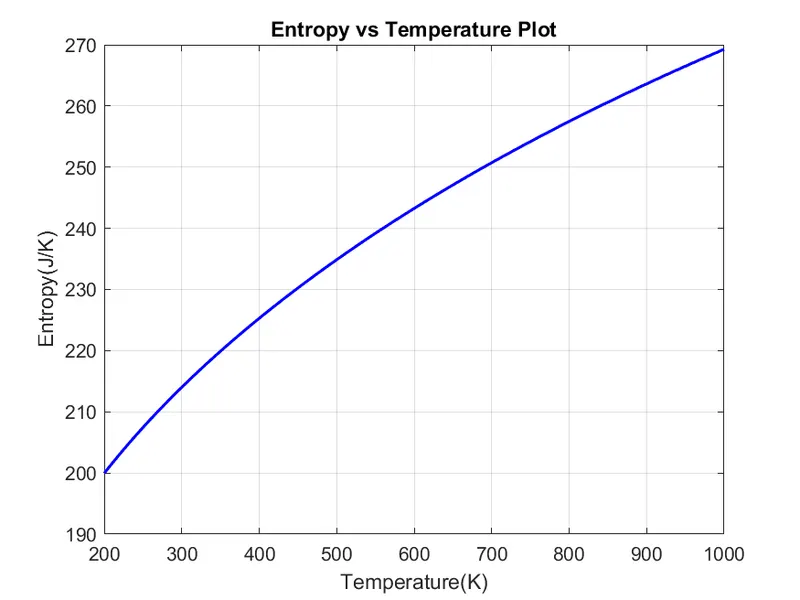
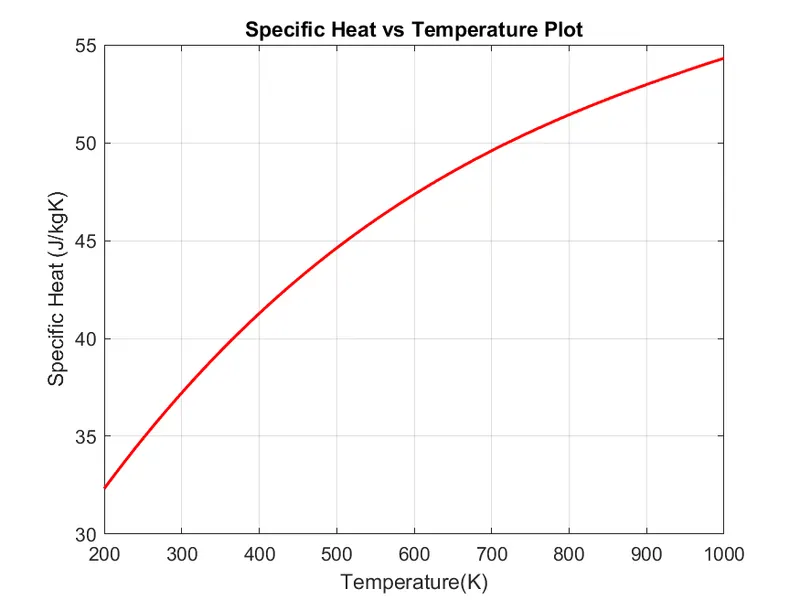
- Plot the Cp, Enthalpy and Entropy for the local temperature range (low temperature : high temperature) specific for each species.
- Save the plots as images with appropriate names and dump them in separate folders for each species with suitable name. All these should be generated automatically.
THEORY
Parsing a file means reading in a data stream and building a memory model of the content of that data. This aims at facilitating perfoming some kind of transformation on the data. Parsing splits a file or other input into pieces of data that can be easily stored or manipulated.
FORMULAE USED:

PROGRAM 1
%function for specific heat

function [ c_p,H,S] = therm_prop(A1,A2,A3,A4,A5,A6,A7,B1,B2,B3,B4,B5,B6,B7,local_mid_temp,T)
R = 8.314;

if (T>=local_mid_temp)
    c_p = R.*(A1+A2*T+A3*T.^2+A4*T.^3+A5*T.^4);
    H = R.*T.*(A1+A2*(T/2)+A3*((T.^2)./3)+A4*((T.^3)./4)+A5*((T.^4)./5)+A6./T);
    S = R.*(A1*log(T)+A2*T+A3*((T.^2)./2)+A4*((T.^3)./3)+A5*((T.^4)./4)+A7);

else
    c_p = R.*(B1+B2*T+B3*T.^2+B4*T.^3+B5*T.^4);
    H = R.*T.*(B1+B2*(T./2)+B3*((T.^2)./3)+B4*((T.^3)./4)+B5*((T.^4)./5)+(B6./T));
    S = R.*(B1*log(T)+B2*T+B3*((T.^2)./2)+B4*((T.^3)./3)+B5*((T.^4)./4)+B7);

end
PROGRAM 2
function [molecular_wt] = mw(species_name)

elements = ['H','C','N','O','A'];
atomic_wt = [1,12,14,16,40];
molecular_wt = 0;

for i = 1:length(species_name)
    for j = 1:length(elements)
        if strcmpi(species_name(i),elements(j))
            molecular_wt = molecular_wt + atomic_wt(j);
            position = j;
        end
    end
    f = str2double(species_name(i));
    if f>1
        molecular_wt = molecular_wt + atomic_wt(position)*(f-1);
    end
end
sprintf('Molecular weight of %s:%f', species_name,molecular_wt)
end
PROGRAM 3
%NASA FILE PARSING

clear all
close all
clc
f1 = fopen('THERMO.dat','r')
fgetl(f1)

%reading header information
tline = fgetl(f1)
A= str2num(tline);
global_low_temp = A(:,1)
global_mid_temp = A(:,2)
global_high_temp = A(:,3)

%skipping comment lines
for i = 1:3
fgetl(f1)
end


for j = 1:53
l6 = fgetl(f1);
s = strsplit(l6,' ');
species_name = (s{1});
d = findstr(l6,'.');
temp_range = l6((d(1)-3):(d(1)+23));
temp = strsplit(temp_range,' ');
% Extracting the local temperatures
local_low_temp  =str2num(temp{1});
local_mid_temp  =str2num(temp{2});
local_high_temp  =str2num(temp{3});

T = linspace(local_low_temp,local_high_temp,800);

% %coefficients from line 7
coeff_line1 = fgetl(f1)
coeff_line2 = fgetl(f1)
coeff_line3 = fgetl(f1)

a =strfind(coeff_line1,'E')
b =strfind(coeff_line2,'E')
c =strfind(coeff_line3,'E')

a1 = coeff_line1(1:a(1)+3)
A1 = str2double(a1)

a2 = coeff_line1(a(1)+4:a(2)+3)
A2 = str2double(a2)

a3 = coeff_line1(a(2)+4:a(3)+3)
A3 = str2double(a3)

a4 = coeff_line1(a(3)+4:a(4)+3)
A4 = str2double(a4)

a5 = coeff_line1(a(4)+4:a(5)+3)
A5 = str2double(a5)

a6 = coeff_line2(1:b(1)+3)
A6 = str2double(a6)

a7 = coeff_line2(b(1)+4:b(2)+3)
A7 = str2double(a7)


b1 = coeff_line2(b(2)+4:b(3)+3)
B1 = str2double(b1)

b2 = coeff_line2(b(3)+4:b(4)+3);
B2 = str2double(b2)

b3 = coeff_line2(b(4)+4:b(5)+3);
B3 = str2double(b3)

b4 = coeff_line3(1:c(1)+3);
B4 = str2double(b4);

b5 = coeff_line3(c(1)+4:c(2)+3);
B5 = str2double(b5);

b6 = coeff_line3(c(2)+4:c(3)+3);
B6 = str2double(b6)

b7 = coeff_line3(c(3)+4:c(4)+3);
B7 = str2double(b7)

molecule_name = char(species_name);

for i = 1:length(T)
             [c_p,H,S] = therm_prop(A1,A2,A3,A4,A5,A6,A7,B1,B2,B3,B4,B5,B6,B7,local_mid_temp,T);
         end
 % Changing the directory and save the plots in that directory
          mkdir('F:\Project1_NASA_file_parsing\species',species_name)

  % Creating the plots
         figure(1)
         plot(T,c_p,'linewidth',1.5,'color','r')
         xlabel('Temperature(K)');
         ylabel('Specific Heat (J/kgK)');
         title('Specific Heat vs Temperature Plot')
         grid on
         m1 = 'Specific Heat of %s';
         m2 = species_name;
         m3 = sprintf(m1,m2);

         figure(2)
         plot(T,H,'linewidth',1.5,'color','g')
         xlabel('Temperature(K)');
         ylabel('Enthalpy (J/mol)');
         title('Enthalpy vs Temperature Plot')
         grid on
         m4 = 'Enthalpy(H) of %s';
         m5 = species_name;
         m6 = sprintf(m4,m5);

         figure(3)
         plot(T,S,'linewidth',1.5,'color','b')
         xlabel('Temperature(K)');
         ylabel('Entropy(J/K)');
         title('Entropy vs Temperature Plot')
         grid on
         m7 = 'Entropy of %s';
         m8 = species_name;
         m9 = sprintf(m7,m8);

%changing directory
program = (['F:\Project1_NASA_file_parsing\species\',species_name]);
cd(program)

%saving plots
saveas(figure(1),sprintf('%s.png',m3))
 saveas(figure(2),sprintf('%s.png',m6))
 saveas(figure(3),sprintf('%s.png',m9))

cd('C:\Users\Skill-Lync.DESKTOP-7C4VU2C\Desktop\ARHAN')

         % Calculating the molecular weight
[molecular_wt]=mw(species_name);
% sprintf('The molecular weight of %s is %d', species_name, molecular_wt)
end
 fclose(f1);
CODE EXPLANATION:
- Program 1 deals with the calculation of specific heat, entropy and enthalpy calculations
-
The FIRST 7 coefficients are HIGH-temperature coefficients and the SECOND 7 coefficients are LOW-temperature coefficients.
- Here we use if and else command to calculate High and low temperature coefficients.
- Program 2 deals with the molecular weight calculation of the species
- Program 3 is the main program and this will be used to plot graphs and perform file parsing.
- Intially we read the THERMO dat file using fopen command
- Extracting the data from file using fgetl command
- Convert this string to numbers using str2num commmand
- Using strsplit command to split the temperature values and assigning them variable called global temperature.
- Using for loop command to get all temperatures amd coefficients that are present in our file.
- For getting temperature amd coefficient values we use findstr command in order to input the acccirate spot and specifying it.
- Converting this data which is in string format to numbers using str2num command
- Creating a new directory in the name of NASA file parsing
- Calculating the specific heat, entropy, enthalpy using the function command and calling cp, H, S.
- Plotting the data sets using plot command, corresponding title name and labels are given
- Changing the directory to save all the images
- calculating the molecular weight and then closing the file.
RESULTS
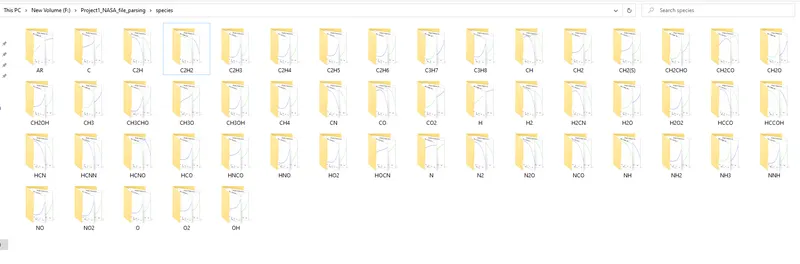
O2
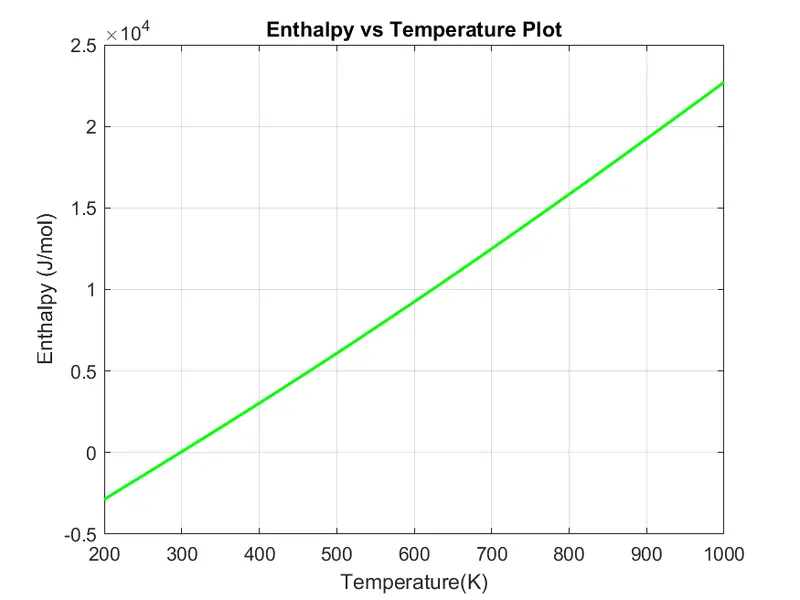
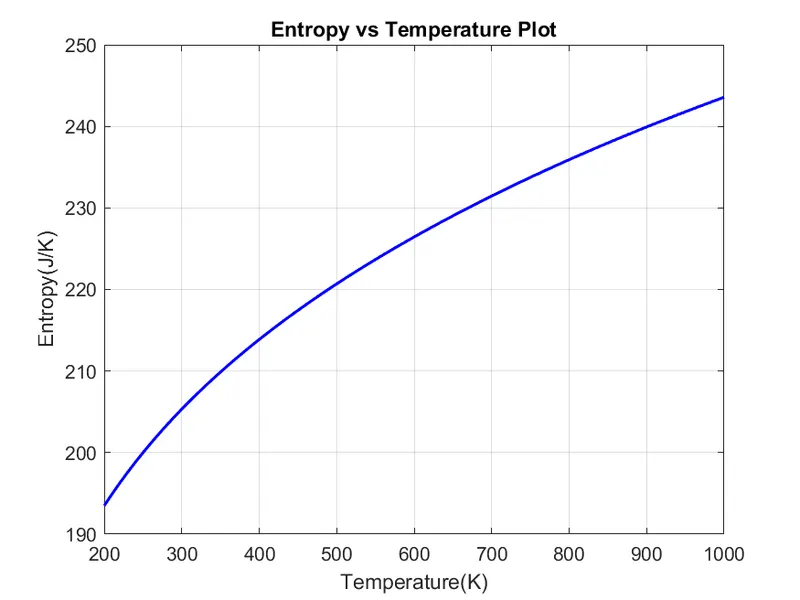
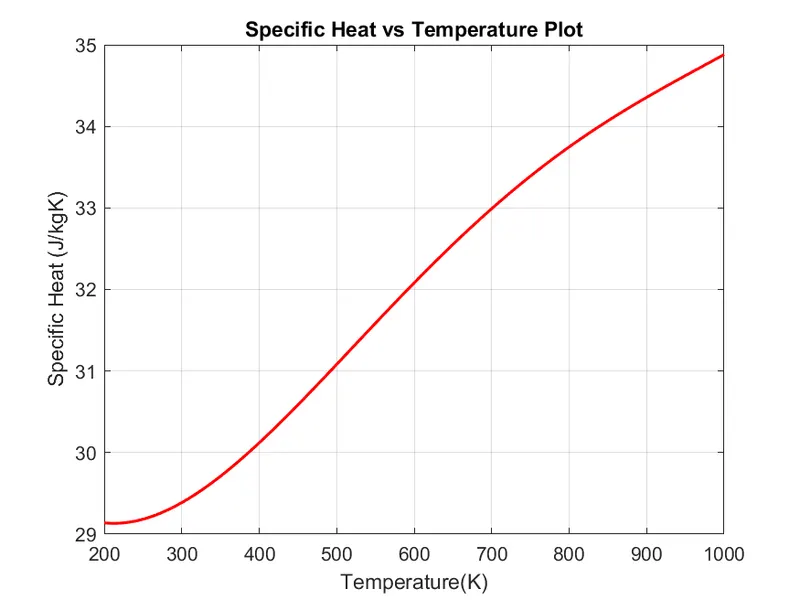
N2:
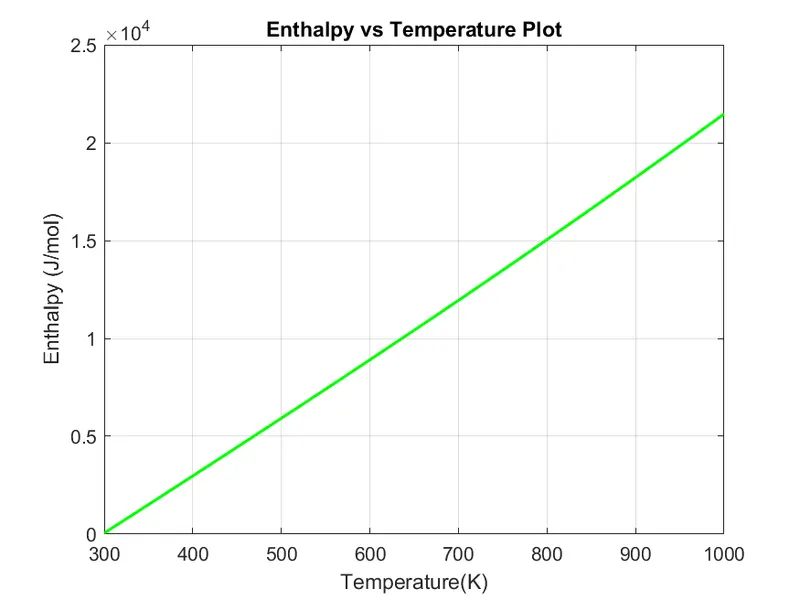
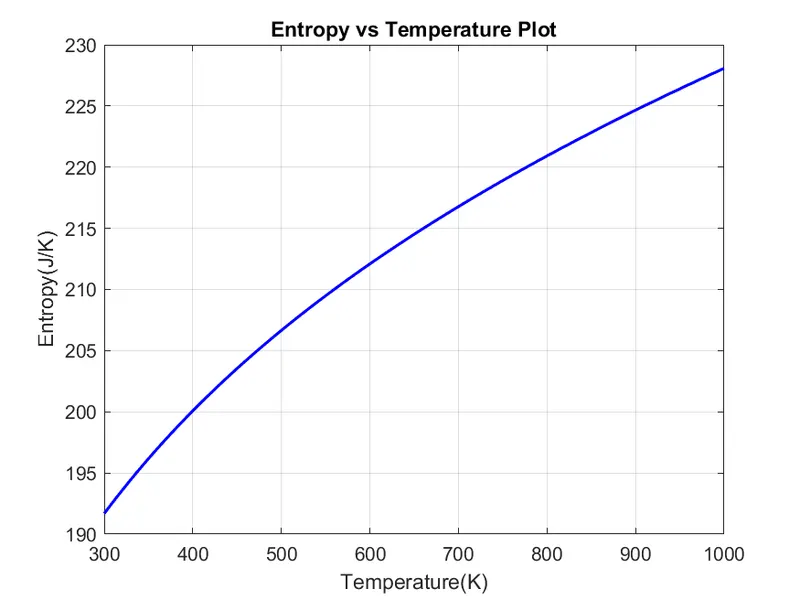
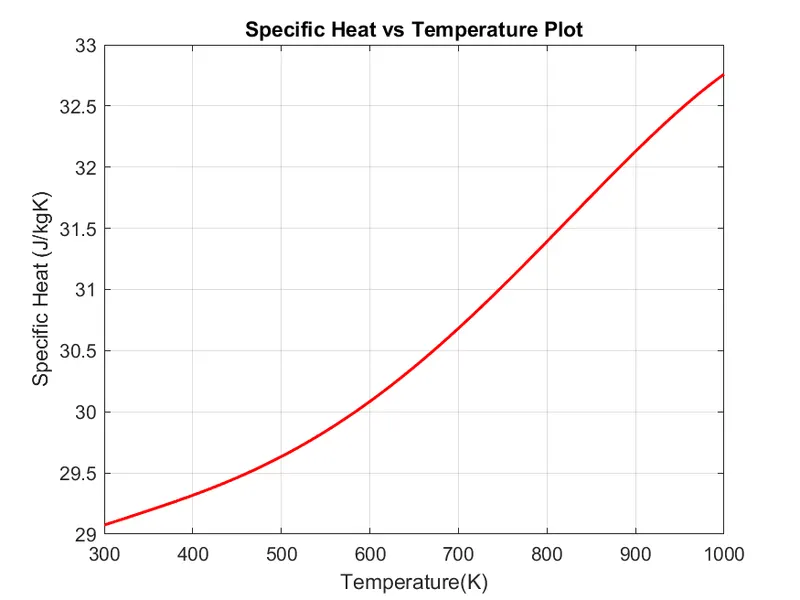
CO2:
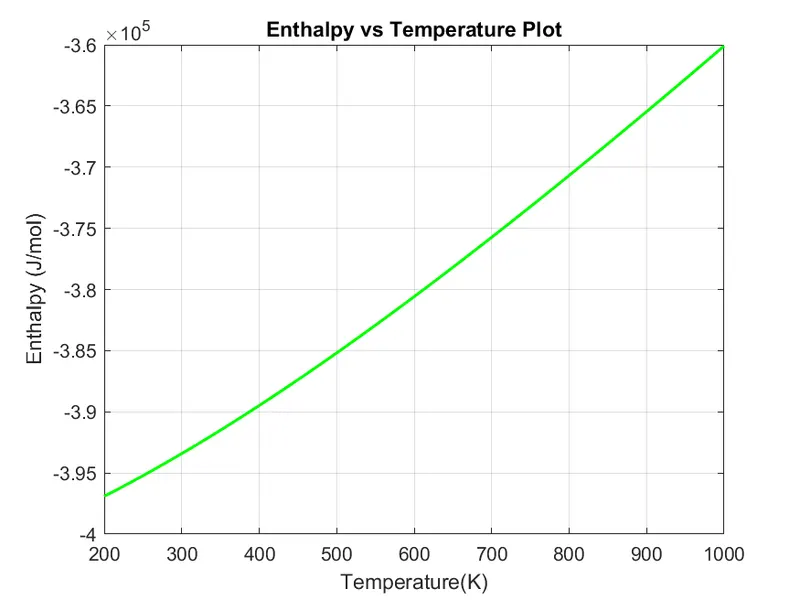
Conclusion:
- This program is used to do file parsing, where we read a file and extract data from the file and this data is used for calculation of entropy enthalpy and specific heat.
- Seperate folder was crreated to store all the species and their plots.