Week 6 - Data analysis
import math
import matplotlib.pyplot as plt
import numpy as np
from scipy.integrate import simps
file_name = input('Enter the Converge file having .out Extension: ')
try:
    f = open(file_name)
    f.close()
except FileNotFoundError:
    print('File Not Recognized')
    exit()
i = 0
for line in open(file_name):
    if '#' not in line:
        break
    i = i+1
j = 0
for line in open(file_name):
    j = j+1
    if j>1:
        break
if j == 1:
    print('No data present')
    exit()
i = 0
for line in open(file_name):
    if i == 2:
        c = line.split()
        i = 0
        break
    if i == 1:
        b = line.split()
        i = i+1
    if 'column' in line.split():
        a = line.split()
        i = 1
a.remove("column")
a.remove("#")
a= np.array(a,dtype = np.int64)
b.remove("#")
c.remove("#")
num_col = len(a)
data_counter = 0
data = np.arange(0,num_col)
for line in open(file_name):
    if '#' not in line:
        d = line.split()
        d = np.array(d,dtype = np.float32)
        data = np.vstack([data,d])
        data_counter = data_counter + 1
data = np.delete(data,0,0)
print("Type - ")
for i in a:
    print("{} for {}".format(i,b[i-1]))
print(' ')
x = input("Plot between any 2 variables (y/n): ")
while (x.lower()=='y'):
    cn1 = input("Column number of X variable: ")
    cn2 = input("Column number of Y variable: ")
    cn1 = int(cn1)
    cn2 = int(cn2)
    plt.figure()
    plt.plot(data[:,cn1-1],data[:,cn2-1])
    plt.xlabel('{} {}'.format(b[cn1-1],c[cn1-1]))
    plt.ylabel('{} {}'.format(b[cn2-1],c[cn2-1]))
    plt.title('{} {} vs {} {}'.format(b[cn2-1],c[cn2-1],b[cn1-1],c[cn1-1]))
    z = 'n'
    z = input(" Save the plot (y/n): ")
    if (z.lower() == 'y'):
        plt.savefig("{}-{}.png".format(b[cn2 - 1],b[cn1-1]))
    plt.show()
    print('')
    x = input("Plot between any 2 other variables (y/n): ")
print('')
x = input("Single Variable plot (y/n): ")
while (x.lower()=='y'):
    cn = input("Column number of the variable")
    cn = int(cn)
    plt.figure()
    plt.plot(np.arange(0,data_counter),data[:,cn-1])
    plt.xlabel('Data Point Number')
    plt.ylabel('{} {}'.format(b[cn - 1], c[cn - 1]))
    z = 'n'
    z = input(" Save the plot (y/n): ")
    if (z.lower() == 'y'):
        plt.savefig("{}.png".format(b[cn-1]))
    plt.show()
    print('')
    x = input("Single Variable plot (y/n): ")
print('')
print("Performance of the Engine")
b_1 = [i.lower() for i in b]
pressure_column = b_1.index('pressure')
volume_column = b_1.index('volume')
Pressure = data[:,pressure_column]
Volume = data[:,volume_column]
A = 0
A = simps(Pressure, Volume, even = 'First')*np.power(10,6)
rpm = float(input("RPM: "))
f = float(input("Fuel consumed per cycle (in micrograms): "))
n = rpm/(120)
P = A*n
f = (f*n*3600)/np.power(10,9)
sfc = (f*1000)/P
print("Area under PV curve = {} J".format(A))
print("Power output at {} rpm = {} W".format(rpm,P))
print("Specific fuel Consumption = {} Kg/KW.hr".format(sfc))
PROCEDURE OF THE CODE:
- Import 'matplotlib.pyplot', 'numpy' and 'simps' from 'scipy.integrate'
- Take the filenames as the input and assign the 'file_name' variable
- Check if the given file is of the required format by giving the conditions using 'try', 'for' and 'if' commands
- Check if the given file contains data required to perform the required calculations.
- Extract the data from the file and convert it into an 2D array so that it can be utilized to perform mathematical operations to perform the required calculations.
- Give the inputs for plotting the required graphs, by giving an option of a plot for 2 variables and a plot for 1 variable.
- Extract the information for volume and pressure from the 'data' matrix and integrate the obtained data using 'simps' command.
- Enter the value for engine speed (in RPM) and fuel consumption (in micrograms). Give the expressions required for calculating the Powe and Specific fuel consumption using the data obtained from the above steps.
RESULTS:
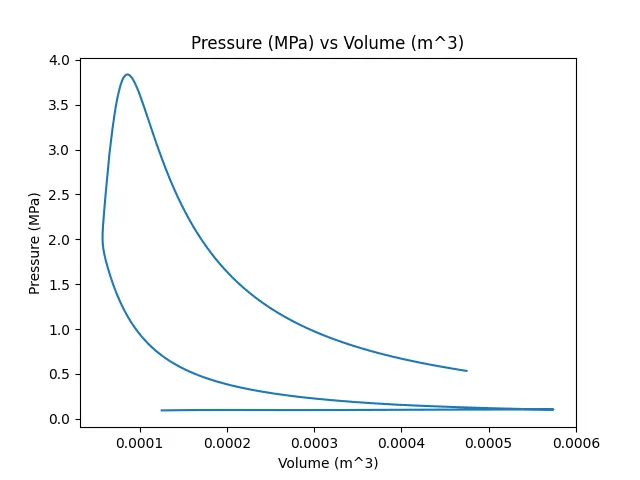
Pressure vs Volume Plot
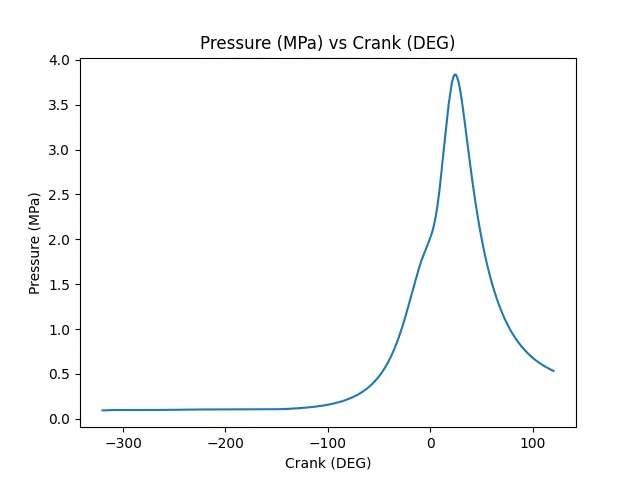
Pressure vs Crank Plot
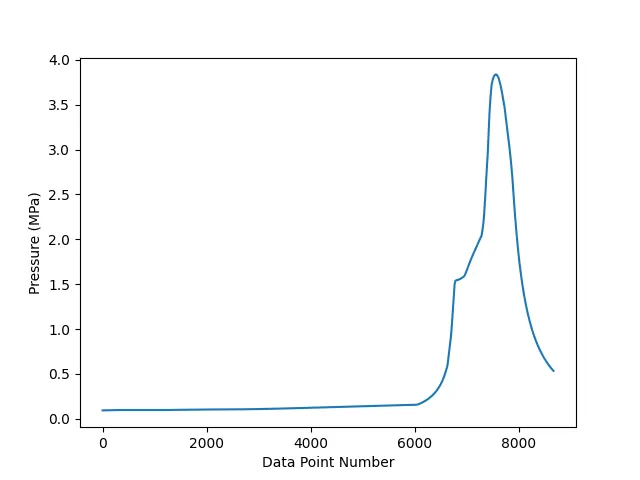
Pressure at each data point
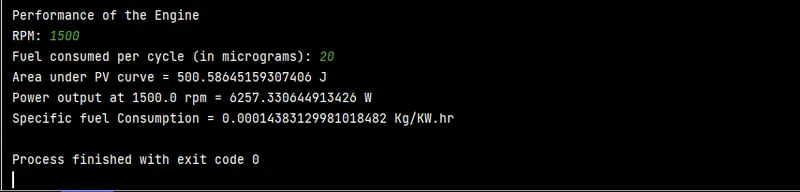
Work done, Power and Specific fuel consumption of the given engine