Project 1 - Parsing NASA thermodynamic data
% Challenge 8 - NASA File Parsing - Molecular Weight calculation Function Code
function Mole_Wt = Mol_Wt(species_name)
Weight = 0;
elements = ['H','C','N','O','Ar'];
mass = [1.008,12.011,14.007,15.999,39.948];
for i = 1:length(species_name)
    for j = 1:length(elements)
        if strcmpi(species_name(i),elements(j))
            Weight = Weight+mass(j);
            y = j;
        end
    end
    number = str2double(species_name(i));
    if (number>1)
        Weight = Weight+(mass(y)*(number-1));
    end
    Mole_Wt = Weight;
end
% Challenge 9 - NASA File Parsing - Entropy Function Code
function S_Value = entropy(b1,b2,b3,b4,b5,b7,b8,b9,b10,b11,b12,b14,Local_Low_GT,Local_Mid_GT,Local_High_GT,t,R)
if (t>Local_Mid_GT)
S_Value = ((b1.*log(t))+(b2.*t)+((b3.*(t.^2))/2) +((b4.*(t.^3))/3)+((b5.*(t.^4))/4)+(b7)).*R;
else
S_Value = ((b8.*log(t))+(b9.*t)+((b10.*(t.^2))/2) +((b11.*(t.^3))/3)+((b12.*(t.^4))/4)+(b14)).*R;
end
end% Challenge 9 - NASA File Parsing - Enthalpy Function Code
function H_Value = enthalpy(b1,b2,b3,b4,b5,b6,b8,b9,b10,b11,b12,b14,Local_Low_GT,Local_Mid_GT,Local_High_GT,t,R)
if (t>Local_Mid_GT)
H_Value = (b1)+((b2.*t)./2)+((b3.*(t.^2))./3) +((b4.*(t.^3))./4)+((b5.*(t.^4))./5)+(b6./t).*(R.*t);
else
H_Value = (b8)+((b9.*t)./2)+((b10.*(t.^2))./3) +((b11.*(t.^3))./4)+((b12.*(t.^4))./5)+(b14./t).*(R.*t);
end
end
% Challenge 9 - NASA File Parsing - Specific Heat Function Code
function Cp_Value = specific_heat(b1,b2,b3,b4,b5,b8,b9,b10,b11,b12,Local_Low_GT,Local_Mid_GT,Local_High_GT,t,R)
if (t>Local_Mid_GT)
    Cp_Value = (b1+(b2*t)+(b3*(t.^2))+(b4*(t.^3))+(b5*(t.^4)))*R;
else
    Cp_Value = (b8+(b9*t)+(b10*(t.^2))+(b11*(t.^3))+(b12*(t.^4)))*R;
end
end
% Challenge 9  - NASA File Parsing
% Import the data file to MATLAB
f1 = fopen('Thermo.dat','r');
fgetl(f1); % Header information
t_line = fgetl(f1); % Global Temperature
a = strsplit(t_line,' ');
Low_GT = str2double(a{2});
Mid_GT = str2double(a{3});
High_GT = str2double(a{4});
fgetl(f1);
fgetl(f1);
fgetl(f1);
% Reading the species in the data file
% Line 1
for i = 1:53
    t_line2 = fgetl(f1);
    s = strsplit(t_line2,' ');
    species_name = s{1};
    A = strfind(t_line2,'G');
    temp_values = t_line2(A+4:length(t_line2));
    B = strsplit(temp_values,' ');
    % Local Temperature
    Local_Low_GT = str2double(B{1});
    Local_Mid_GT = str2double(B{2});
    Local_High_GT = str2double(B{3});
    t_line = fgetl(f1);
    b = findstr(t_line,'E');
    % Coefficients 1 to 5
    b1 = t_line(1:b(1)+3);
    b1 = str2num(b1);
    b2 = t_line(b(1)+4:b(2)+3);
    b2 = str2num(b2);
    b3 = t_line(b(2)+4:b(3)+3);
    b3 = str2num(b3);
    b4 = t_line(b(3)+4:b(4)+3);
    b4 = str2num(b4);
    b5 = t_line(b(4)+4:b(5)+3);
    b5 = str2num(b5);
    line2 = fgetl(f1); % Line 2
    % Coefficients 6 to 10
    b6 = line2(1:b(1)+3);
    b6 = str2num(b6);
    b7 = line2(b(1)+4:b(2)+3);
    b7 = str2num(b7);
    b8 = line2(b(2)+4:b(3)+3);
    b8 = str2num(b8);
    b9 = line2(b(3)+4:b(4)+3);
    b9 = str2num(b9);
    b10 = line2(b(4)+4:b(5)+3);
    b10 = str2num(b10);
    line3 = fgetl(f1); % Line 3
    % Coefficients 11 to 14
    b11 = line3(1:b(1)+3);
    b11 = str2num(b11);
    b12 = line3(b(1)+4:b(2)+3);
    b12 = str2num(b12);
    b13 = line3(b(2)+4:b(3)+3);
    b13 = str2num(b13);
    b14 = line3(b(3)+4:b(4)+3);
    b14 = str2num(b14);
    R = 8.314; % Universal Gas Constant
    t = linspace(Local_Low_GT,Local_High_GT,100);
    % Import Specific Heat Function
    Cp = specific_heat(b1,b2,b3,b4,b5,b8,b9,b10,b11,b12,Local_Low_GT,Local_Mid_GT,Local_High_GT,t,R);
    % Import Enthalpy Function
    H = enthalpy(b1,b2,b3,b4,b5,b6,b8,b9,b10,b11,b12,b14,Local_Low_GT,Local_Mid_GT,Local_High_GT,t,R);
    % Import Entropy Function
    S = entropy(b1,b2,b3,b4,b5,b7,b8,b9,b10,b11,b12,b14,Local_Low_GT,Local_Mid_GT,Local_High_GT,t,R);
    % Create folders for each species
    mkdir(['C:\Users\Skill-Lync\Documents\MATLAB\',species_name])
    cd(species_name)
    % T(Temperature) vs Cp(Specific Heat) plot
    figure(1)
    plot(t,Cp,'linewidth',5,'color','g')
    grid on
    xlabel('Temperature')
    ylabel('Specific Heat (J/K)')
    title('Temperature vs Specific Heat')
    image = getframe(gcf);
    imwrite(image.cdata,'Temperature vs Cp.png')
    % T(Temperature) vs S(Entropy) plot
    figure(2)
    plot(t,S,'linewidth',5,'color','r')
    grid on
    xlabel('Temperature')
    ylabel('Entropy (J/K)')
    title('Temperature vs Entropy')
    image = getframe(gcf);
    imwrite(image.cdata,'Temperature vs S.png')
    % T(Temperature) vs H(Enthalpy) plot
    figure(3)
    plot(t,H,'linewidth',5,'color','b')
    grid on
    xlabel('Temperature')
    ylabel('Entha1py (J/Kg)')
    title('Temperature vs Enthalpy')
    image = getframe(gcf);
    imwrite(image.cdata,'Temperature vs H.png')
    saveas(figure(1),'Cp vs. T','jpg')
    saveas(figure(2),'S vs. T','jpg')
    saveas(figure(3),'H vs. T','jpg')
    cd ..
    % Molecular Weight Calculation
    [M] = Mol_Wt(species_name);
    K = sprintf('%s Weight = %f',species_name,M);
    disp(K)
end
TASK 1 - CODING THE FUNCTION FOR CALCULATING MOLECULAR WEIGHTS
- Use the 'function' command to initiate the function. Name the function as 'Mol_Wt' and declare the input arguments.
- Give 'Weight' as '0' and 'elements' as 'H, C, N, O & Ar'.
- Enter the mass of each element respectively.
- Initiate 2 'for' loops and state the conditions for 2 newly declared variables, 'i' and 'j'.
- Give the 'end' command twice to close both the 'for' loops. Declare a new variable 'number', enter its input type and its relationship with 'Weight'.
- Enter the 'end' command to close the function command.
- Save the file as 'Mol_Wt.m' .
TASK 2 - CODING THE FUNCTIONS FOR SPECIFIC HEAT, ENTHALPY AND ENTROPY
- Use the 'function' command to initiate the function and name the function as 'entropy' and declare the input variables.
- Declare the conditions for the temperature on which the function is dependent on and give the expressions required to calculate the Specific heat for plotting the graphs.
- Enter the 'end' command to closte the 'function' command.
- Save the file as 'entropy.m' .
- Repeat the same process for the other two functions and save them as 'enthalpy.m' and 'specific_heat.m' respectively.
TASK 3 - CODING THE MAIN PROGRAM FOR EVALUATING AND SAVING THE PLOTS
- Use 'fopen' command to import the 'THERMO.dat' file into MATLAB for parsing through the data available in the file.
- Use 'fgetl' command to obtain the header information and equate it to the global temperature variable, 't_line'.
- Give the conditions for reading the species block by using the 'for' command and declare the local temperature value inputs.
- Assign the coefficients as b1, b2, b3, etc. by obtaining the required string and converting the obtained string into a number.
- Declare the universal gas constant, R, and use the 'linspace' command to declare the range of the temperature that is used to calculate the plots of Specific heat, enthalpy and entropy.
- Import the specific heat, enthalpy and entropy functions and equate them to 'Cp', 'H' and 'S' respectively.
- Create folders for each species by using 'mkdir' command and entering the path where the folders should be created.
- Use the 'cd' command to change the folder for each species.
- Initiate 'figure' command as 'figure(1)' and plot temperature and specific heat by giving the linewidth as 5 and color as green.
- Give the title as 'Temperature vs Specific heat' , use the 'getframe(gcf)' command, 'imwrite' command to write the image at the required folder.
- Repeat the steps 9 and 10 for the plots of Temperature vs Enthalpy and Temperature vs Entropy.
- Give the 'saveas' command th save the obtained graphs in their respective species folders and give the titles of the images along with the file type.
- Initiate the cd command again to ensure the creation of folders of all the species.
- Import the Molecular weight function and equate it to a vector '[M]'.
- Use 'sprintf' command to convert the vector data into string format.
- Display the obtained string data as Molecular Weight of the species.
- Give the 'end' command to close the 'for' loop
ERRORS OBTAINED:
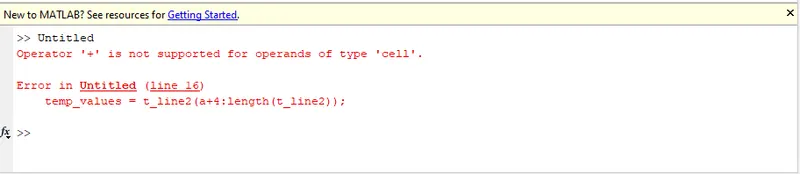
Error 1 - Operator wasn't supported for the 'cell' data type.
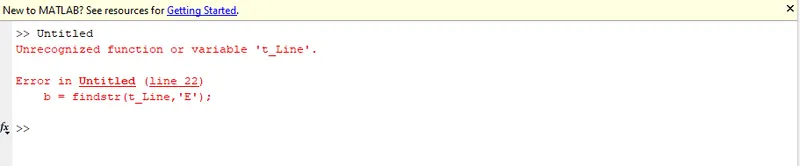
Error 2 - 't_Line' was not a recognized variable.
STEPS TAKEN TO RESOLVE THE ERRORS:
Error 1 - 'a' in hte line has been changed to 'A', reolving the error.
Error 2 - 't_Line' has been changed to 't_line', resolving the error.
RESULTS
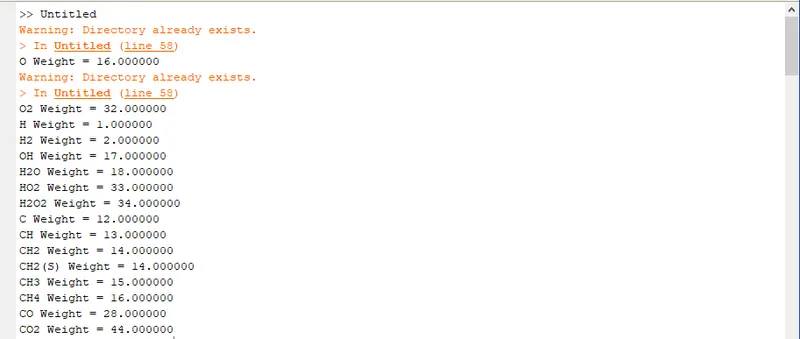
Molecular Weights of all species - part 1
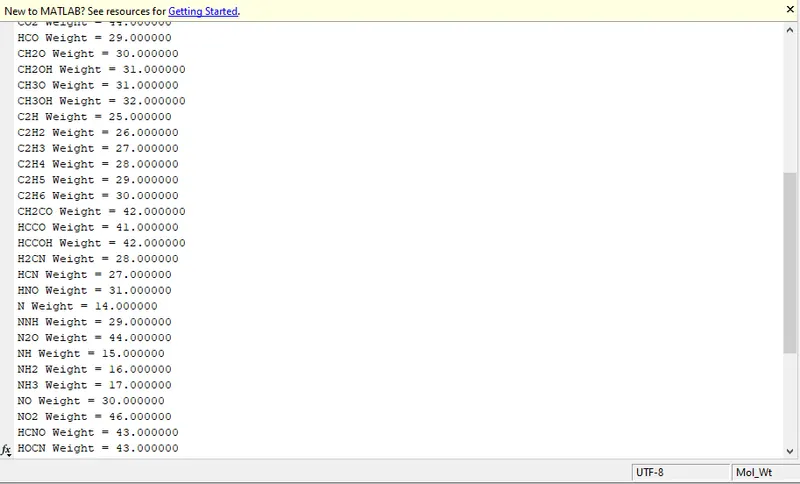
Molecular weights of all species - part 2
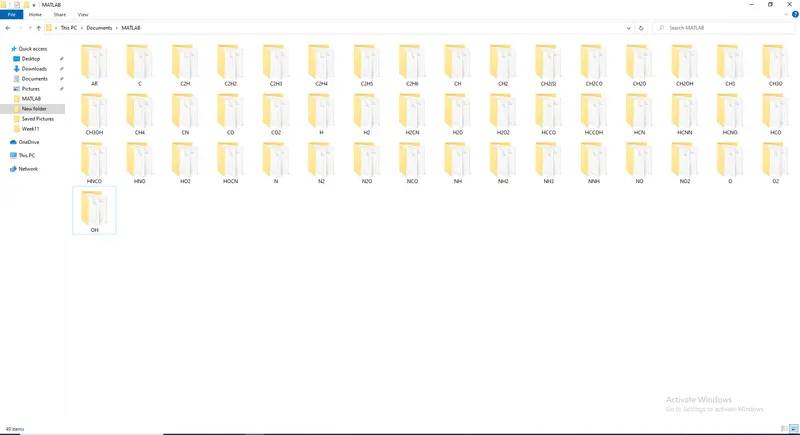
Location of the saved files
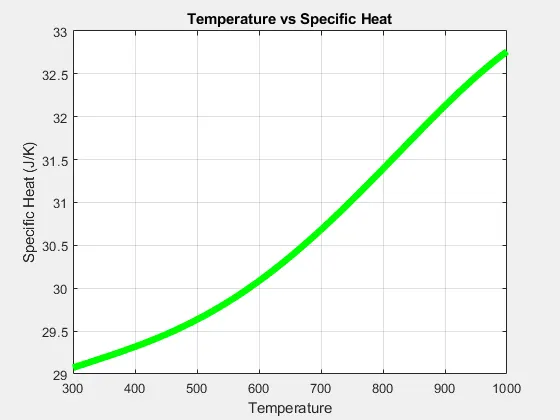
Temperature vs Cp - N2
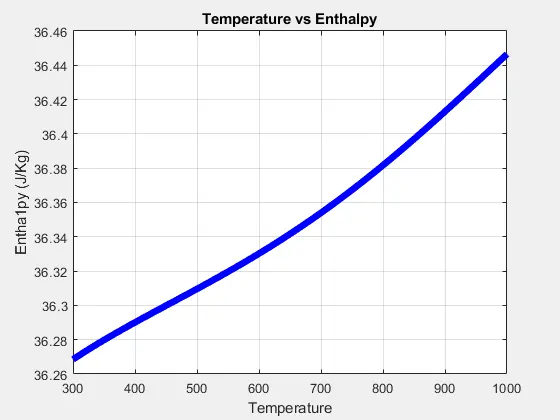
Temperature vs H - N2
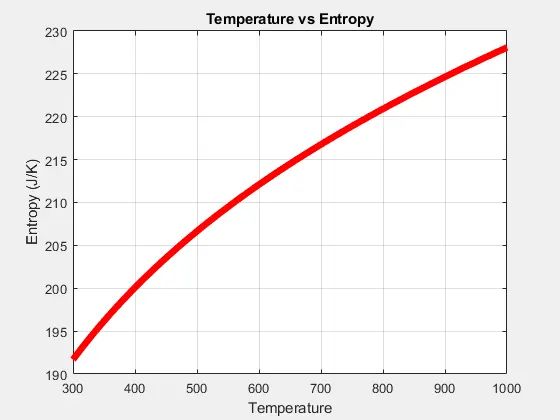
Temperature vs S - N2
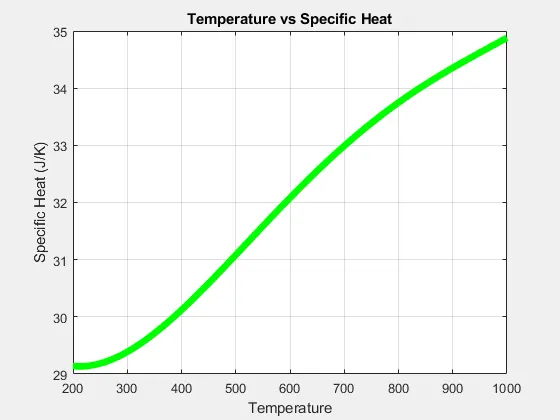
Temperature vs Cp - O2
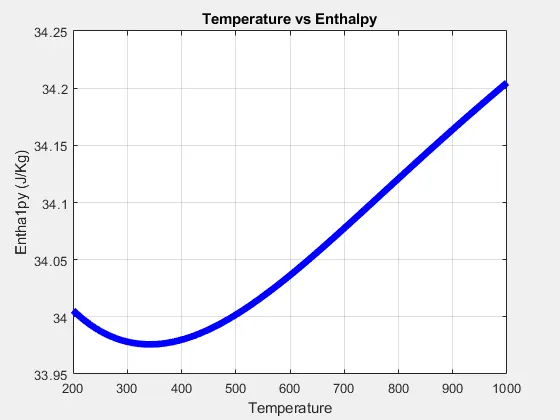
Temperature vs H - O2
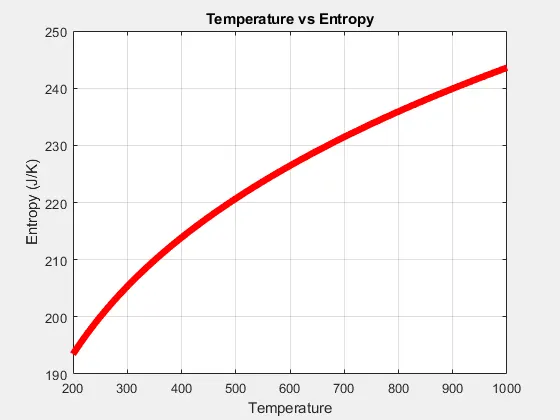
Temperature vs S - O2
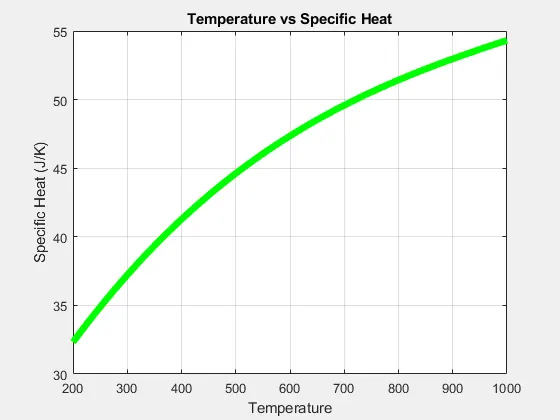
Temperature vs Cp - CO2
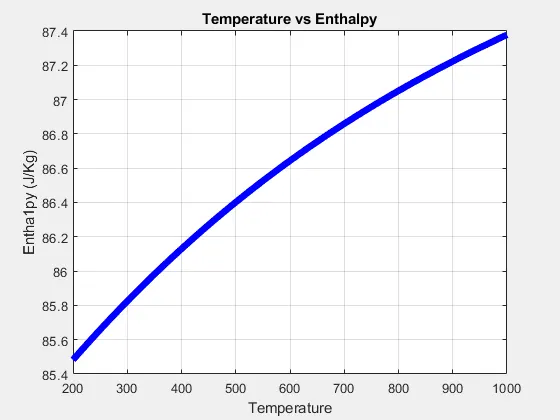
Temperature vs H - CO2
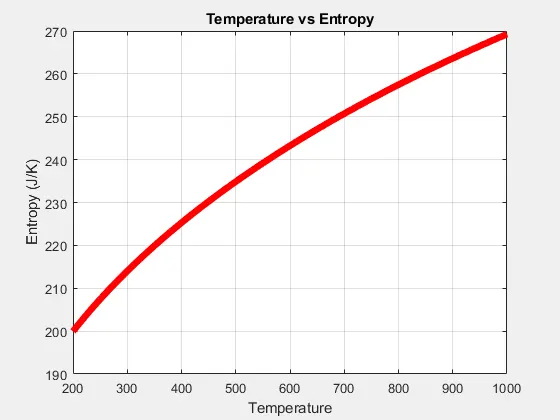
Temperature vs S - CO2