Week 4.1 - Genetic Algorithm
% Challenge 8 - Genetic Algotihm - Function Code
syms x y
function[p] = gene_alg(input_vector)
x = input_vector(1);
y = input_vector(2);
f1x = (sin(5.1*pi*x + 0.5)).^6;
f1y = (sin(5.1*pi*y + 0.5)).^6;
t1 = ((x-0.0667).^2/(0.64));
t2 = ((y-0.0667).^2/(0.64));
f2x = exp(-4.*log(2)*t1);
f2y = exp(-4.*log(2)*t2);
p = -(f1x.*f2x.*f1y.*f2y);
end
% Challenge 8 - Genetic Algorithm
% Search space for the function
x = linspace(0,0.5,350);
y = linspace(0,0.5,350);
[X,Y] = meshgrid(x,y);
% Number of iterations performed by the function to evaluate the fitness
num_case = 150;
% Surface plot for gene_alg function
for i = 1:length(X)
for j = 1:length(Y)
input_vector(1) = X(i,j);
input_vector(2) = Y(i,j);
p(i,j) = gene_alg(input_vector);
end
end
% Generate the surface for the plot
surfc(X,Y,-p);
% Remove the lines produced by mesh grid
shading interp
% Initiate timer for calculating survey time
tic
for i=1:num_case
% Calculate the optimized value of the function
[inputs,popt(i)] = ga(@gene_alg,2);
% Optimized value at each iteration
xopt(i) = inputs(1);
yopt(i) = inputs(2);
end
% Display time taken to complete the survey
survey1_time = toc
% Plot the graph wit the obtained optimized data
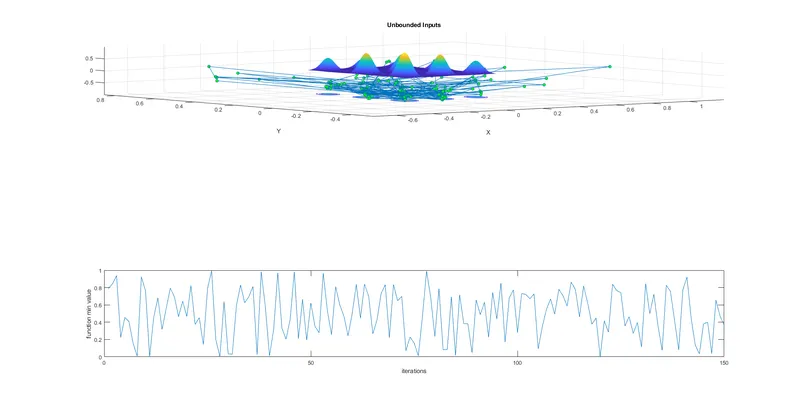
figure(1)
subplot(3,1,1)
surfc(X,Y,-p);
hold on
shading interp
plot3(xopt,yopt,popt,'marker','o','markersize',5,'markerfacecolor','g')
title('Unbounded Inputs')
xlabel('X');
ylabel('Y');
grid on
subplot(3,1,3)
plot(-popt);
xlabel('iterations')
ylabel('function min value')
% Initiate timer for calculating survey time
tic
for j=1:num_case
% Calculate the optimized value of the function
[inputs,popt(j)] = ga(@gene_alg,2,[],[],[],[],[0;],[1;1]);
% Optimized value at each iteration with the boundaary conditions
xopt(j) = inputs(1);
yopt(j) = inputs(2);
end
% Display time taken to complete the survey
survey2_time = toc
% Plot the graph with the obtained optimized data
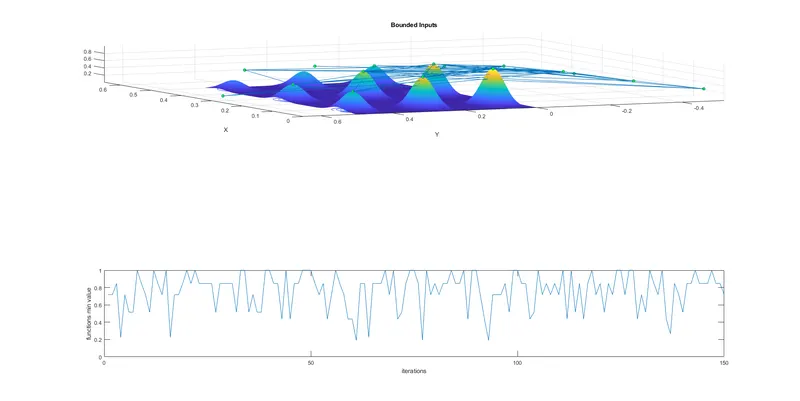
figure(2)
subplot(3,1,1)
hold on
surfc(X,Y,-p)
shading interp
plot3(xopt,yopt,-popt,'marker','o','markersize',5,'markerfacecolor','g')
title('Bounded Inputs')
xlabel('X')
ylabel('Y')
grid on
subplot(3,1,3)
plot(-popt);
xlabel('iterations')
ylabel('functions min value')
% Increase the population by usinf the 'optimoptions' command
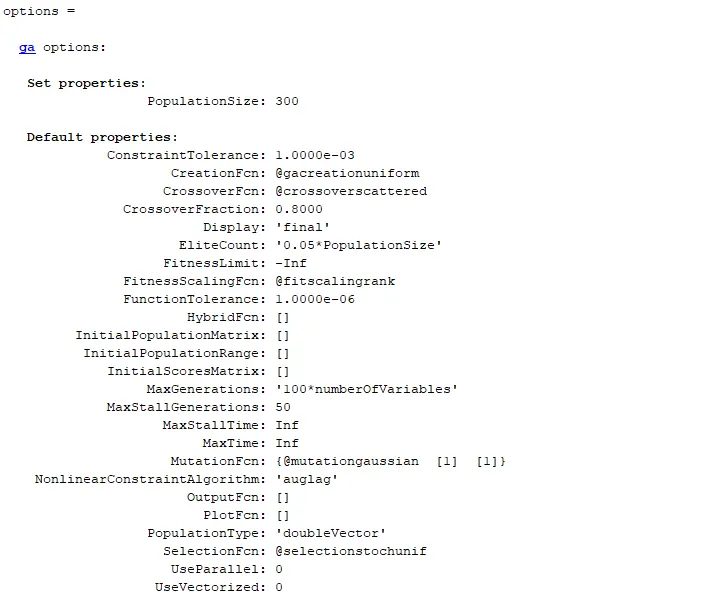
options = optimoptions('ga','populationsize',300)
% Initiate timer for calculating survey time
tic
for k=1:num_case
% Calculate the optimized value of the function
[inputs,popt(k)] = ga(@gene_alg,2,[],[],[],[],[0;0],[1;1],[],[],options);
% Optimized value at each iteration
xopt(k) = inputs(1);
yopt(k) = inputs(2);
end
% Display time taken to complete the survey
survey3_time = toc
% Plot the graph with the obtained optimized data
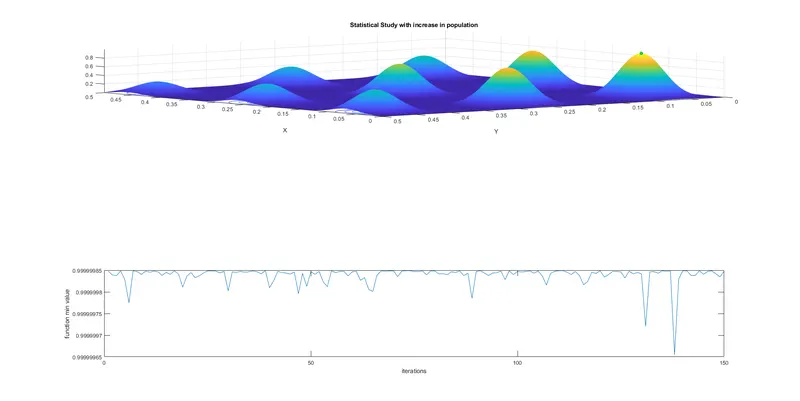
figure(3)
subplot(3,1,1)
hold on
surfc(X,Y,-p)
shading interp
plot3(xopt,yopt,-popt,'marker','o','markersize',5,'markerfacecolor','g')
title('Statistical Study with increase in population')
xlabel('X')
ylabel('Y')
grid on
subplot(3,1,3)
plot(-popt);
xlabel('iterations')
ylabel('function min value')% Challenge 8 - Genetic Algorithm - Optimum Maximum Value
x = linspace(0,0.5,350);
y = linspace(0,0.5,350);
[xx,yy] = meshgrid(x,y);
for i = 1:length(xx)
for j = 1:length(yy)
input_vector(1) = xx(i,j);
input_vector(2) = yy(i,j);
p(i,j) = stalagmite(input_vector);
end
end
options = optimoptions('ga','PlotFcn',@gaplotbestf,'populationsize',300);
[x,fval] = ga(@stalagmite,2,[],[],[],[],[0;0],[1;1],[],[],options);
xopt = x(1);
yopt = x(2);
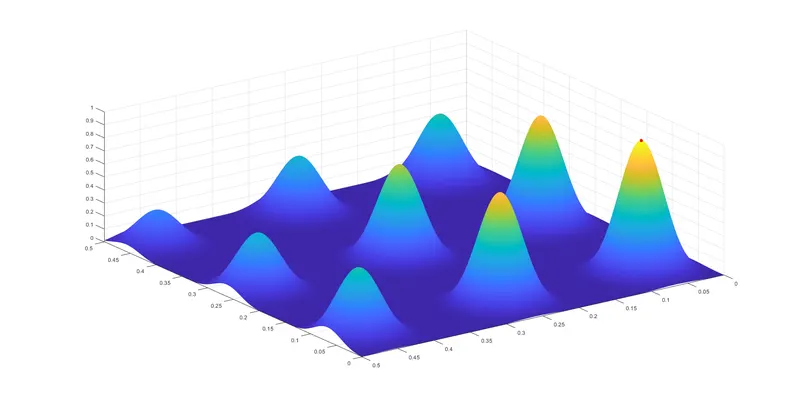
figure(4)
surf(xx,yy,-p);
shading interp
hold on
plot3(xopt,yopt,-fval,'ro','markersize',5,'markerfacecolor','r')TASK 1 :- CODING THE GENETIC ALGORITHM FUNCTION
- Initiate the 'function' command by namieng it as 'gene_alg' and give the variables required.
- Define the variables given in the 'gene_alg' function.
- Give the equation carried by the function.
- Define each term in the equation by expanding them to thier respective expressions.
- Type the 'end' command to complete the function.
- Save the program as 'gene_alg.m'
TASK 2 :- CODING THE GENETIC ALGORITHM PLOTS
- Define the search space for the function and iteration performed to define the fintess of the plots.
- Generate the surface plot for the Genetic Algorithm function.
- Initiate the timer to calculate time taken to complete each survey.
- Obtain the optimized values for each iteration.
- By using the 'plot' command and giving the marker size, marker type and marker face color, make a plot with the oobtained values for unbounded method.
- Use the 'ga' command and 'gene_alg' function and the boundaries required for obtining the optimized values.
- Use the optimized values and make a plot for bounded method using 'plot' command, giving the marker size, marker type and marker face color.
- By utilizing the 'optimoptions' function, increase the population size for the function to 300.
- Obtain the optimized values by using 'ga' command and the 'gene_alg' function.
- Make a plot for the obtained values by using the 'plot' command, giving the marker size, marker type and marker face color.
TASK 3 :- OBTAINING THE OPTIMUM MAXIMUM VALUE
- Define the search space for the function.
- Give the input conditions and declare the input variables.
- Use the 'optimoptions' command and 'gaplotbestf' function to increase the population size for obtaining the optimim maximum value of the function and the plot of the function.
- Input the 'ga' command and 'gene_alg' functionand boundaries required to obtain the values.
- Plot the obtained values by using 'plot' command, giving the marker size, marker type and marker face color.
ERRORS ENCOUNTERED :- None
RESULTS :-