Week 6 - Data analysis
1. Introduction
Data analysis can be described as the process of cleaning, modifying, extracting and processing raw information to aid in making informed decisions. The end goal of performing data analysis is to have access to detailed insights and statistics, including in the form of charts, images, tables, and graphs, that would positively impact processes, businesses, etc. Most often, data analysis is carried out on huge datasets which may be unstructured or unreadable, depending on the content and its arrangement within that particular document, and parsing data helps in making that kind of information more readable and valuable. Furthermore, file parsing assists in automating extraction of information which can reduce data retrieval time significantly and rather allocate more time towards additional testing, if necessary, and/or post-processing and decision-making. The aim of this programming exercise was to implement file parsing and its automation in order to perform data analysis on an engine output dataset.
2. Method
2.1 Modelling
The problem was solved by building a mathematical model in Python using the Sublime Text source code editor (code snippet for which is attached with this report) along with the math, numpy and matplotlib.pyplot modules/libraries for defining mathematical expressions, creating arrays and its corresponding expressions, and building the concerned plots respectively. Additionally, the linecache module was also used to access any line from the given CONVERGE output file which tries to internally optimize with the help of a cache, the common situation where multiple lines can be read from a single document. Similarly, the os module offers a simplified way of using operating system dependent functionality, in this case to utilise the splittext function within the os.path module which separates the file path string into name of the file and its extension as a pair of root and extension such that when the two are joined, it points to the original file path again, and the dirname function to extract the directory name. The reasons behind implementing the linecache and os modules were to sort the data which would later be used to present the same in a tabular format as means of informing the user and taking in column numbers as the input, and for performing compatibility check if the CONVERGE output file was not valid.
2.2 Mathematical Model Setup
Basic performance calculation of the given engine output dataset involves evaluation of area under the P-V diagram (or torque), power output, and specific fuel consumption quantities whose formulations are shown subsequently.
Area under the P-V diagram (or torque):
Typically, for a four-stroke engine, there are four processes occurring in one complete engine cycle involving 720° of crankshaft rotation. These processes are Intake, Compression, Power and Exhaust. The Power phase or stage can be thought of as a combination of combustion, conversion of thermal energy into mechanical energy (or power) and expulsion of unused or waste heat from the system with respect to an ideal otto cycle for a similar engine configuration. Since, the processes involved are not essentially isobaric for the intake or isochoric for combustion and waste energy expulsion but perhaps isothermal for the compression and power strokes, it was decided to use the trapz function of the numpy module which performs integration along a particular axis by taking reference of the composite trapezoidal rule to calculate area under the P-V diagram. The trapz function in Python is syntaxed as shown below:
`text(numpy.trapz(y, x=None, dx=1.0, axis=- 1))`; where (1)
`y` is the input array to integrate, in this case pressure,
`x` is the array containing the sample points, in this case volume, corresponding to the `y` or pressure values, and
`dx` and `text(axis)` is the spacing between sample points when `x` is none with default value of 1 and the axis along which to integrate respectively.
Engine power output:
Let, Work done or torque or Area under the P-V diagram equal to W. Then,
`text(Engine power output = W * (cycles per second/1000))`; where (2)
`text(cycles per second)` for a four-stroke engine is equal to `((RPM)/2)/60` and resulting value of Engine power output is expressed in kW
Specific fuel consumption (sfc):
`text(sfc) = (text(fuel consumption rate)*text(cycles per second))/(text(Engine power output)*10^6) * 3.6 * 10^ 3`; where (3)
`text(fuel consumption rate)` is expressed in micro grams of fuel (per 1 stroke cycle), and
`text(sfc)` is expressed in `g/(kW*h)`
It should be noted that the values of pressure were converted from MPa to Pa in order to arrive at the values of the different performance metrics of the given engine output dataset in their respective units as shown in (Eq. 1), (Eq. 2) and (Eq. 3).
2.3 Post-Processing
In addition to the solution of the different performance metrics of the engine output dataset as shown in (Eq. 1), (Eq. 2) and (Eq. 3) based on the values of pressure, volume, RPM and fuel consumption rate, while also ensuring that the units are consistent, tabulate function from the same name, tabulate, module was made use of to print data of the column numbers and column names from the given document in a simplified table like structure from which the user could enter their preferred combination of column numbers as the input for representation along x-axis and y-axis of a particular plot. Title, x label and y label, along with their concerned units, were added for a better understanding of the graphical representation with the addition of the different performance metrics as a textbox if y-axis and x-axis were chosen as column numbers 2 and 8 respectively.
3. Results
3.1 Evaluating performance metrics of the given engine output dataset and plotting of P-V diagram with user input as column numbers 2 and 8 for y-axis and x-axis respectively
Fig.1 below captioned 'Plot of Pressure vs Volume' shows the values computed for pressure and volume from the given engine output dataset during one cycle and the different performance metrics of area under the P-V diagram (or torque), power output, and specific fuel consumption quantities using (Eq. 1), (Eq. 2) and (Eq. 3) respectively in the form of a textbox, along with the concerned labels and units. The different processes involved include firstly the Intake stage, wherein the intake valve is considered to be already open and the piston movement is creating volume as air is drawn inside the cylinder due to the vacuum effect, followed by Compression in which the piston moves in a direction to compress the fuel-air mixture leading to slight increase in pressure and temperature without heat being exchanged before combustion is initiated as soon as the fuel makes contact with the spark plug being ignited and it in this stage that the chamber becomes highly pressurized containing a lot of thermal energy leading to work done on the piston thereby moving it back to its location before compression resulting in an increase in the volume of the chamber, also identified as the Power stroke.
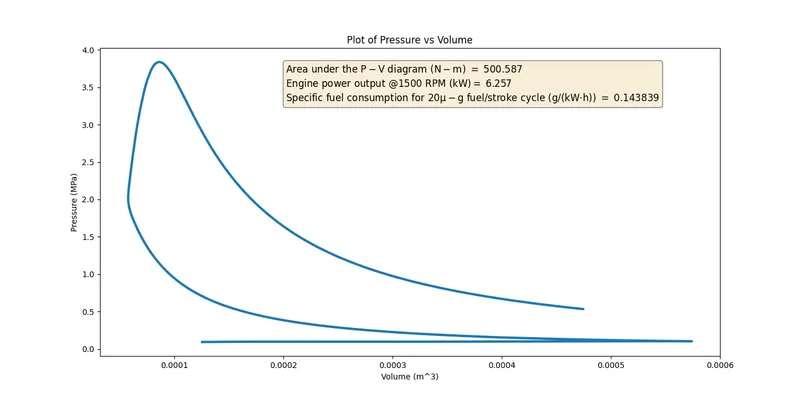
Fig. 1: Plot of Pressure vs Volume
4. Discussion
Compatibility check on a recognizable and valid CONVERGE output file performed using the splitext function of the os module ensured that only if the file contained the extension '.out' would the contents of the same be read. Moreover, the getline function of the linecache module served two benefits with one being able to access selective lines, in this case the first line from which 'CONVERGE' would be a keyword that the program would try to find, failing which the additional requirement for compatibility check would not be complete, and secondly, since the column numbers, column names and column units consistently occur on their respective lines, it meant that the information contained within it could be captured in separate arrays by only passing the line numbers and merging the first two column headers for presentation of data in tabular format would be simplified. Conditional statements in the Python script were also added whereby column numbers were taken as input as long as they were entries greater than zero and less than or equal to the range of total column numbers with due consideration on the entire dataset having equal number of column names and column numbers. Plots contained labels that were extracted from the file, along with their respective units, and the plot and its title were saved by the names of the respective columns as separate images in the form of 'Plot of (y-axis column number) vs (x-axis column number)'.
5. Conclusion
File parsing and its automation, and evaluation of performance metrics of the given engine output dataset such as area under the P-V diagram (or torque), power output, and specific fuel consumption quantities along with plotting of P-V diagram with user input as column numbers 2 and 8 for y-axis and x-axis respectively in Python using the Sublime Text source code editor was well understood with this programming exercise. It was realised that using different modules/libraries and functions can make the process of dealing with huge datasets quite simplified and structured enabling easier implementation of various post-processing or data visualisation techniques, including curve fitting, if required, to describe relationships between variables, and such examples of file parsing and automation are commonly employed across industries and organisations to improve productivity and scale up testing and/or prototyping of various products and services.
CODE:
Program to perform data analysis on an engine output dataset.
# Program to perform data analysis on an engine output dataset
# Author: Diptesh Pawa

# Modules/Libraries
import math
import matplotlib.pyplot as plt
import numpy as np
import os
import linecache
from tabulate import tabulate

# Initialisation
expected_file_extension = '.out'
line_count = 1
column_numbers = []
string_column_numbers = ""
column_number_index_not_a_number = []
column_names = []
string_column_names = ""
column_units = []
string_column_units = ""
merged_column_numbers_column_names = []
x_axis = -1
y_axis = -1
x_axis_input = 'Invalid'
y_axis_input = 'Invalid'
proceed = 'Y'
proceed_invalid_entry = 'Y'
proceed_2 = 'Y'
proceed_2_invalid_entry = 'Y'
proceed_2_invalid_entry_call_2 = 'Y'
variable_x_axis = []
variable_y_axis = []
RPM = 1500
fuel_consumption_rate = 20					# micro grams of fuel (per 1 stroke cycle)

# Function to ask and store user input for plotting variables as column numbers, and performing checks such as incorrect or out of bounds entries
def column_number_input(dirname,merged_column_numbers_column_names,x_axis,y_axis,x_axis_input,y_axis_input,string_column_numbers,proceed,proceed_invalid_entry):
	print(tabulate(merged_column_numbers_column_names, headers=["Column Numbers", "Column Names"]))
	while x_axis<0 or x_axis>len(string_column_numbers) or y_axis<0 or y_axis>len(string_column_numbers) or x_axis_input == 'Invalid' or y_axis_input == 'Invalid' and proceed =='Y':
		x_axis = int(input('Enter the column number for x_axis: '))
		y_axis = int(input("Enter the column number for y_axis: "))
		if x_axis<=0:
			print('Column number for x axis of the concerned plot cannot be zero or a negative number.')
			x_axis_input = 'Invalid'
			proceed_invalid_entry = 'Y'
		elif x_axis>len(string_column_numbers):
			print('Column number for x axis exceeds the range of ' + str(len(string_column_numbers)) + ' column numbers from the given dataset.')
			x_axis_input = 'Invalid'
			proceed_invalid_entry = 'Y'
		elif y_axis<=0:
			print('Column number for y axis of the concerned plot cannot be zero or a negative number.')
			y_axis_input = 'Invalid'
			proceed_invalid_entry = 'Y'
		elif y_axis>len(string_column_numbers):
			print('Column number for y axis exceeds the range of ' + str(len(string_column_numbers)) + ' column numbers from the given dataset.')
			y_axis_input = 'Invalid'
			proceed_invalid_entry = 'Y'
		else:
			print('Column numbers for x axis and y axis of the concerned plot are valid entries.')
			x_axis_input = 'Valid'
			y_axis_input = 'Valid'
			if not dirname:
				save_file_name = "Plot_of_" + string_column_names[y_axis-1] + "_" + string_column_names[x_axis-1] + ".png"
			else:
				save_file_name = dirname + "\\" + "Plot_of_" + string_column_names[y_axis-1] + "_" + string_column_names[x_axis-1] + ".png"
			proceed = 'N'

		if x_axis_input == 'Invalid' or y_axis_input == 'Invalid':
			proceed = input('Would you like to re-enter the column numbers again?(Y/N): ').upper()
			while proceed_invalid_entry == 'Y':
				if proceed == 'Y':
					proceed_invalid_entry = 'N'
				elif proceed == 'N':
					x_axis = y_axis = 1
					x_axis_input = y_axis_input = 'Terminate'
					save_file_name = 'None'
					proceed_invalid_entry = 'N'
				elif proceed != 'Y' or proceed != 'N':
					proceed = input('Please select from ''Y'' or ''N'' options if ''you wish to'' or ''do not wish to'' enter column numbers respectively, again: ').upper()

	return x_axis,y_axis,x_axis_input,y_axis_input,string_column_numbers,proceed,save_file_name

# File input
file = input("Enter the file name (path should be included for file not in the same directory as this program): ")

# Extraction of the file name, extension and directory
file_name = os.path.splitext(os.path.basename(file))[0]
file_extension = str(os.path.splitext(file)[1])
dirname = os.path.dirname(file)

# Conditions to check for valid CONVERGE output file following agreement of which the column numbers, column names and column units are extracted into separate string arrays
if file_extension != expected_file_extension:
	print(file_name + " is not recognized. Please provide a valid CONVERGE output file.")
else:
	with open(file) as myfile:
		keyword = [next(myfile) for x in range(1)]
	if 'CONVERGE' not in str(keyword):
		print(file_name + " was recognized but it may not be a valid CONVERGE output file.")
	else:
		print(file_name + " was recognized and is also a valid CONVERGE output file.")
		column_numbers.append(linecache.getline(file, 2))
		string_column_numbers = string_column_numbers.join(column_numbers)
		string_column_numbers = string_column_numbers.split()
		column_names.append(linecache.getline(file, 3))
		string_column_names = string_column_names.join(column_names)
		string_column_names = string_column_names.split()
		string_column_names.remove(string_column_names[0])
		column_units.append(linecache.getline(file, 4))
		string_column_units = string_column_units.join(column_units)
		string_column_units = string_column_units.split()
		string_column_units.remove(string_column_units[0])

		for col_num in string_column_numbers:
			if col_num.isnumeric() == False:
				column_number_index_not_a_number.append(string_column_numbers.index(col_num))

		for ele in sorted(column_number_index_not_a_number, reverse = True):
			del string_column_numbers[ele]

		# Conditions to check for equal number of column headers following agreement of which table is created by merging column numbers and column names
		if len(string_column_numbers) == len(string_column_names) and len(string_column_numbers) == len(string_column_units):
			for merge in range(0,len(string_column_numbers)):
				merged_column_numbers_column_names.append([string_column_numbers[merge],string_column_names[merge]])

			# Function call to ask for plotting relevant user inputs followed by checking for its validity
			x_axis,y_axis,x_axis_input,y_axis_input,string_column_numbers,proceed,save_file_name = column_number_input(dirname,merged_column_numbers_column_names,x_axis,y_axis,x_axis_input,y_axis_input,string_column_numbers,proceed,proceed_invalid_entry)

			while proceed_2 == 'Y':
				if proceed_2_invalid_entry_call_2 == 'Y':
					proceed_2_invalid_entry = 'Y'
				if x_axis_input == 'Valid' and y_axis_input == 'Valid':

					# File Parsing Starts
					for line in open(file):
						if '#' not in line:
							variable_x_axis.append(float(line.split()[x_axis-1]))
							variable_y_axis.append(float(line.split()[y_axis-1]))
						line_count = line_count+1

					# Plotting of x axis vs y axis columns
					fig, ax = plt.subplots(figsize=(14, 7))

					# Conditional statement for checking entry for Pressure vs Volume diagram along with engine performance calculations
					if x_axis == 8 and y_axis == 2:
						pressure = [i * pow(10,6) for i in variable_y_axis]
						cycles_per_second = (RPM/2)/60 # For a 4-stroke engine

						# Calculation of area under the P-V diagram
						W = float("{:.3f}".format(np.trapz(pressure,variable_x_axis)))

						# Calculation of engine power output
						P = float("{:.3f}".format((W * cycles_per_second)/1000))

						# Calculation of specific fuel consumption
						sfc = float("{:.6f}".format((((fuel_consumption_rate*pow(10,-6)*cycles_per_second)/P) * 3.6 * pow(10, 3))))

						textstr = '\n'.join((
					    r'$\mathrm{Area \ under \ the \ P-V \ diagram \ (N-m or J) \ = \ }%.3f$' % (W,),
						r'$\mathrm{Engine \ power \ output \ @1500 \ RPM \ (kW) = \ }%.3f$' % (P, ),
						r'$\mathrm{Specific \ fuel \ consumption \ for \ 20\mu-g \ fuel/stroke \ cycle \ (g/(kW⋅h)) \ = \ }%.6f$' % (sfc, )))
						props = dict(boxstyle='round', facecolor='wheat', alpha=0.5)
						ax.text(0.3, 0.95, textstr, transform=ax.transAxes, fontsize=12, verticalalignment='top', horizontalalignment='left', bbox=props)
					plt.plot(variable_x_axis,variable_y_axis, linewidth=3)
					plt.ylabel(string_column_names[y_axis-1] + " " + string_column_units[y_axis-1])
					plt.xlabel(string_column_names[x_axis-1] + " " + string_column_units[x_axis-1])
					plt.title("Plot of " + string_column_names[y_axis-1] + " vs " + string_column_names[x_axis-1])
					if not dirname:
						print('Plot of ' + string_column_names[y_axis-1] + ' vs ' + string_column_names[x_axis-1] + ' has been saved in the current directory containing the ' + file_name + file_extension + ' CONVERGE output file.')
					else:
						print('Plot of ' + string_column_names[y_axis-1] + ' vs ' + string_column_names[x_axis-1] + ' has been saved in the directory "' + dirname + '" containing the ' + file_name + file_extension + ' CONVERGE output file.')
					plt.savefig(save_file_name)
					plt.show()
					plt.close()
					variable_x_axis = []
					variable_y_axis = []
					line_count = 1
					proceed_2 = input('Would you like to create another plot by choosing different column numbers again?(Y/N): ').upper()
					while proceed_2_invalid_entry == 'Y':
						if proceed_2 == 'Y':
							x_axis = y_axis = -1
							x_axis_input = y_axis_input = 'Invalid'
							proceed = proceed_invalid_entry = 'Y'
							proceed_2_invalid_entry = 'N'
							x_axis,y_axis,x_axis_input,y_axis_input,string_column_numbers,proceed,save_file_name = column_number_input(dirname,merged_column_numbers_column_names,x_axis,y_axis,x_axis_input,y_axis_input,string_column_numbers,proceed,proceed_invalid_entry)
						elif proceed_2 == 'N':
							proceed_2_invalid_entry = 'N'
							print('The program has now been successfully terminated.')
						elif proceed_2 != 'Y' or proceed_2 != 'N':
							proceed_2 = input('Please select from ''Y'' or ''N'' options if ''you wish to'' or ''do not wish to'' create another plot by choosing different column numbers respectively, again: ').upper()

				elif x_axis == 1 and y_axis == 1 and proceed == 'N':
					proceed_2 = 'N'
					print('Due to invalid column number entries and the option selected as not to proceed any further, the program has now been terminated.')

		else:
			print('Please check for missing/additional column numbers, column names and/or column units.')