Week 6 - Data analysis
AIM: To perform data analysis on engine data using python.
OBJECTIVE: To perfrorm data analysis and
- Plot a graph between two quantities.
- Calculate the area under P-V diagram.
- Calculate the power output of an engine running at a speed of 1500RPM
- Calculate the specific fuel consumption for an engine which consumes 20 micrograms of fuel(per 1 stroke cycle)
THEORY:
Data analysis is defined as a process of cleaning, transforming, and modeling data to discover useful information for business decision-making. The purpose of Data Analysis is to extract useful information from data and taking the decision based upon the data analysis.
Data Analysis Process is nothing but gathering information by using a proper application or tool which allows you to explore the data and find a pattern in it. Based on that information and data, you can make decisions, or you can get ultimate conclusions.
Data Analysis consists of the following phases:
DATA REQUIREMENT GATHERING:
First of all, you have to think about why do you want to do this data analysis? All you need to find out the purpose or aim of doing the Analysis of data. You have to decide which type of data analysis you wanted to do! In this phase, you have to decide what to analyze and how to measure it, you have to understand why you are investigating and what measures you have to use to do this Analysis.
DATA COLLECTION:
After requirement gathering, you will get a clear idea about what things you have to measure and what should be your findings. Now it's time to collect your data based on requirements. Once you collect your data, remember that the collected data must be processed or organized for Analysis. As you collected data from various sources, you must have to keep a log with a collection date and source of the data.
DATA CLEANING:
Now whatever data is collected may not be useful or irrelevant to your aim of Analysis, hence it should be cleaned. The data which is collected may contain duplicate records, white spaces or errors. The data should be cleaned and error free. This phase must be done before Analysis because based on data cleaning, your output of Analysis will be closer to your expected outcome.
DATA ANALYSIS
Once the data is collected, cleaned, and processed, it is ready for Analysis. As you manipulate data, you may find you have the exact information you need, or you might need to collect more data. During this phase, you can use data analysis tools and software which will help you to understand, interpret, and derive conclusions based on the requirements.
DATA INTERPETATION
After analyzing your data, it's finally time to interpret your results. You can choose the way to express or communicate your data analysis either you can use simply in words or maybe a table or chart. Then use the results of your data analysis process to decide your best course of action.
DATA VISUALIZATION
Data visualization is very common in your day to day life; they often appear in the form of charts and graphs. In other words, data shown graphically so that it will be easier for the human brain to understand and process it. Data visualization often used to discover unknown facts and trends. By observing relationships and comparing datasets, you can find a way to find out meaningful information.
INPUTS: Link to data file.
STEPS:
- Firstly we will import the basic modules which will be usefull for this problem.
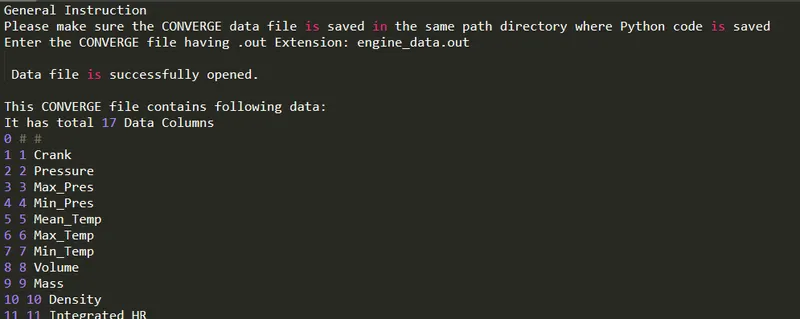
- Printing general instructions and then asking for input file from the user.
- In compatibility check if the file exists data will be opened successfully else it will show us the error.
- We will give line ciunt for counting the number of lines for the file.
- After that we will split the different parameters from the file.
- Now we will get input from the user for the x and the y parameters for which we want to parse information and the other things.
- Defining empty arrays so that data could be stored in them.
- These variables will get append so through the file and then will be stored in the above empty arrays.
- For rthe plotting we will givve labels , title and will save them in the predefined directory.
- Now for x=8 and y=2 we will calculate the area under curve and the work done,power,specific fuel consumption by using the respective formulas.
- All this will be done autmatically just by giving the inputs which the program will require.
CODE:
import math
import matplotlib.pyplot as plt
import numpy as np
from numpy import trapz

print('General Instruction')
print('Please make sure the CONVERGE data file is saved in the same path directory where Python code is saved')

file_name= input('Enter the CONVERGE file having .out Extension: ')

#Compatibility check
try:
	data=open(file_name,'r')
	print('\n Data file is successfully opened.')

except FileNOtFoundError:
	print('\n Please Enter a Valid File name.\n')

count=1

for line in data:
	if count==2:
		Parameter=line.split()
		Columns=len(Parameter)
		print('\nThis CONVERGE file contains following data:')
		print('It has total %d Data Columns' %(Columns-1))

		for Line in data:
			if count==3:
				Unit=Line.split()
			break

		for C_no in range(0,Columns):
			print(C_no,line.split()[C_no],Line.split()[C_no])
		break
	count=count+1

print('\nChoose any two parameter from above.')
print('Enter a number corresponding to parameter 1 to 18.\n')
x=int(input('Enter X-axis parameter : '))
y=int(input('Enter Y-axis parameter : '))

x_data=[]
y_data=[]

count=1
for line in open(file_name,'r'):

	if count==3:
		X_label=line.split()[x]
		Y_label=line.split()[y]

		if count==4:
			x_label=line.split()[x]+line.split()[x]
			y_label=line.split()[y]+line.split()[y]

		if '#' not in line:
			x_data.append(float(line.split()[x-1]))
			y_data.append(float(line.split()[y-1]))


		count=count+1
filename= Y_label + ' vs ' + X_label + '.png'

#PLOTTING THE GRAPHS

plt.figure()
plt.plot(x_data,y_data)
plt.xlabel(x_label)
plt.ylabel(y_label)
plt.title(Y_label + ' vs ' + X_label)
plt.savefig(filename)
plt.show()

if x==8 and y==2:
	RPM=1500
	Area= np.trapz(y_data,x_data)
	Workdone= Area*1000
	Power= 2*math.pi*RPM*Workdone/60
	Fuel_per_stroke=20*1e-6
	Fuel_per_sec= Fuel_per_stroke*RPM*(0.5/60)
	Fuel_per_hour= Fuel_per_sec*3600
	BSFC= Fuel_per_hour/Power

	print('Area under the P-V diagram(Workdone) :' ,Workdone,'KJ')
	print('Power output of this Engine:', Power,'KW')
	print('Specific Fuel Consumption :', BSFC, 'g/KWh')
RESULTS:
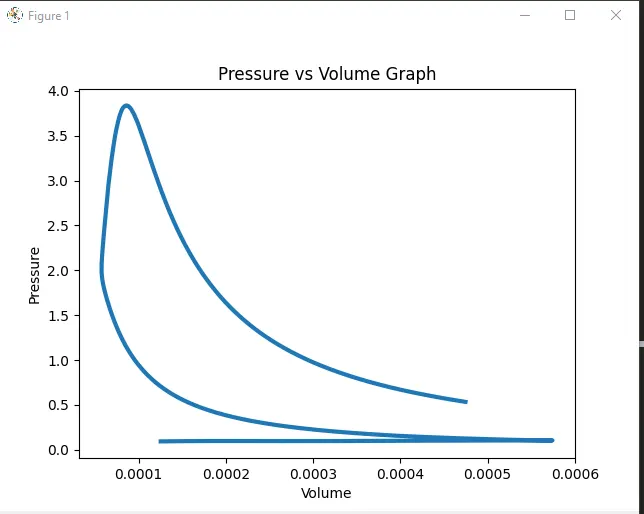
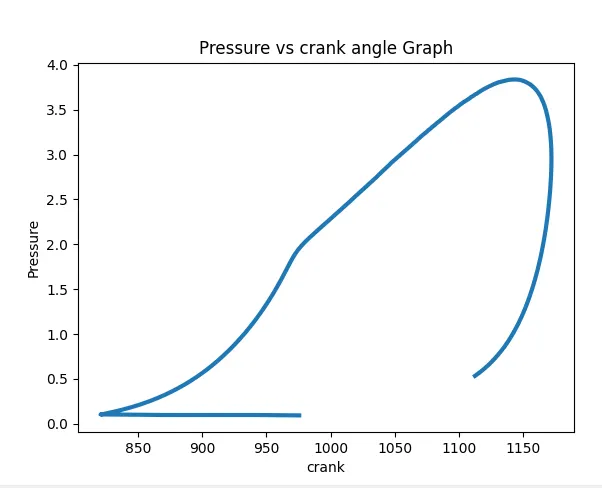
All these graphs shows us the avriation with the input parameters which we provide.
OUTPUT:
Area under the PV diagram, Workdone=0.5005866274680075 kJ
Power output is = 78.631963566745265 KW
Specific fuel consumption= 0.01445726745265 g/KWh