Week 4.1 - Genetic Algorithm
AIM: Finding the global maxima of a stalagmite function and optimizing it using the MATLAB programming..
OBJECTIVES:
- Write a code in MATLAB to optimize the stalagmite function and find the global maxima of the function.
- Clearly explain the concept of genetic algorithm in your own words and also explain the syntax for ga in MATLAB in the report
- Make sure that code gives the same output
- Plot graph for all 3 studies and for Fmaximum vs no of iterations.
THEORY: A genetic algorithm (GA) is a method for solving both constrained and unconstrained optimization problems based on natural selection process that mimics biological evolution. It is a search based optimisation technique based on the principle of genetics and natural selection. It is frequently used to find the optimum solution or near optimal satisfactory solution.
The algorithm repeatedly modifies a population of individual solutions. At each step the genetic algorithm randomly selects individuals from current population and uses them as parents to produce the children for next generation. Over successive generations, the population evolves toward an optimal solution.
The genetic algorithm differs from a classical, derivative based, optimisation algorithm in two ways as follows in the table-
| Classical Algorithm | Genetic Algorithm |
|---|---|
| Generates a single point at each iteration. The sequence of points approaches an optimal solution. | Generates a population of points at each iteration. The best point in the population approaches an optimal solution. |
| Selects the next point in the sequence by a deterministic computation. | Selects the next population by computation which uses random number generators. |
The GA uses three main types of rules at each step to create the next generation from current population-
Selection rules select the individuals, called parents, that contributes to population at next generation.
Crossover rules combines two parents to form children for the next generation.
Mutation rules apply random changes to individual parents to form children/
SYNTAX OF GENETIC ALGORITHM:
x = ga(fun,nvars,A,b,Aeq,beq,lb,ub)
It defines a set of lower and upper bounds on the design variables, x, so that a solution is found in the range lb ≤ x ≤ ub. (Set Aeq=[] and beq=[] if no linear equalities exist.)
[x,fval] = ga(___), for any previous input arguments, also returns fval, the value of the fitness function at x.%DEFINING THE FUNCTION
function [F] = stalagmite(inputs)
% GIVING THE INPUT VARIABLES
x=inputs(1);
y=inputs(2);
% BREAKING THE MAIN FUNCTION CODE
term1= (sin((5.1*pi.*x)+0.5)).^6;
term2= exp((-4)*log(2)*((x-0.0667).^2)/0.64);
term3= (sin((5.1*pi.*y)+0.5)).^6;
term4= exp((-4)*log(2)*((y-0.0667).^2)/0.64);
% FINAL FUNCTION
F= -(term1.*term2.*term3.*term4);
end
clear all
close all
clc

%Defining our search space

x=linspace(0,1,100);
y=linspace(0,1,100);

%Creating 2d mesh

[xx yy]= meshgrid(x,y);

% Evaluating the stalagmite function

for i=1:length(xx)
    for j=1:length(yy)

        inputs(1)=xx(i,j);
        inputs(2)=yy(i,j);
        F(i,j)= stalagmite(inputs);
    end
end

num=100;
tic
%Case 1 Stastical behaviour

for i=1:num
    [inputs,Fout(i)]= ga(@stalagmite,2);
    xout(i)=inputs(1);
    yout(i)=inputs(2);
end
% PLOTTING THE GRAPH

case1_time=toc;
figure(1)
subplot(2,1,1)
surfc(xx,yy,-F)
shading interp
hold on
plot3(xout,yout,-Fout,'marker','*','markersize',5,'markerfacecolor','r')
title('Unbounded Inputs')
subplot(2,1,2)
plot(-Fout)
xlabel('Iterations')
ylabel('Function Maximum')
tic

%CASE 2 STASTICAL BEHAVIOUR WITH UPPER & LOWER BOUND

for i=1:num

    [inputs,Fout(i)]=ga(@stalagmite,2,[],[],[],[],[0;0],[0.3;0.3],[],[]);
    xout(i)=inputs(1);
    yout(i)=inputs(2);
end

% PLOTTING THE GRAPH

figure(2)
subplot(2,1,1)
surfc(x,y,-F)
shading interp
hold on
plot3(xout,yout,-Fout,'marker','*','markersize',5,'markerfacecolor','g')
title('Bounded Inputs')
subplot(2,1,2)
plot(-Fout)
xlabel('Iterations')
ylabel('Function Maximum')

% Case 3 Increasing Iterations

options=optimoptions('ga');
options=optimoptions(options,'populationsize',200);

for i= 1:num
    [inputs,Fout(i)]=ga(@stalagmite,2,[],[],[],[],[0;0],[1;1],[],[],options);
    xout(i)=inputs(1);
    yout(i)=inputs(2);
end

%PLOTTING THE GRAPH

figure(3)
subplot(2,1,1)
surfc(x,y,-F)
shading interp
hold on
plot3(xout,yout,-Fout,'marker','*','markersize',5,'markerfacecolor','b')
title('Bounded Inputs with Increased Population')
subplot(2,1,2)
plot(-Fout)
xlabel('Iterations')
ylabel('Function maximum')
STEPS TAKEN IN PROGRAMMING:
- Firstly we write the code to define the stalagmite function where we broke it into 4 terms for easy calculation.
- After that we write the main code where we define two inputs x and y by naming it as our search space bith of which are one dimensional arrays containing 100 elements each.
- Now by using the meshgrid command we created a 2d arrays for x and y.
- Now by using the for loop we will enter the 2d array valuews into the stalagmite function. Here we encountered a problem that everytime we executed the code it gives us the new results so to overcome that problem we introduced a new for loop. We then input hese values in genetic algorithm where (ga) function is used.
- After this we need to improve our genetic algorithm, for that we took three cases to optimise the function so that we can exactly find global maxima for given function.
- In case 1 we evaluate all possible global maxima for all the iterations using a loop. we made two plots in one figure using subplot command. 'surfc' command is used for x and y graph and for function max vs itertions we used simple plot command.
- In casse 2 we put an upper and lower bound on ga function and agian plotted two plots.
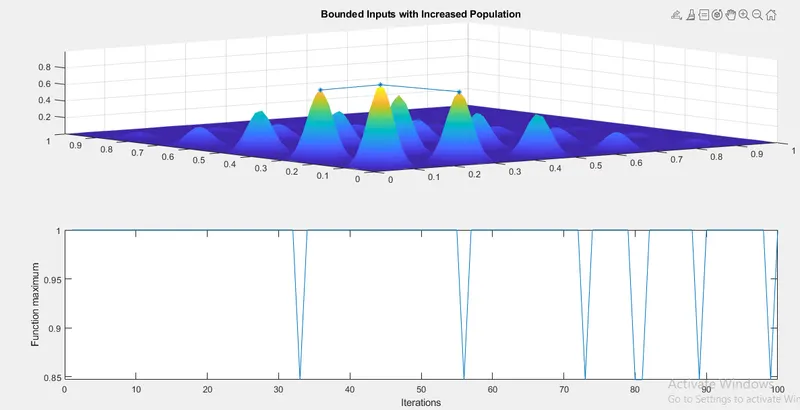
- In case 3 we have increased the number of iterations because in GA successive iterationss, the population evolves toward an optimal solution i.e more the iterations more optimal solution will be and the same commands for plotting were used.
RESULTS:
CASE 1-
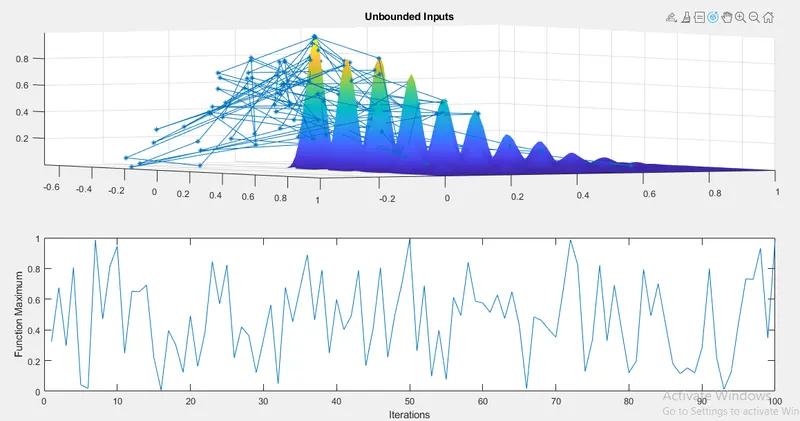
We can see here that we have solutions all over the graph so due to that we can not find our optimal solution easily.
CASE 2-
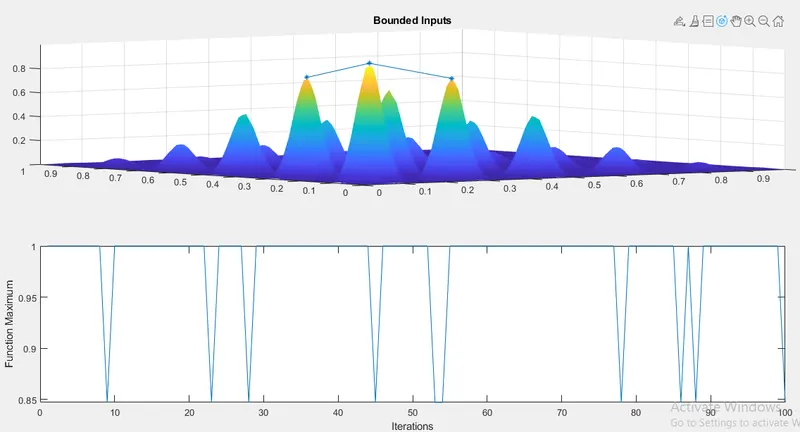
In this case we can see that the values are in betwwn 0.85 to 1 which is not a much difference so this is better than the previous case.
CASE 3-
ERRORS :
The main error which i faced was in the graph that it was not proper so to overcome that error i tried to putting (-) sign in all F values and in main function F.
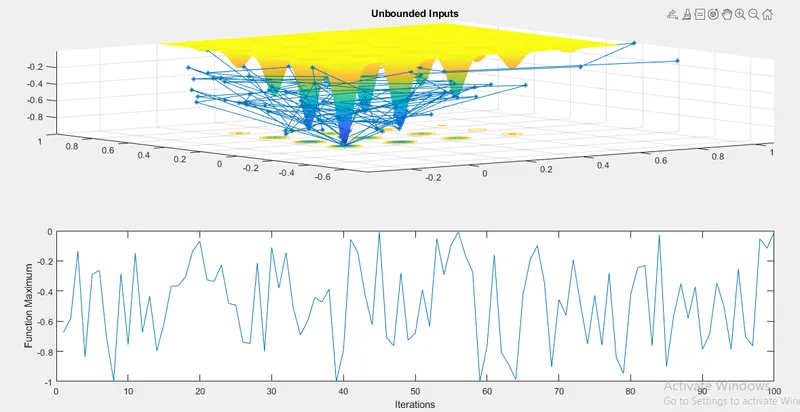
same erroer happened in all the three cases and was resolved.
REFERENCES:
https://in.mathworks.com/help/gads/ga.html
https://towardsdatascience.com/introduction-to-genetic-algorithms-including-example-code-e396e98d8bf3