Week 6 - Data analysis
Objective:
1. The values should be extracted as separate images for each parameter. The labels for the plot generated between the parameters should not be typed manually.
2. The code should check the compatibility of the data file i.e. if it is a converge data file then it should proceed with the calculation of the engine parameters or the calculation should not happen.
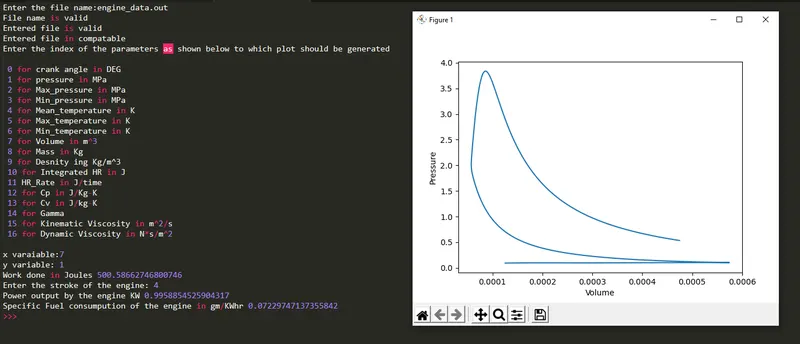
3. Calculation of the engine parameters should such as work done, power, SFC by calculating the area under the PV diagram.
Introduction:
The given data file is extracted from the engine simulation using converge software tool. The data file consists of the parameters such as crank angle, pressure, volume, Max pressure, min pressure, etc.
Data analysis is done to inspect the given data, clean them and extract the required data in order to obtain useful information, draw conclusions, and decisions making.
Engine Calculations:
1. Area under PV diagram is calculated using trapz command in python.
From the area obtained work done is calculated because area under PV diagram is the work done
2. With Workdone known the power of the engine is calculated by multiplying the RPM for the given no. of strokes.
3. Specific fuel consumption is calculated for the given mass of the fuel that is 20 micrograms
Code:
#Import required modules
import math
import matplotlib.pyplot as plt
import numpy as np

#Entering the name of the data file
name = input('Enter the file name:' )

#if loop is to check if the data file has the right extension
if name.find('out')>0:
	print('File name is valid')
else:
	print('File in invalid')

#Counter variable to store the variables and its values.
ct = 1
#Empty Array to store the values and paramters name
values = []
parameters = []

#For loop to check the compatibility of data file by finding the converge word in the data.
for line in open(name):
	if '#' in line:
		if ct == 1:
			compatibility = line
			comp = compatibility.find("CONVERGE")
			if comp>0:
				print('Entered file is valid')
	# If loop to store only the parameters name in the parameter variable
	if ct == 3:
		parameters = (line.split( ))
	# If loop to store the values of the parameters
	if '#' not in line:
		values.append(line.split())

	#Increament of the counter variable
	ct = ct+1

# If loop to check if the imported data file is converge compatibile or not
if comp == -1:
	print('Enter a valid converge file')
else:
	print('Entered file in compatable')

	# Transposing the matrix so that it becomes easy to store the values of each parameter in their respective domain.
	v = np.transpose(values)
	# Converting the values into interger data type in order to use them in the further calculation
	v = v.astype(float)

	# User input for the paramters to be plotted.
	print("Enter the index of the parameters as shown below to which plot should be generated\n")
	print(" 0 for crank angle in DEG\n 1 for pressure in MPa\n 2 for Max_pressure in MPa\n 3 for Min_pressure in MPa\n 4 for Mean_temperature in K\n 5 for Max_temperature in K\n 6 for Min_temperature in K\n 7 for Volume in m^3\n 8 for Mass in Kg\n 9 for Desnity ing Kg/m^3\n 10 for Integrated HR in J\n 11 HR_Rate in J/time\n 12 for Cp in J/Kg-K\n 13 for Cv in J/kg-K\n 14 for Gamma\n 15 for Kinematic Viscosity in m^2/s\n 16 for Dynamic Viscosity in N*s/m^2 \n")
	# User input line
	x = int(input("x varaiable:"))
	y = int(input("y variable: "))
	# Graph plotted between the chosen parameters by the user
	plt.plot(v[x],v[y])
	plt.xlabel(parameters[x+1])
	plt.ylabel(parameters[y+1])
	plt.savefig('%s Vs %s' %(parameters[y+1],parameters[x+1]))
	plt.show()

	#engine calculations
	area = np.trapz(v[1],v[7])
	Workdone = area*10e5
	print('Work done in Joules', Workdone)

	# User input value for the stroke
	stroke = int(input("Enter the stroke of the engine: "))
	rpm = 1500

	# If loop to calculate the RPS based on the no. of stroke of the engine.
	if stroke == 4:
		n = rpm/(2*math.pi*2*60)
	else:
		n = rpm/(math.pi*2*60)


	Power = Workdone*(n/1000)
	print('Power output by the engine KW', Power)
	m = 20e-6
	Sfc = m*3600/Power
	print('Specific Fuel consumpution of the engine in gm/KWhr', Sfc)
Explanation:
1. Import the required modules as math, matplotlib.pyplot, numpy module.
2. User has to input the name of the file with an extension of .OUT. Otherwise the code shows an error saying the entered file is not valid.
3. Then a for loop is created to check the compatibility of the file by finding the CONVERGE word in the data. If found the code proceeds to the calculation of the engine parameters and otherwise, the code terminates.
4. Once the compatibility check is done and it is successful the values of the parameters are extracted line by line using the for loop and stored in the row vise for each parameter so that extraction could be easier.
5. The user is asked to input the parameters to which the plot has to show.
6. Plot is created for the chosen input parameter by the user.
7. Engine parameter calculations are done based on the area under the PV diagram.
Output