Week 6 - Data analysis
Aim:Parsing the engine_data.out file and writing a code for automated plotting.
Objective:
- Your script should take column numbers as the input and plot the respective columns as separate images.
- Each file should be saved by the name of the column.
- The plot labels should be extracted from the file. If, I request for a plot between column 1 (crank angle) and column 8(volume), then the label information should automatically be extracted and must appear as labels in the plots. THIS SHOULD NOT BE DONE MANUALLY.
- compatability check.
- Basic performance calculation.
Introduction:
The file parsing is used extremly for data analysis in which we plot our calculated values which we get from some other software to visualize whether the data is correct and also we can use those values for performance calculation in our case.
We will be using python program for parsing a file line by line in read mode and selecting required data inputed by the user to get its plot save a plot and also to calculate some performance parameters.
Performance calculation:
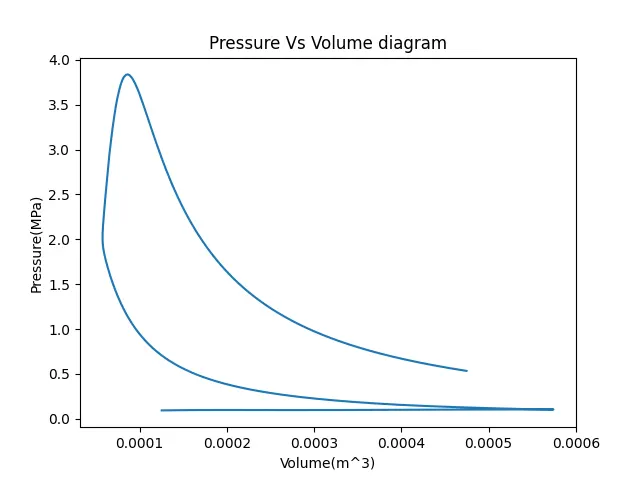
We should validate results using performance calculation here we will use pressure vs volume diagram to calculate area under the curve, power output basically brake power(power at crankshaft), and specific fuel consumption.
To calculate area under the curve which is work done we have two methods in python the one is trapezium rule and the other is simpshon's rule.
I will use simpshon's rule because of its more accurate results.
The syntax for simphson's rule is given as:
float(simps(par1,par2))
If the process is isochoric then the area under the curve is always 0.
Power output:
Calculate the power output of this engine. Assume that RPM is 1500
The formula is given as:
power_output = (area*rpm*10^6)/(2*60)
Specific fuel consumption:
This engine consumed 20 micro grams of fuel (per 1 stroke cycle). Calculate its specific fuel consumption.
We have rpm so the first step is to convert rpm strokes/hr = rpm*60/2
60 to convert minutes to hr, and 2 for 4 stroke engine,In 4 stroke engine 2cycle are needed to complete 1 stroke now we have strokes/hr
The value for fuel consumed is given as 20grams per strokes.when we multiply milligram/strokes*strokes/hr we get mg/hr.
Now if we divide this with power in kW and multiply by *10-6 we get answer in g/kWhr
fuel_consumption = (fuel_consumed*rpm*60)/2
sfc = fuel_consumption*1000/power (g/KWhr)
Compatibility test:
This test provides a pop up in pane if the input file entered is not present or there is no input file with such a name.
We will use try,except,else command for this, this command helps us to create our own syntax errors which displays error which provide a easy description for particular input.
In try statement we provide file_name and the mode in which it should be opened, In except statement we provide a print statement such that if file name is wrongly typed the error sentence appears.
The else statement get executed only if try statement is true so all the main code lies in else statement.
Python code for parsing a file:
import matplotlib.pyplot as plt
import numpy as np
import math
from scipy.integrate import simps


#heading
print('file parsing')
print('Save the file in same directory as that of program')


fname = input('enter tha valid name of .out file = ')
#compatibility test
try:
	f = open(fname,'r')
	print('The file successfully openened in read mode.')

except Exception:
	print('File not recognized. Please provide a valid CONVERGE output file')


else:
	column_name = []
	column_units = []

	line_count = 1
	for line in open('engine_data.out'):
		if '#' not in line:
			line_count = line_count + 1

		else:
			line_count = line_count + 1
			if line_count==3:
				par = line.split()
				columns = len(par)
			elif line_count == 4:
				column_name = line.split()
			elif line_count == 5:
				column_units = line.split()

	for i in range(1,(columns-1)):
		print(i,column_name[i],column_units[i])


	nx = int(input('Enter the number from 1 to 17 for x-axis data = '))
	ny = int(input('Enter the number from 1 to 17 for y-axis data = '))


	x_array = []
	y_array = []

	for line in open('engine_data.out'):
		if '#' not in line:
			x_array.append(float(line.split()[nx-1]))
			y_array.append(float(line.split()[ny-1]))

	#plotting
	plt.figure(1)
	plt.plot(y_array,x_array)
	plt.xlabel(column_name[ny]+column_units[ny])
	plt.ylabel(column_name[nx]+column_units[nx])
	plt.title(column_name[nx]+' '+'Vs'+' '+ column_name[ny]+' '+'diagram')
	plt.savefig(column_name[nx]+'_'+'Vs'+'_'+ column_name[ny]+'.png')
	plt.show()

	pressure = []
	volume = []
	for line in open('engine_data.out'):
		if '#' not in line:
			pressure.append(float(line.split()[1]))
			volume.append(float(line.split()[7]))
	#area under a curve
	area = float(simps(pressure,volume))
	print('Area under the curve is = ',area)

	power = (area*1500e6)/(2*60)
	print('Power output of the engine is = ',power,'W')

	#conversion of rpm to strokes/hr = rpm*60/2
	#60 to convert minutes to hr and 2 for 4 stroke engine,In 4 stroke engine 2cycle are needed to complete 1 stroke
	#given 20 micro grams of fuel
	fuel_consumption = (20e-6*1500*60)/2
	sfc = fuel_consumption*1000/power
	print('Specific fuel consumption =',sfc,'g/KWhr')

	#plotting
	plt.figure(2)
	plt.plot(volume,pressure)
	plt.xlabel('volume(m^3)')
	plt.ylabel('pressure(MPa)')
	plt.title('P-V diagram for 4 stroke engine')
	plt.savefig('PV_diagram.png')
	plt.show()
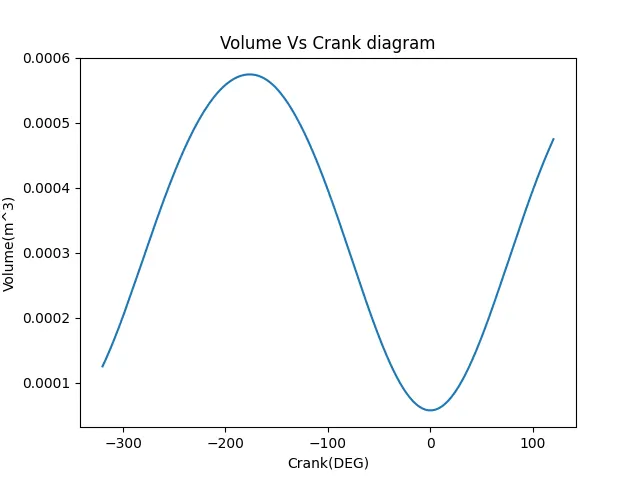
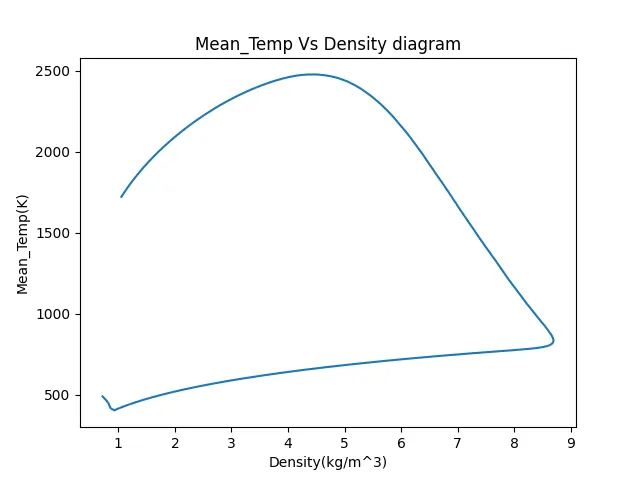
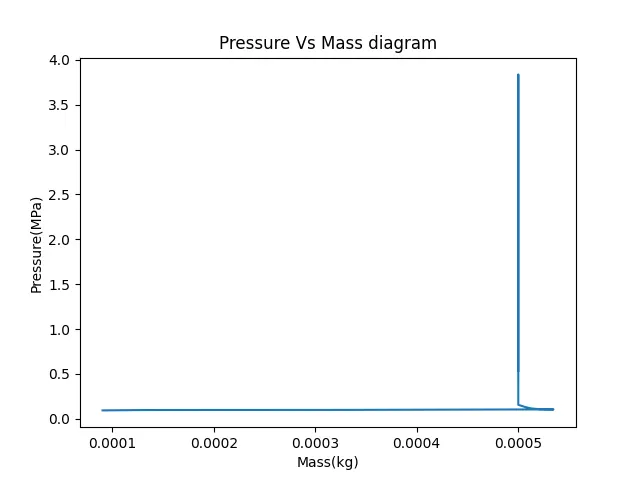
AUTOMATICALLY GENERATED OUTPUT PLOTS:
PLOT1:
PLOT2:
PLOT3:
Pressure vs volume plot for engine data:
Compatibility check:
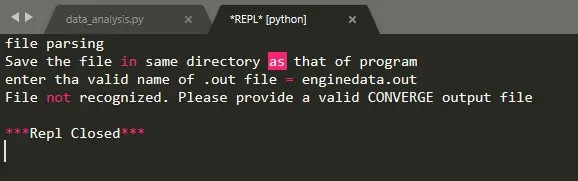
If invalid file is given as output the code returns file not recognized and end further compilation.
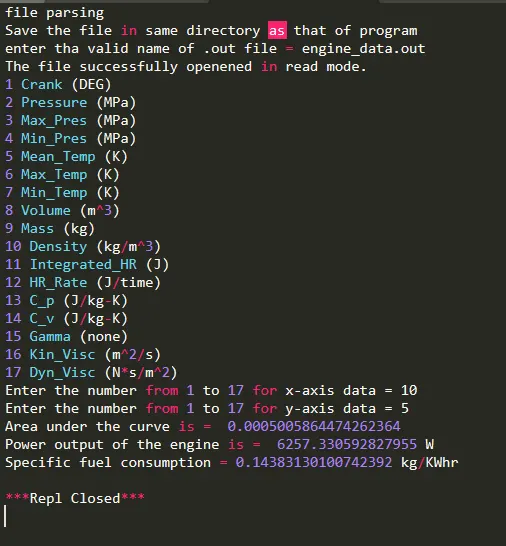
The data file column parameters name for user friendly environment.
And the image also display the performance calculation outputs.