Week 6 - Data analysis
1.AIM: to analyse the data given
2.OBJECTIVES OF THE PROJECT:
- Calculate the area under the P-V diagram. P is in column 2 and V is in column 8.
- Calculate the power output of this engine. Assume that RPM is 1500
- This engine consumed 20 micro grams of fuel (per 1 stroke cycle). Calculate its specific fuel consumption.
3.BODY OF THE CONTENT:
firstly we import the basic modules required, then we check the compatibility using the try & except statement.
we then create a blank data array and use a for loop to read each line, we then split the data and store it in the empty array.
the data obtained is columnwise, transpose function is used to make it row-wise.
#in this program we check the compatibility and plotting for different parametres
import math
import matplotlib.pyplot as plt
import numpy as np
import pandas as pd

#checking the compatibility
try:
	file=open('engine_data.out')
except:
	print("File not recognized. Please provide a valid CONVERGE output file")

#reading the data file
data=[]
for line in file:
	if '#' not in line:		#to avoid the rows with '#'symbol
		a=line.split()
		data.append(a)

#making rows into column
data_t=np.transpose(data)
data_t=data_t.astype(float)		 # (because they are floating numbers)
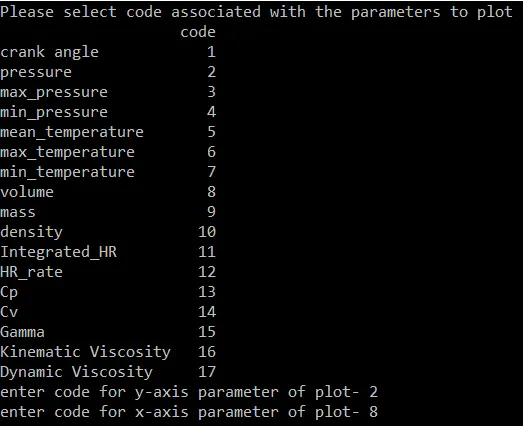
As script is created which contains the parameters and their unique code for use input. pandas module is used to create the tabular data showing each parameter with its unique code.
input function is used to provide input to script, which will ask the user for the code to plot x-y graph.
we then plot the values, label then and name the graph and save then according to their names as png.
print('Please select code associated with the parameters to plot')
para=['crank angle','pressure','max_pressure','min_pressure','mean_temperature','max_temperature','min_temperature','volume','mass','density','Integrated_HR','HR_rate','Cp','Cv','Gamma','Kinematic Viscosity','Dynamic Viscosity']
code=['1','2','3','4','5','6','7','8','9','10','11','12','13','14','15','16','17']

code_guide={'Parameters':para,'code':code}
df=pd.DataFrame(code_guide,index=para,columns=['code'])
print(df)

#providing the inputs for plotting
y=int(input('enter code for y-axis parameter of plot- '))
x=int(input('enter code for x-axis parameter of plot- '))

#plotting results
plt.plot(data_t[x-1,:],data_t[y-1,:],color='purple',linewidth=1 )
plt.xlabel(para[x-1])
plt.ylabel(para[y-1])
plt.title(para[y-1]+' v/s '+para[x-1])
plt.savefig(para[y-1]+' vs '+para[x-1]+'.png')
plt.show()
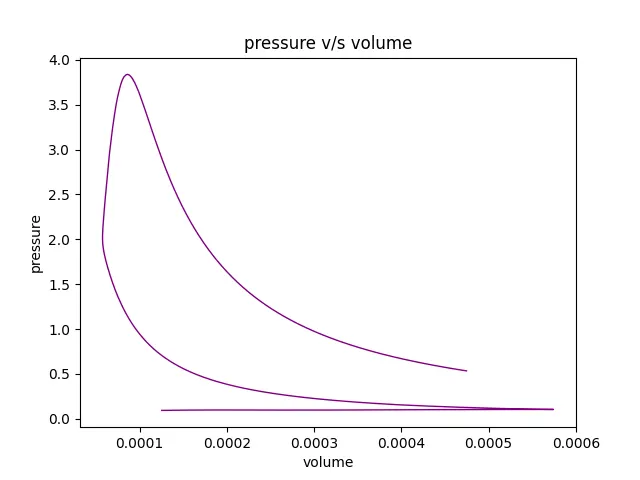
the results and graph for PV graph is-
we then create another program to solve the numerical problems.
we find the area by using the trapezoidal rule which is available in the numpy module.
we then calculate power output and specific fuel consumption.
power = (work done in J x speed in rps) /1000 KW Specific fuel consuption = (fuel consumed / power) x 3600 gm/KW-Hr
#in this program we perforn numerical calculations
import math
import matplotlib.pyplot as plt
import numpy as np
import pandas as pd

#checking compatibility
try:
	file=open('engine_data.out')
except:
	print("File not recognized. Please provide a valid CONVERGE output file")
	sys.exit()

#reading the data file
data=[]
for line in file:
	if '#' not in line:
		a=line.split()
		data.append(a)

#making rows into column
data_t=np.transpose(data)
data_t=data_t.astype(float)

# Area under the curve
volume=[]
pressure=[]

for k in open('engine_data.out','r'):
	if '#' not in k:
		pressure.append(float(k.split()[1]))
		volume.append(float(k.split()[7]))

#area under the pv diagram
# Area under PV curve by trapezoidal rule
area = np.trapz(pressure,volume)*1000	#area = work done
print('The total area or work under the graph is',(area),'KJ')

#power output of the engine
rpm=1500
rps=rpm/60
power = area*rps
print('The power output of the engine is',power,'KW')

# Calculating specific fuel consumption
fuel_mass=20*pow(10,-6)
sfc=(fuel_mass/power)*3600*1000
print('The specific fuel consumption is ',sfc,'gm/KWhr')
the results are-

4.CONCLUSION:
hence we are able to plot and solve problems for a large data file using python.