Basics of Probability and Statistics Week 1 Challenge
- Why there is a difference in the formula of variance for population and sample
ANS-A population is defined as all members (e.g. occurrences, prices, annual returns) of a specified group. Population is the whole group.A sample is a part of a population that is used to describe the characteristics (e.g. mean or standard deviation) of the whole population. The size of a sample can be less than 1%, or 10%, or 60% of the population, but it is never the whole population.
Population Variance: `σ ^2 = ∑ ( X i − μ i )^ 2/ N`
Sample Variance: `s^2 = ∑ ( X i − μ i )^ 2 /(N − 1)`
There is only one little difference in the calculation of variance and it is at the very end of it. For both population and sample variance, I calculate the mean, then the deviations from the mean, and then I square all the deviations. I sum all the squared deviations up. So far it was the same for both population and sample variance.
When I calculate population variance, I then divide the sum of squared deviations from the mean by the number of items in the population
When I calculate sample variance, I divide it by the number of items in the sample less one.
As a result, the calculated sample variance (and therefore also the standard deviation) will be slightly higher than if we would have used the population variance formula. The purpose of this little difference it to get a better and unbiased estimate of the population‘s variance (by dividing by the sample size lowered by one, we compensate for the fact that we are working only with a sample rather than with the whole population).
- Difference between stratified and clustered sampling
ANS-Stratified random sampling is a sampling method in which the population is first divided into strata (A stratum is a homogeneous subset of the population). Then a simple random sample is taken from each stratum. The results from each strata combined constitute the sample. Following are examples of possible strata in populations
• For a population of a state, male and female strata
• For people working in a city, resident and non-resident strata
Cluster random sampling is a sampling method in which the population is first divided into clusters (A cluster is a heterogeneous subset of the population). Then a simple random sample of clusters is taken. All the members of the selected clusters together constitute the sample. This method is often used when natural groupings are obvious and available.
For examples, consider a survey for evaluating the involvement of high school students in extracurricular activities. Rather than selecting random students from the student population, selecting a class as the samples for the survey is cluster sampling. Then every member of the class is interviewed. In this case, classes are clusters of the student population.
• In stratified sampling, the population is divided into homogeneous groups called strata, using an attribute of the samples. Then members from each stratum are selected, and the number of samples taken from those strata is proportional to the presence of the strata within the population.
• In cluster sampling, the population is grouped into clusters, predominantly based on location, and then a cluster is selected at random.
• In cluster sampling, a cluster is selected at random, whereas in stratified sampling members are selected at random.
• In stratified sampling, each group used (strata) include homogenous members while, in cluster sampling, a cluster is heterogeneous.
• Stratified sampling is slower while cluster sampling is relatively faster.
• Stratified samples have less error due to factoring in the presence of each group within the population and adapting the methods to obtain a better estimation.
• Cluster sampling has inherent higher percentage of error.
- How many different samples can be created out of population of size n
ANS-From a population of size, 'n' we can create 'n' number of samples. This is because if we have a set of data that has 'n' values, we can divide those values in to groups called samples. The smallest size each group (sample) can take is 1 and the highest it can be is n-1.
This is because in statistics and probability, a population is defined a complete group of members in a data set whereas a sample is defined as an incomplete group or a percentage of the population data. A sample can range anywhere in size from as small as 1% of the population but it can never be 100%, otherwise the sample size would be equal to the population size. So any sample size that is less than the population size can be taken as a sample data, and therefore, the highest value this can take is one less than the population size. Hence, the maximum size a sample can take is 'n-1'.
- What is the probability of drawing 2 jacks from a pack of card
ANS-since there are a total of 4 jacks in a deck of 52, the probability of the getting the first jack is 4:52 = 4/52 = 1/13
Now, after the first jack is removed, there are only 3 jacks left in a deck of 51 so the probability of the second card drawn is: 3:51 = 3/51 = 1/17
Therefore the probability is:
1/13 * 1/17 = 0.0045
- What is the probability that both the numbers on dice are same while rolling 2 diceANS-When two dice are thrown simultaneously, thus number of event can be 62 = 36 because each die has 1 to 6 number on its faces. Then the possible outcomes are shown in the below table.
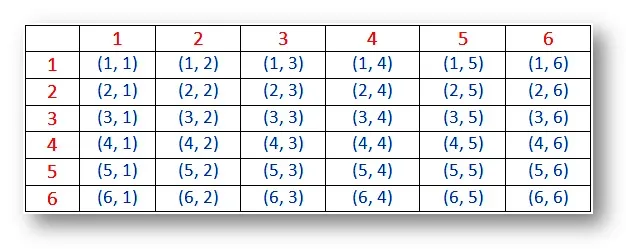 The outcomes (1, 1), (2, 2), (3, 3), (4, 4), (5, 5) and (6, 6) are called doublets.So the probabiliy of getting the same number on both dice = 1/36 x 6 = 6/36 = 1/6
- Why standard deviation when variance can measure the dispersion in data
ANS-Variance is defined and calculated as the average squared deviation from the mean. Standard deviation is calculated as the square root of variance or in full definition, standard deviation is the square root of the average squared deviation from the mean.
Calculation of variance
These are the four steps needed for calculating variance and you have to start from the end of the definition:
- Mean in general is the central value of a data set. The best known and most usual way of calculating mean is the arithmetic average: you sum all the numbers up and then divide the sum by the count of numbers used. For example arithmetic average of the numbers 10, 20, 30, 40, and 50 is 10+20+30+40+50 (which is 150) divided by the count of numbers (which is 5). Arithmetic average of 10, 20, 30, 40, and 50 is 30.
-
In the next step we need to calculate the deviations from the mean. For each number in the set, we simply subtract the mean from that number. For our set of numbers 10, 20, 30, 40, and 50 the deviations from the mean (which is 30) are:
- 10 less 30 = -20
- 20 less 30 = -10
- 30 less 30 = 0
- 40 less 30 = +10
- 50 less 30 = +20
-
In step 3 we need to square each deviation. To square a number means to multiply that number by itself. For the numbers in our set, we get:
- For 10 the deviation is -20 and squared deviation is -20 x -20 = 400
- For 20 the deviation is -10 and squared deviation is -10 x -10 = 100
- For 30 the deviation is 0 and squared deviation is 0 x 0 = 0
- For 40 the deviation is 10 and squared deviation is 10 x 10 = 100
- For 50 the deviation is 20 and squared deviation is 20 x 20 = 400
-
step 4 is only calculating arithmetic average of the squared deviations we have just calculated in step 3. It is exactly the same thing as we did in step 1 – the only difference is that in step 1 we were calculating the average of the original numbers (10, 20, 30, 40, and 50), but now in step 4 we are calculating the average of the squared deviations.
In our example, the squared deviations are 400, 100, 0, 100, and 400. We sum them up and get 1,000. Then we divide 1,000 by 5 and get 200. That’s it. The variance of the set of numbers 10, 20, 30, 40, and 50 is 200. Variance is the average (step 4) squared (step 3) deviation (step 2) from the mean (step 1).
The importance of squaring the deviations
Squaring numbers has two effects. Firstly, any negative number squared is a positive number. This way we get rid of the negative signs we had with deviations from the mean for numbers which were smaller than the mean. Secondly, squaring gives much bigger weight to big numbers (or big negative numbers) than to numbers close to zero. Squaring the deviations avoids some troubles we would otherwise have in the next and final step.
In finance and in most other disciplines, standard deviation is used more frequently than variance. Both are measures of dispersion or volatility in a data set and they are very closely related. Standard deviation is the square root of variance. Vice versa, variance is standard deviation squared.
To calculate standard deviation from variance, only take the square root. In our example, the variance was 200, therefore standard deviation is 14.14.
As a result, the calculated sample variance (and therefore also the standard deviation) will be slightly higher than if we would have used the population variance formula. The purpose of this little difference it to get a better and unbiased estimate of the population‘s variance (by dividing by the sample size lowered by one, we compensate for the fact that we are working only with a sample rather than with the whole population).