Data analysis of Converge output using Python
Objective
> A python script to visualize the data according to the user input and save the images.
> The program should do a compatability check for the given input file.
> To do performance calculations such as
> Area under P-V curve.
> Power output of engine.
> Specific fuel consumption .
> The data file to analyse is given in the below link.
(https://drive.google.com/file/d/1L8GY56d-M8mB1KfceM-xVhGNvnCIqxjm/view)
Program
#Data analysis in python with CONVERGE output

#Import required modules
import matplotlib.pyplot as plt
from scipy.integrate import simps
from tabulate import tabulate
import numpy as np
import math

#File input
File = (input('Enter the filename: '))
if File == 'engine_data.out':
	print('File found successfully')
	print('Proceeding to compatability check')
else:
	print('File not recogonized. Please provide a valid CONVERGE output file')
	exit()

#To get the titles of the data file
titles = []
for line in open(File):
	if '#' in line:
		titles.append(line.split())

#Compatability check
if 'CONVERGE' in (titles[0]):
	print("Compatability check successful")
	print('File consists of datas given below')
	print('n')
else:
	print("File not recognized. Please provide a valid CONVERGE output file")
	exit()

#To get the column numbers from the data file
S_num = []
for sn in titles[1]:
	if '#' not in sn:
		if 'column' not in sn:
			S_num.append(sn)

#To get the Parameters from the data file
Parameters = []
for p in titles[2]:
	if '#' not in p:
		Parameters.append(p)

#To get the Units of the parameters from the data file
Units = []
for u in titles[3]:
	if '#' not in u:
		Units.append(u)

#Printing the parameters with units and column numbers
headers = ['S.No','Parameters','Units']
data    = tuple(zip(S_num,Parameters,Units))
print(tabulate(data,headers=headers))
print('n')

#To take column numbers as the input and plot the respective columns
x = 1
while x==1:

	a = int(input('Enter column number of the required parameter_1: '))
	b = int(input('Enter column number of the required parameter_2: '))
	print('n')

	#To automatically generate the labels for the plot
	x_L = Parameters[a-1]
	y_L = Parameters[b-1]

	#To store the required values to plot
	value_1 = []
	value_2 = []

	#To calculate the workdone of the engine from p-v curve
	Pressure = []
	Volume = []

	#Creating a loop to get the required values from the data file
	for line in open(File):
		if '#' not in line:
			value_1.append(float(line.split()[a-1]))
			value_2.append(float(line.split()[b-1]))
			Pressure.append(float(line.split()[1]))
			Volume.append(float(line.split()[7]))

	#Calculating area under PV plot
	Area = simps(Pressure,Volume)
	print('Area under P-V curve: '+str(Area))
	print('Work done by the enigne: '+str(Area*1e6))
	print('n')

	#Calculating the power output of the engine
	rpm = int(input('Enter the rpm value to calculate power output: '))
	rps = rpm/60
	S_c = rps/2
	power = (Area*1e6)*(S_c/1000)
	print('Power output of the engine: '+str(power)+' KW ')
	print('n')

	#Calculating the specific fuel consumption
	r = int(input('Enter the value of fuel consumption per stroke in mg: '))
	sfc = r/power
	sfc = sfc*3.6
	print('Specific fuel consumption of the engine: '+str(sfc)+' kg/KWhr ')

	#To plot the parameters according to the user input
	plt.plot(value_1,value_2,linewidth=3)
	plt.title(y_L+" vs "+x_L)
	plt.xlabel(x_L)
	plt.ylabel(y_L)
	plt.grid()
	plt.savefig(y_L+" vs "+x_L)
	plt.show()
	print('n')

	#To continue or exit the program
	x = int(input('Press 1 to continue 0 to end: '))
Program explanation
> The program can be split into 4 parts
> File input and compatability check.
> To get the parameter names from the data file.
> To take user input to plot and save the image of two columns.
> Performance calculation.
File input and compatability check
> At first the required modules are imported
> Then the Input command is used to ask the user to enter the file name.
> Then an if loop is created to check wether the user entered file is found or not.
> Which then proceeds to the compatability check.
> For the data file to pass the compatability check it has to have the name 'CONVERGE' in the first line of the data.
> To get the first line of the data an open variable 'titles' is created at first.
> An if loop is created with the condition that if '#' in line then append the line to the empty array.
> Since the first four lines of the data has '#' they get appended to the variable named 'titles'
> Therefore the first index of the variable 'titles' can be used to do te compatability check.
> The first index of the variable 'titles' is used in a if else loop to do the compatability check.
> If the first line of the data have the name 'CONVERGE' then the program passes else exits.
Parameters of the data file
> To print the parameters of the data file in the output window for the user to choose the column numbers to plot.
> Now we have all the column numbers, parameters and units in the 'titles' variable
> But if they are printed the way they are stored, the oder will be colapsed and also it gets printed with the '#'
> So the second, third and fourth index of the 'titles' variable are given seperate for loop with some conditions and are appended to different variables.
> Therefore the column number, parameters and units gets ordered which are then tabulated and printed.
User input of column numbers to plot and save the parameters
> At first, the column numbers are acquired from the user by using the input command.
> Since python have 0th index as first index the value from the user input is deduced by 1 whenever used in the program.
> To automatically label the plot the parameter variable is assigned with the user input index accordingly.
> Then two open variable value_1 and value_2 are created to store the datas of the parameters required by the user.
> The values are store in the variable using a for loop by using the line.split command and the index value given by the user.
> The line.split command splits the data column which it gives the datas of the column according to the index number, which is then appended to the variables value_1 and value_2 accordingly.
> The pressure and volume datas are also appended to the open variables created for calculation purposes.
> Then by using the plot, savefig and labeling commands the image is created with the variables, value_1 and value_2.
Basic performance calculation
> Area under the p-v curve
> It can be calculated by using the simpsons method which is imported in the modules
> The area is caluated using the pressure and volume variables which has the data using the simps command.
> Which is then printed to the output window.
> If the area is multiplied by 1e^6 then it give the work done by the engine in Joules.
> To calculate the power output of the engine.
> The rpm of the engine is given by the user which is used to calculate the power.
> The formula used to calculate is
Power = workdone * (strokecycle/1000) KW
Workdone = area*1e6
strokecycle = rps/2
> By using the above formula the power of the engine is calculated for the given rpm.
> To calculate the specific fuel consumption.
> The fuel consumption of the engie per stroke in mili grams is taken as input from the user
> Which is then used to calculate the specific fuel consumption using the formula
BSFC = r/P
where, BFSC - Brake specific fuel consumption (g/J)
r - fuel consumption rate in grams per second (g/s)
P - Power output of the engine (W)
BSFC [g/(kW⋅h)] = BSFC [g/J] × (3.6 × 10⁶)
BSFC [g/(kW⋅h)] = BSFC [mg/KW] × (3.6)
> Using the above formula the BSFC is calculated. The units are converted accordingly.
At the end of the code a choice is given to the user wether to continue or end the program which is done using a while loop. A variable 'x' with value 1 is used for the condition. If the user wish to continue to plot and save multiple images then the x = 1 condition is to be maintained by the user. If the value of the x variable is change then the program ends.
Results
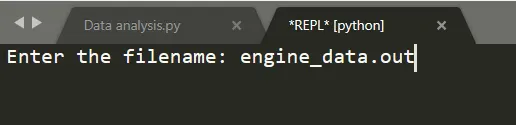
> When the code is run it askes the user to enter the file name as shown below
> After entering the file name the data file is found and the compatability check is made
> Then the Datas in the CONVERGE output data file is shown as below
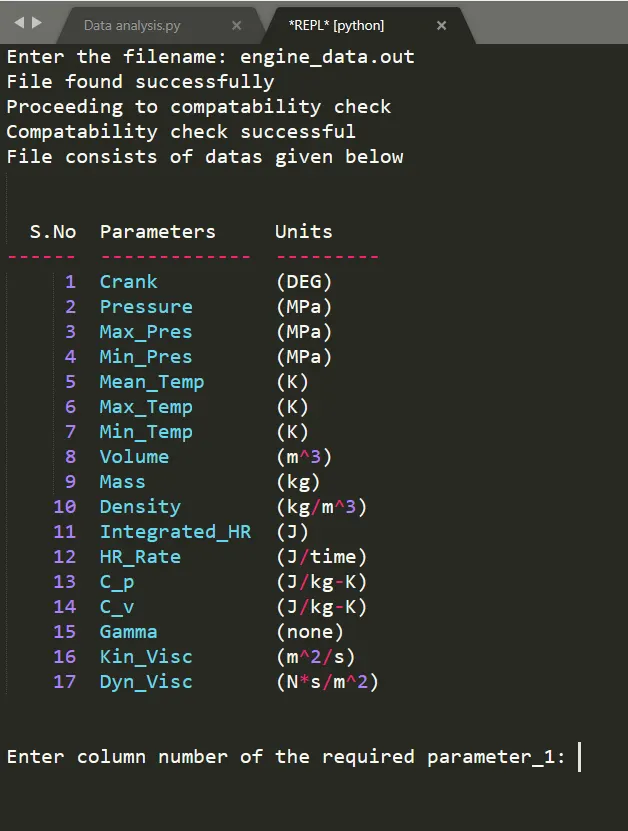
> With the parameters shown above the user can choose the required column numbers accordingly.
> After the user enters the column number, the program asks the user to enter the engine rpm to calculate the power out of the engine.
> Then asks the user to enter the fuel consumption by the engine in miligrams to calculate the BSFC.
> When the user enters all the values, the program calculates accordingly and also plots the parameters required by the user and saves the image.
> Then the program asks the user wether to continue or end.
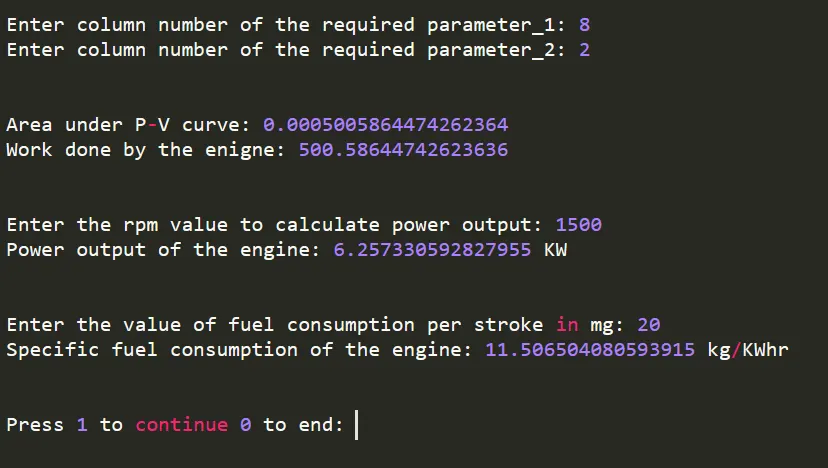
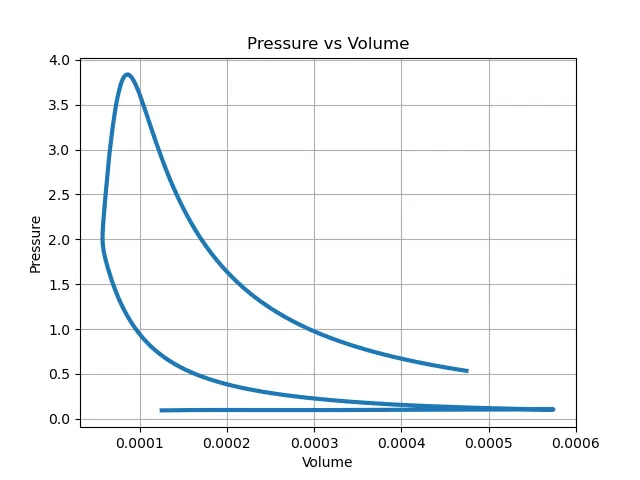
> The columns entered as user were 8 and 2
> Therefore the below shown image is ploted and saved accordingly
> The labels were made automatically by the program
> If the user continues by entering '1' then the program repeates as shown below to plot and save another image using other parameters.
> And if user enters '0' then the program ends.
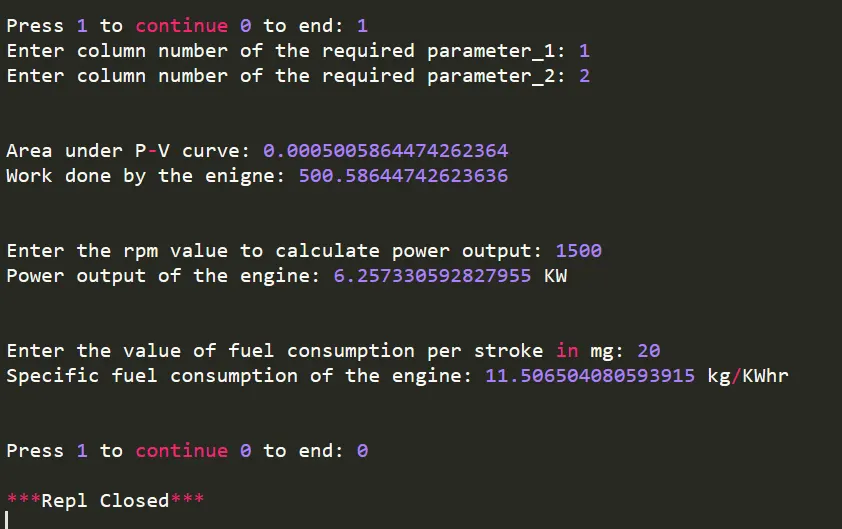
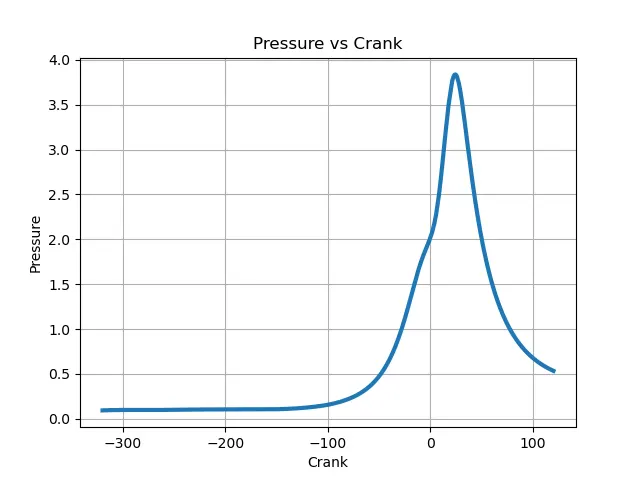
> The second plot created and saved by the program is given below
> The columns entered as user was 1 and 2
> Therefor the pressure vs Crank plot is made
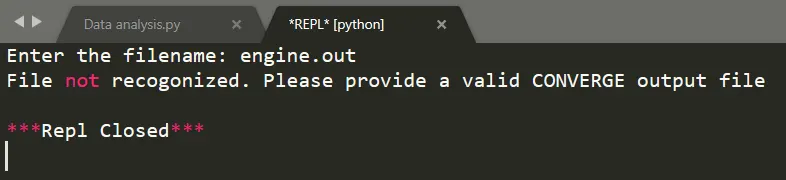
> If the file name entered is not present or if the file name entered is wrong the program exits and does not proceed as shown in the below image
> And hence a python script is made to analyse the CONVERGE output data.