CHT Analysis on a Graphics card
AIM:
To perform CHT analysis on the graphic card.
OBJECTIVES:
1) To learn the procedure for CHT analysis in ANSYS Fluent
2) To understand various meshing concepts and methods
3) To infer various physical parameters from the simulation
INTRODUCTION:
A CHT (Conjugate Heat Transfer) analysis is useful where there are multiple modes of heat transfer in our computational domain, like conduction and convection. CHT analysis is carried out when there is thermal interaction between solid and fluids. A fluid is convected across the unit. Heat is conducted through the fin cooling unit placed on the processor and base. The fluid flowing across the unit carries the heat away by convection. Having such a great number of applications for this type of simulation makes it important to be studied in depth. Assumptions: 1) The air flow profile from inlet is considered to be of uniform value, instead of a profile of different values. 2) Air flow resistance due to cabinet's back mesh is considered to be 0. 3) The heat producing chip is small in size compared to real life graphic cards, so the heat generation capacity is reduced accordingly. 4) The physical constraints to the flow due to side walls are considered to be zero. (The temperature gradient along side walls is found to be negligible, so they are replaced with symmetry boundary conditions)
THEORY:
The graphics card is responsible for rendering an image to the monitor by converting data into signals. A better and smoother image can be produced with the help of a graphics card. The graphics card is primarily designed to remove the graphical processing tasks from the processor or RAM.The dedicated GPU and a dedicated RAM that helps processing graphical data quickly. The Graphics card has a dedicated heat sink to keep the heat out of the GPU.
TYPES OF GRAPHICS CARDS
Integrated. Graphics cards are built into the motherboard and no add in cards are used.
Discrete: The add in graphics card is installed on the mother board as an extra component and the card can be upgraded as required.
GEOMETRY USED
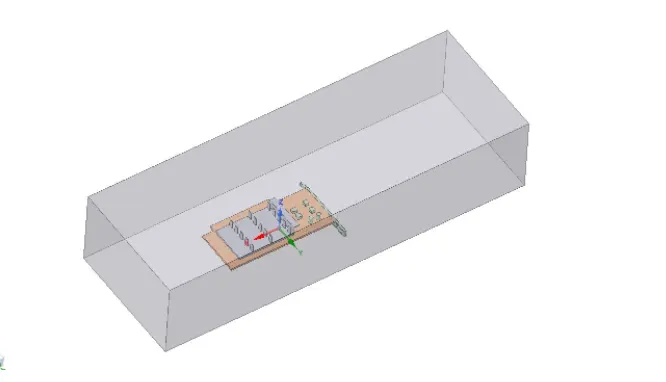
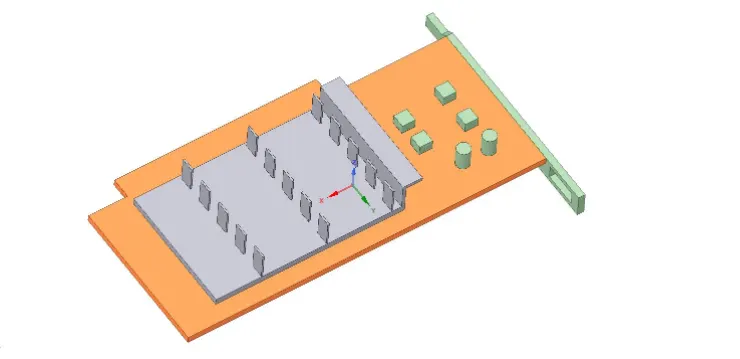
FIG 1: GRAPHICS CARD GEOMETRY
INPUT CALCULATIONS:
The GPU chip used here is 8 x 8 x 1 mm
Vol of chip=`8*8 *1=64mm^3`
Here a 75W processor is assumed,
Heat generated =`75/(64*10^-9)``= 1171875000W/m^3`
MATERIAL PROPERTIES
1) Fins --> Aluminium Standard aluminium is available in Fluent database. Density = 2719 Kg/m^3 Heat capacity = 871 J/KgK Thermal conductivity = 202.4 W/mK
2) Processer --> Silicon Since the silicon is not available in Fluent's solid database, I had to define it Density = 2000 Kg/m^3 Heat capacity = 710 J/KgK Thermal conductivity = 150 W/mK 3) PCB --> FR4 (glass-reinforced epoxy laminate material) Since the FR4 is not available in Fluent's solid database, I had to define it Density = 1850 Kg/m^3 Heat capacity = 950 J/KgK Thermal conductivity = 0.29 W/mK
4) Fluid --> Air Standard air is available in Fluent database. Density = 1.225 Kg/m^3 Heat capacity = 1006.43 J/KgK Thermal conductivity = 0.0242 W/mK Viscosity = 1.7894e-05 Kg/m-s
This report has 3 cases of meshing: (The geometry and setup is discussed only in case 1 as it remains same for other cases) Case 1: 1) Geometry The enclosure and graphic dimensions are:
After importing such geometry, the shared topology is enabled in fluent and by using shareprep function, a conformal geometry is made.
2) Mesh settings: Global mesh setting of element size = 10 mm 1) PCB body sizingelement size = 1 mmcapture curvature - yes, 18 deg 2) Processor body sizingelement size = 1 mmcapture curvature - no 3) fins body sizingelement size = 1 mm capture curvature - no Global number of elements = 201920
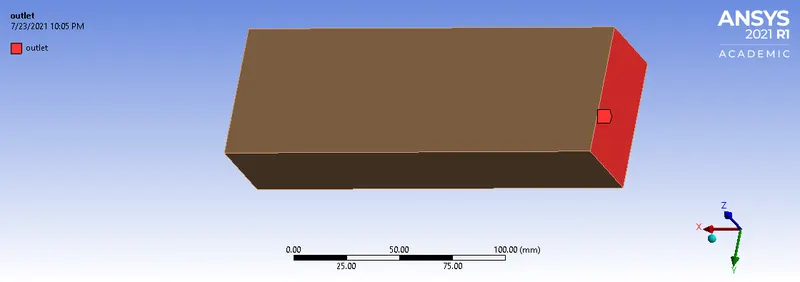
FIG 2 : OUTLET NAMED SELECTION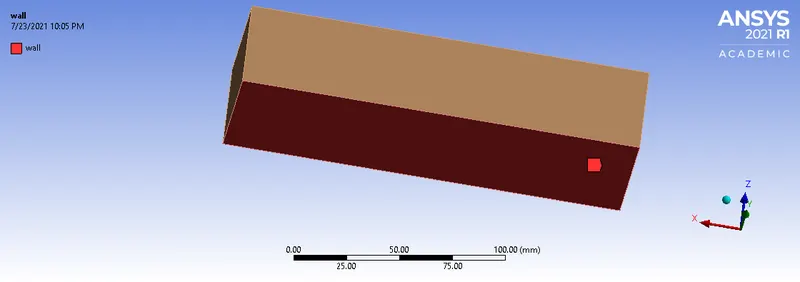
FIG 3: WALL NAMED SELECTION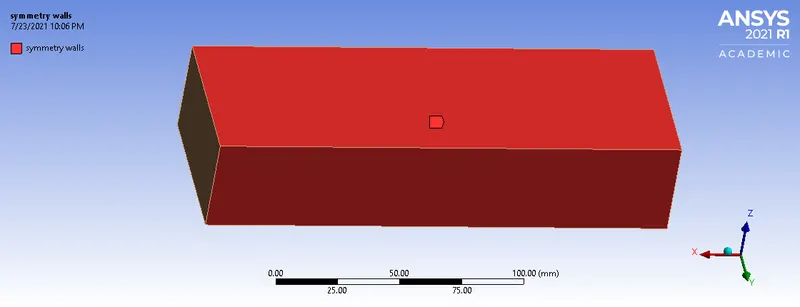
FIG 4: SYMMETRY WALLS
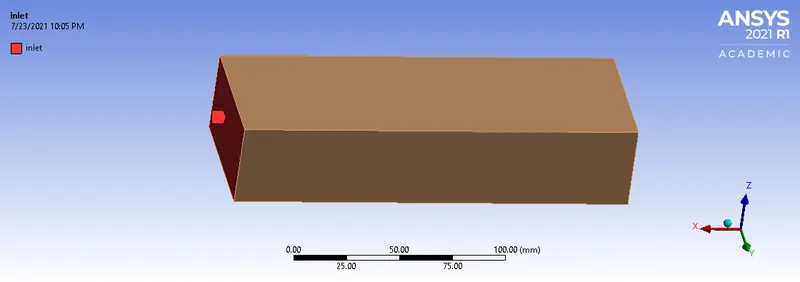
FIG 5: INLET NAMED SELECTION
BASELINE MESH
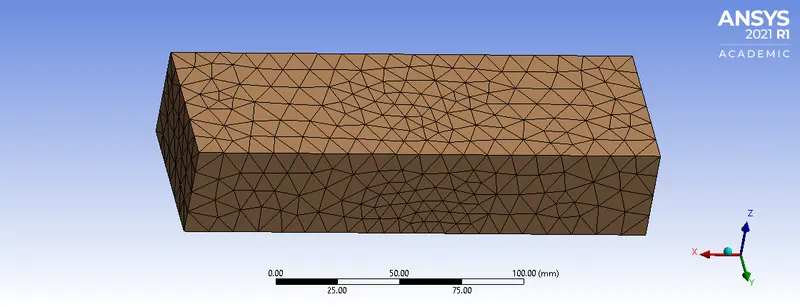
FIG 6:MESHED ENCLOSURE
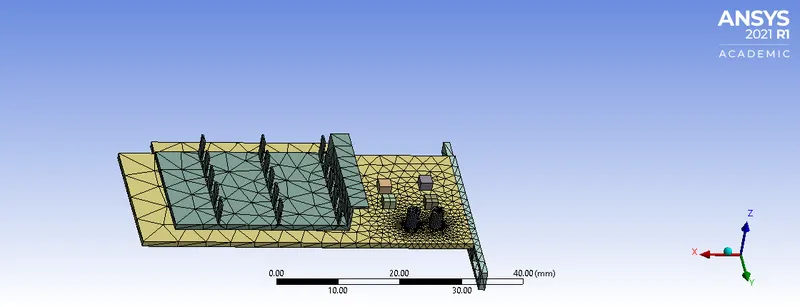
FIG 7: MESHED BODY
3) Setup: Steady state analysis Solver - pressure based Turbulence model --> realizable k-e model Inlet velocity = 2 m/s Heat generation rate = 2.3437e7 W/m^3 Side walls --> symmetry Number of iterations = 500
The solution converged around 325 iterations. 4) Results: (It might appear in some images that contours are plotted on interior, but pay attention if its a shadow or a real interior volume. There seemed to some problem with naming of interiors and walls but the end results are plotted where they should be.) 1) Temperature contour - Global
The max temperature reached by system is 53.175 Deg C. The PCB doesn't conduct the heat to a great extent so it remains around 33 Deg C. Also, there appears to be a local hotspot in centre of the fin base. 2) Temperature contour - Local
It can be seen that fins at the front are cooler than the ones behind. This happens because the cold air first hits the front fins, it gets heated up and goes to next fin. Hence, the next fins can't give it enough heat as difference in temperature is lower in between solid and fluid. 3) Temperature Distribution
The outer fins are more cooler than the inner fins. This is due to velocity of air passing from sides is more than that of centre.
The temperature is highest at the region little back from centre. This is due to more cooling from the front fins.
A potential hotspot is also present below processor, on the PCB. So one must avoid placing components on that place. 8) Velocity contour
The flow has a dead (wake) region behind the fins. It should be seen correctly through a vector plot. 9) Velocity vector plot
There are 3 recirculation regions fromed and their velocity is less than 0.3 m/s. So, it is important to look at flow over this region using streamlines. 10) Temperature - Streamline - recirculation region
It is seen that the components behind the fin plate receive a high temperature(38 Deg C) air with low velocity (<0.3 m/s). If any component generates heat over that region, it would not cool down faster. If a component doesn't generate heat, the air would heat that component. So, in either way the heat will stay in that region, causing problems to the components present there. So, the processor must be placed at last in the flow direction. 11) Heat flux plot
1) The heat flux seems to be more from front end. This is due to higher temperature difference in solid and fluid. As the air moves forward, it takes less heat, so the region appears blue. 2) The heat flux distribution over a fin is interesting. The corners and centres have a higher contact with air, so they give up more heat. 12) Heat flux - processor
The heat flux is shown around the walls of processor. It is more from the top because the fins take more heat than the pcb plate. 13) Wall heat transfer Coefficient (WHTC)
The distribution seems to averaged to a light blue region but there are local high spots at fin ends and processor slot. This error might be due to mesh at that location. To find average coefficient, we use function calculator:
14) Reason for the high heat transfer coefficient: A good mesh is said to have element quality near 1. Here, the fins and fin ends have quality < 0.4 and in some places <0.2. This must have caused the high WHTC values.
Also, a good mesh must have skewness near to 0 and must have average skewness around 0.33. In current case, average is near to 0.5 and fins have higher than 0.6. In fin ends the skewness is near to 0.9. So the mesh needs to be more fine.
Reasons to refine the mesh: 1) The recirculation region is not clearly visible 2) The WHTC has high values at some locations. 3) The element quality and skewness is not good. Case 2: 1) Mesh: Global mesh setting of element size = 5 mm 1) PCB body sizingelement size = 1 mmcapture curvature - yes, 18 deg 2) Proc body sizingelement size = 0.5 mmcapture curvature - no 3) Fins body sizingelement size = 0.5 mm capture curvature - no Global number of elements = 422289
2) Results: (The results obtained have similar explanations, so the results given below won't have exclusive reasons accompanied) 1) Residuals:
The simulation appears converged near 375 iterations. 2) Temperature plots:
The streamlines coming from below get heated from processor and rise above from sides thus heating the sides of fins and its base. 3) Velocity Plots:
The streamlines show the formation of two giant recirculation regions, formed due to air flowing from sides to middle of fin structure's back. 4) Heat flux
5) Wall heat transfer coefficient
The Average value is increased owing to factors like mesh quality, skewness, Orthogonality.
Even though the mesh is refined, the zone still has low quality. This means some other technique is to be used to remove such issues with quality.
Reason to further refine the mesh:
1) The mesh quality, skewness, etc are not upto the mark. Case 3: 1) Geometry:
In order to refine the mesh and keep the element numbers to a minimum, an enclosure is made surrounding the graphics card. An important step while doing this is selecting all three bodies(fins, processor, PCB) and then applying enclosure feature in ANSYS Fluent. The outer enclosure is deleted and then created again by selecting inner enclosure. The above given image gives information of the dimensions needed to make the enclosures. The dimensions are used based on the lengths of volume surrounding graphics card where there is a gradient in temperature.
2) Meshing: Global controls: Element size = 5 mm Capture proximity = yes Proximity size = 0.1 mm 1) Multizone - outer enclosure 2) Body sizing - inner enclosure Element size = 4 mm Capture curvature - yes 3) Body sizing = fin body Element size = 0.4 mm Behaviour - hard Capture curvature - no Capture proximity - no 4) Body sizing - processor body Element size = 0.4 mm Behaviour - hard Capture curvature - no Capture proximity - no 5) Body sizing - PCB Element size = 2 mm Capture curvature - yes Capture proximity - no 6) Pinch - on that edge tolerance = 0.1 mm Element number = 1852356
The pinch control is applied on the edge where the WHTC increases suddenly. It acts like a virtual topology. Even after we apply pinch control, the geometry doesn't change but the mesh changes. The reason for using this: The gap between fin and base's side is 0.1 mm. In order to resolve the length that small using element size, we would need element size = 0.05 mm. Doing so would increase the element number greater than 10 million. Other option is to locally change the size using sphere of influence method, but after doing so the high WHTC phenomenon spread to whole region of influence (tried before). So it became important to ignore the gap. Ignoring the gap might seem a bit wrong but it isn't because the temperature, temperature gradient, heat flux, velocity plots were uniform in that region without even using pinch control. For verifying whether the pinch control works correct, we have applied pinch control only on the top surface. The bottom surface has some gaps along the edges where the processor fits. There no-pinch control is applied.
Obtained mesh quality and parameters:
The pinched element has quality more than 0.9.
RESULTS:
BASE MESH RESULTS
1) Residuals
Here we see the residual plots repeating which confirms the given problem is converged
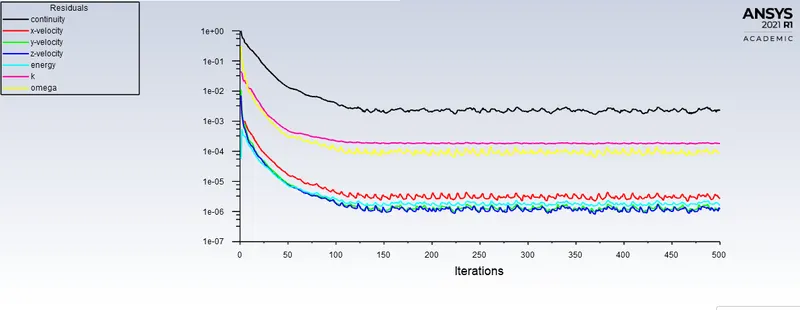
FIG 8:RESIDUALS
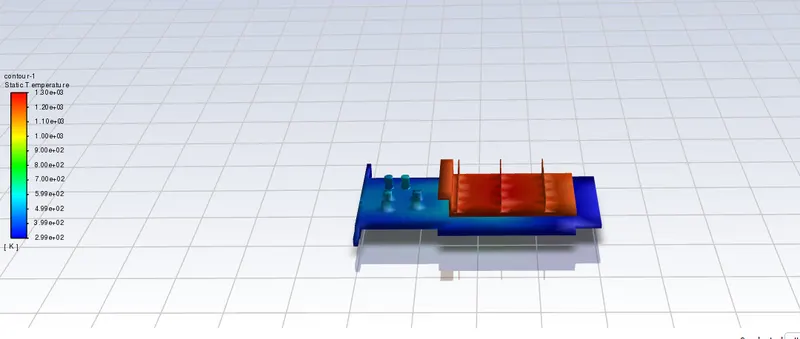
FIG 9:TEMPERATURE CONTOUR
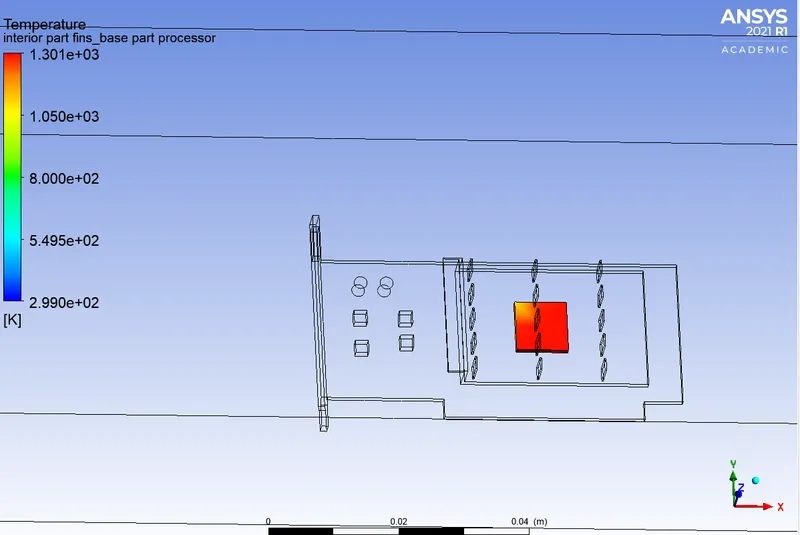
FIG 10: PROCESSOR TEMPERATURE CONTOUR
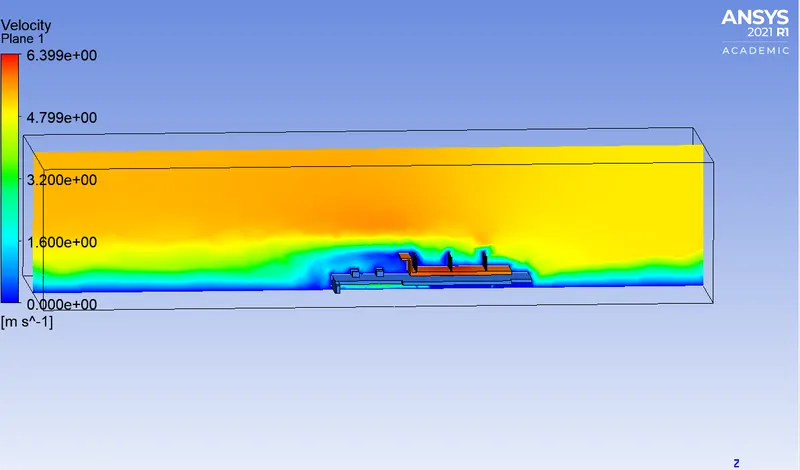
FIG 11:VELOCITY CONTOUR
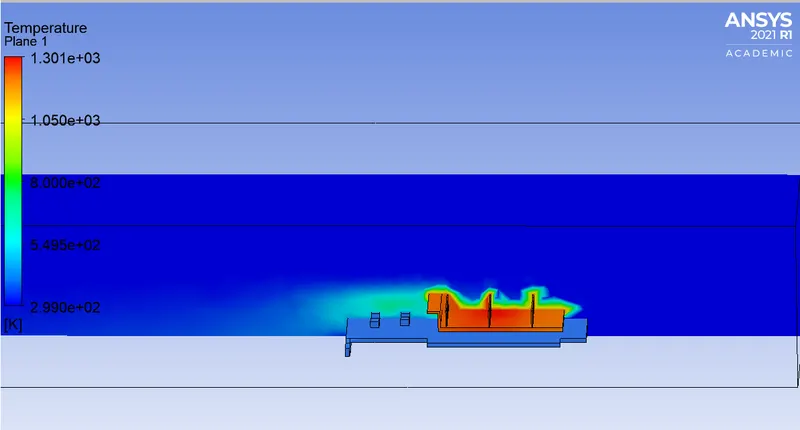
FIG 12:TEMPERATURE CONTOUR
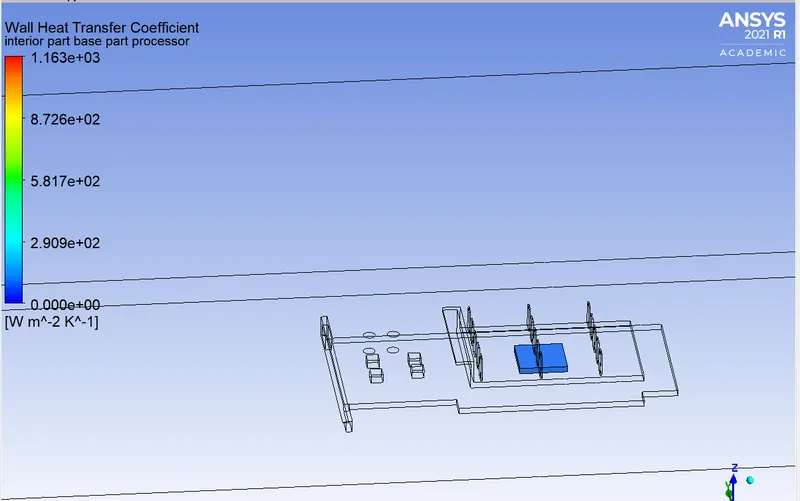
FIG 13: WHTC FOR PROCESSOR
FINE MESH RSULTS:
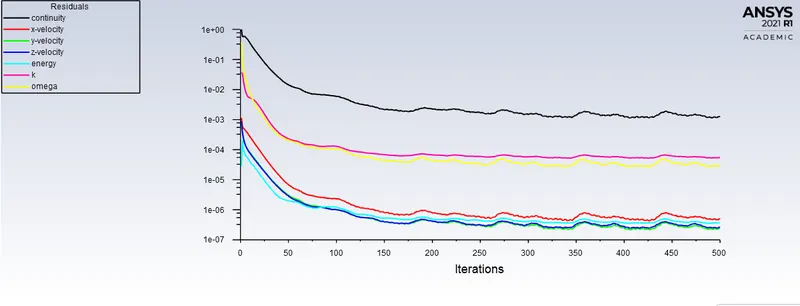
FIG 14:1 MM MESH RESIDUALS
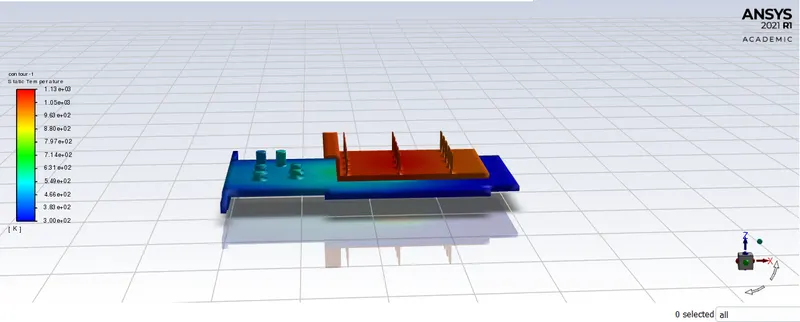
FIG 15: TEMPERATURE CONTOUR
CASE II: VELOCITY = 4m/s
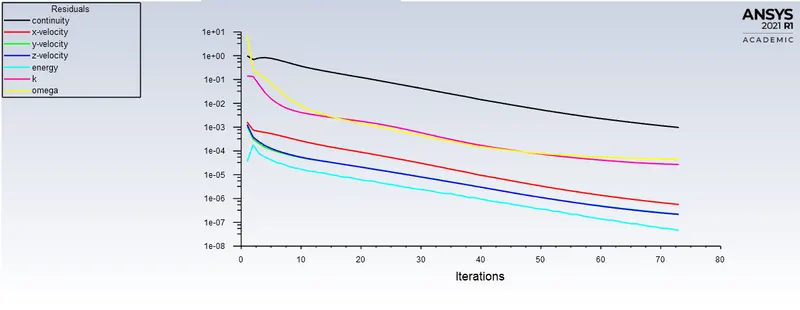
FIG :16 RESIDUALS CASE II
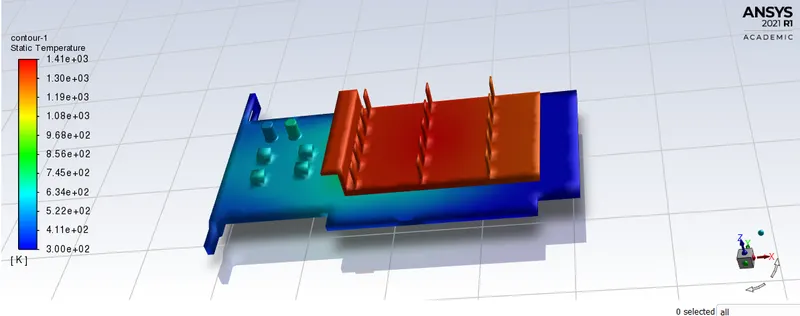
FIG 17: TEMPERATURE CONTOUR CASE II
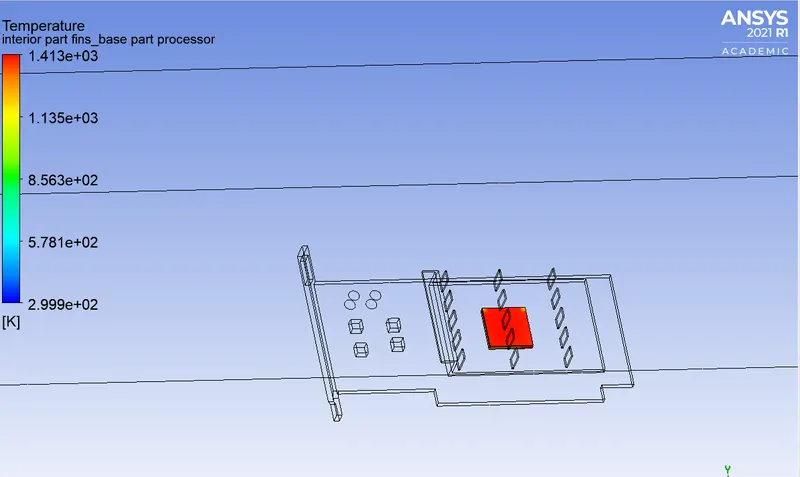
FIG 18: PROCESSOR TEMPERATURE
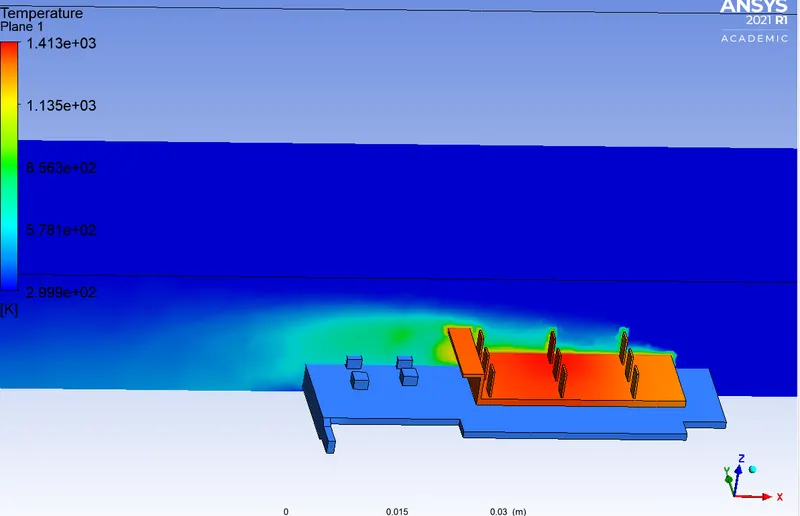
FIG 19: TEMPERATURE CONTOUR
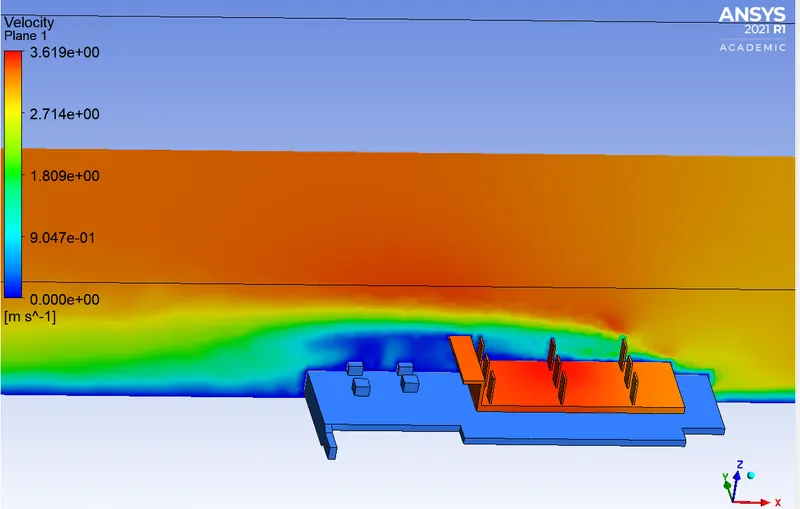
FIG 20:VELOCITY CONTOUR
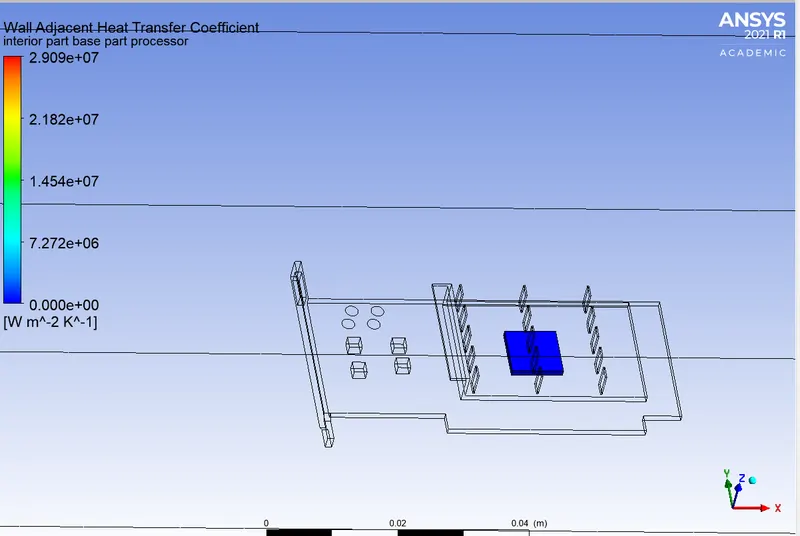
FIG 21: WHTC CONTOUR
The solution converged at around 74 iterations.
2) Temperature plots:
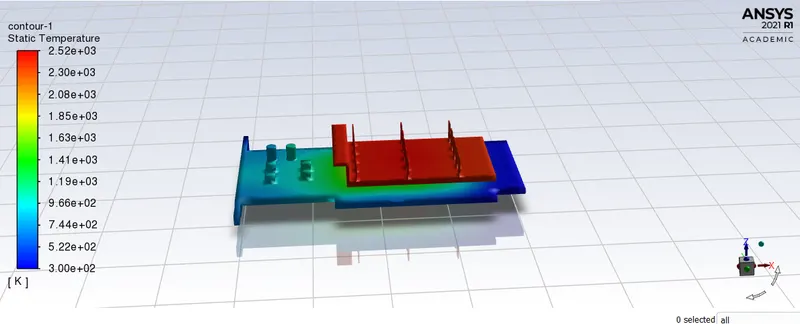
CASE III; VELOCITY=1m/s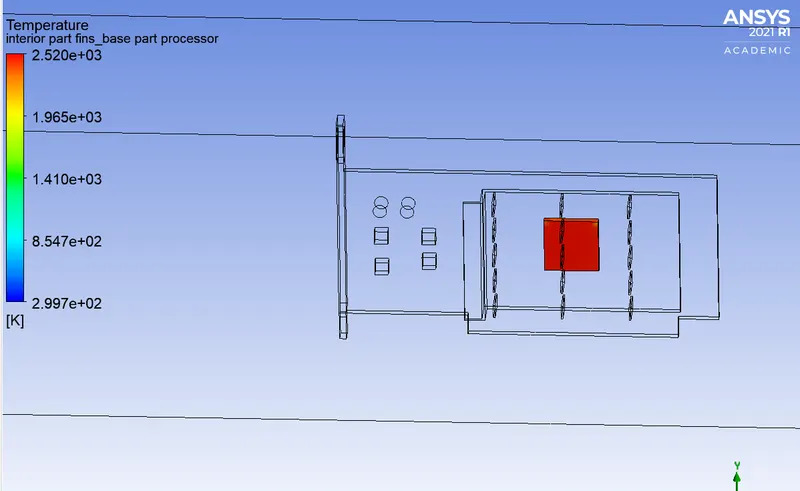
FIG 21: PROCESSOR TEMPERATURE
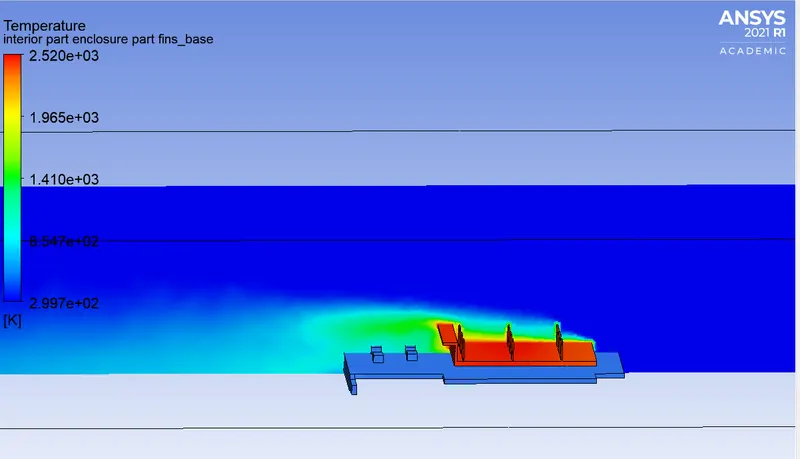
FIG 22: TEMPERATURE CONTOUR
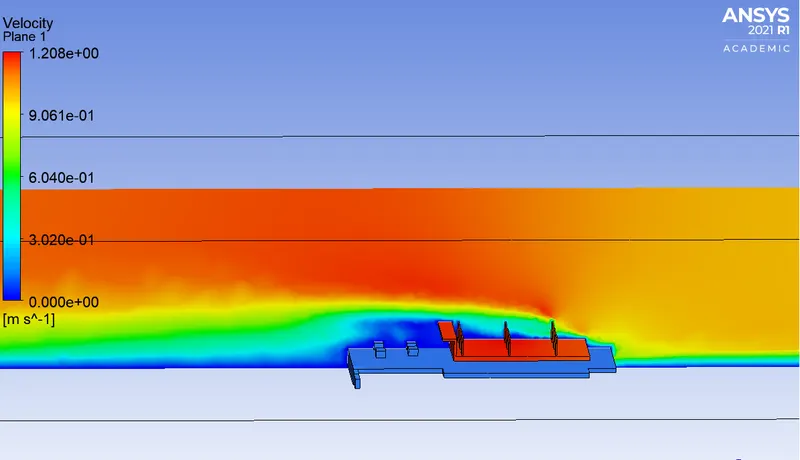
FIG 23: VELOCITY CONTOUR
FIG 24: WALL HEAT TRANSFER COEFFICIENT CONTOUR
A potential hotspot:
3) Velocity plots
MAX VELOCITY: 6.3 m/s
4) Wall heat flux
5) Wall Heat Transfer Coefficient
Max HTC: 2.52 E+03
CONCLUSION:
1) The CHT analysis is done for graphic card
2) Effect of various mesh parameters on simulation result is studied.
3) Temperature increases on decreasing velocity