CHT Analysis on a Graphics card
Aim:
To perform a steady state CHT analysis on a model of a graphics card.
Theory:
Conjugate Heat Transfer:
The Conjugate Heat Transfer (CHT) analysis type allows for the simulation of heat transfer between solid and fluid domains by exchanging thermal energy at the flow interfaces between them. The contemporary conjugate convective heat transfer model was developed after CFD came into wide use. It was used in order to substitute the empirical relation of proportionality of heat flux, to temperature difference, with heat transfer coefficient. This model describes the heat transfer between a body and a fluid flowing over or inside it as a result of the interaction of two objects. The physical processes and solutions of the governing equations are considered separately for each object (i.e. fluid and body) in two subdomains. Matching conditions for these solutions at the interface provides the distributions of temperature and heat flux along the body and flow interface. Typical applications of this analysis type exist as, but are not limited to, the simulation of heat exchangers, cooling of electronic equipment, and general-purpose cooling and heating systems.
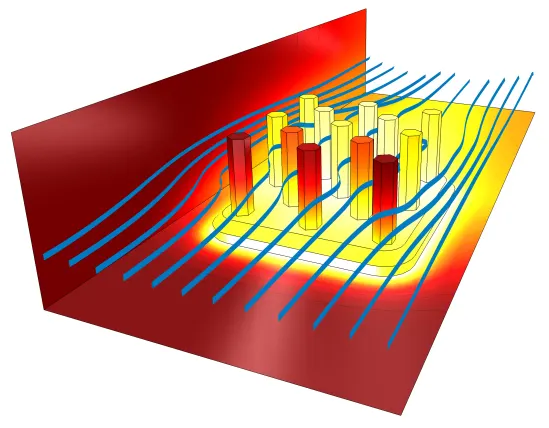
a heat sink being cooled by forced convection
Graphics Card and it’s components:
A video card (also called a graphics card, display card, graphics adapter, or display adapter) is an expansion card which generates a feed of output images to a display device (such as a computer monitor).At the core it is the graphics processing unit (GPU) which is a specialized electronic circuit designed to rapidly manipulate and alter memory to accelerate the creation of images in a frame buffer intended for output to a display device. GPUs are used in embedded systems, mobile phones, personal computers, workstations, and game consoles.
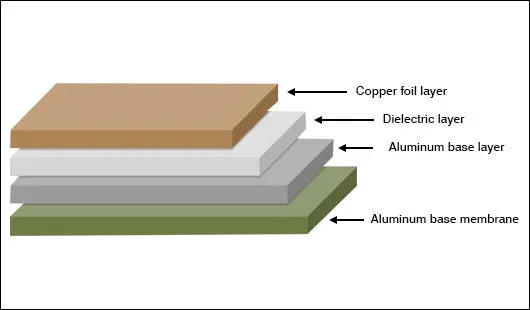
Components:
a graphics card is usually made of a Printed Circuit Board made of aluminium base for structural rigidity, on top of which a non conductive film is coated and then the copper circuit is layed, on top of which rests the GPU chip along with other electrical components like capacitors and RAM memories and finally a heat sink designed to extract away the heat produced by the chip and and the memory system.
In this simulation we are only concerned with
- the heat source, GPU chip, which is assumed to be made of silicon
- The PCB which is assumed to be made of copper base, and not accounting for heat transfer by dielectric layer and core layers that are present in the structure of PCB. The PCB is considered to be fully made of copper to reduce computational resources needed.
- The heat sink, which is assumed to be made of Copper as well as it is widely used as a heat sink for its cheaper cost and relatively high heat conducting properties.
Importance of heat analysis on electrical components:
It is important to optimize the design of electronic components because:
- They already operate at relatively high temperatures.
- The hotspots within the electric circuit might exceed the safe operating temperatures if designed poorly with no way to minimize or extract heat from the particular hotspot areas
- The continuous exceeding temperatures might degrade the electrical components like RAM, GPU chip, Capacitors, insulating medium over time, hence decreasing lifespan of the electronic product.
- The product might even get uncomfortable for use if temperatures stay high for the most time of their usage. For example using a laptop with poor thermal management makes it uncomfortable to work with since the keypad is directly above the components that generate the most heat. It also decreases the lifespan of the product.
- In some cases poor thermal management might even cause fire hazards.
Defining the solid and fluid zones for analysis:
The solid and the fluid zones are defined to conduct CHT analysis properly, by assigning solid zones and fluid zones we define where the conductive heat transfer takes place and where the convective heat transfer will start.
In this project, the solid zone needs to remain stationary as the fluid zone needs to move so that convection takes place at their interface.
Assumptions and given data:
From the given CAD file of the graphics card, it can me observed from the design of heat sink and absence of any other heat extraction devices, that the graphics card is a low end GPU, which is designed to operate at low input energy only (10-15W), anything above this will raise the temperature of the GPU chip so high( above 100 degree celcius) that it wont be able to function properly, or might get damaged.
From this we assume the GPU chip
- has a dimension of 8 mm x 8 mm x 1mm (measured from the provided CAD file.
- draws a maximum of 12 W of power.
- And produces the amount of heat = 12/(0.008x0.008x0.001)=18,75,00,000 W/(m^3)
Procedure:
Geometry preparation:
- Load the CAD file and then check for any errors in the model by going to repair and clicking on split edges or extra edges option.
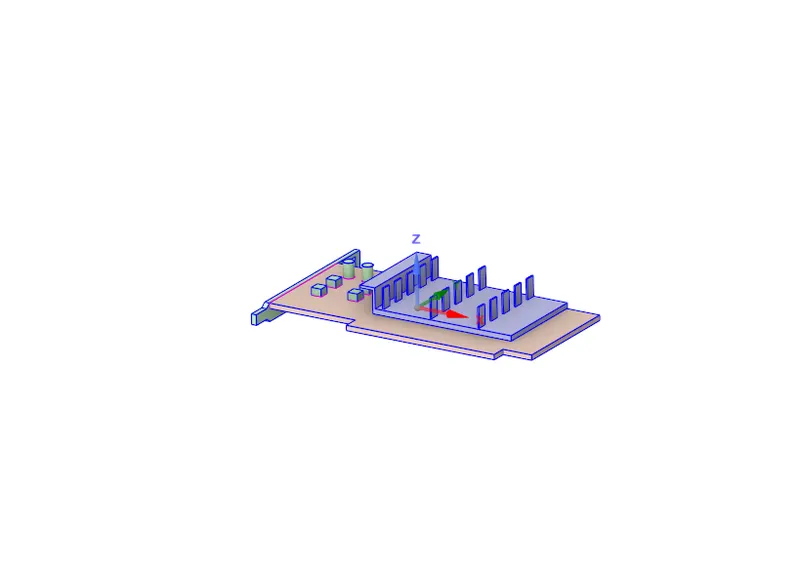
- Afterwards go to prepare and check for interference.
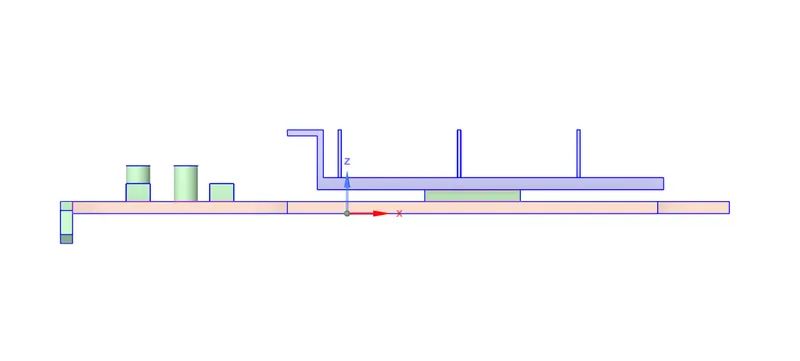
- Once that's done go to workbench and select share topography option.
Mesh settings:
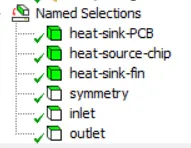
- In ansys mesh, select edges, and name them accordingly before generating the mesh.
- Mesh the fluid zone with element size 0.005 m
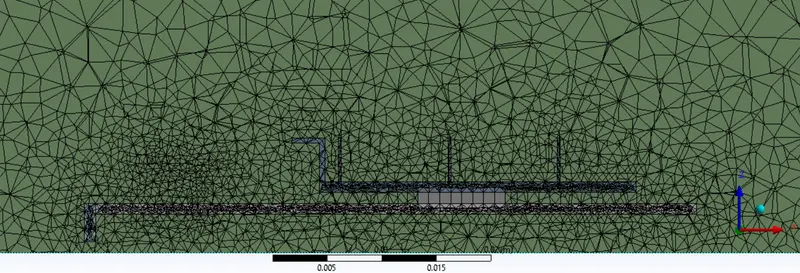
- Mesh the solid zone with element size 0.00035 m
Setup:
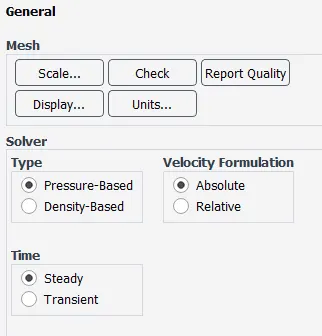
- Under general setting select steady state analysis, with absolute velocity formulation and pressure based solver.
- Check the energy option as we are going to deal with temperature in the solution.
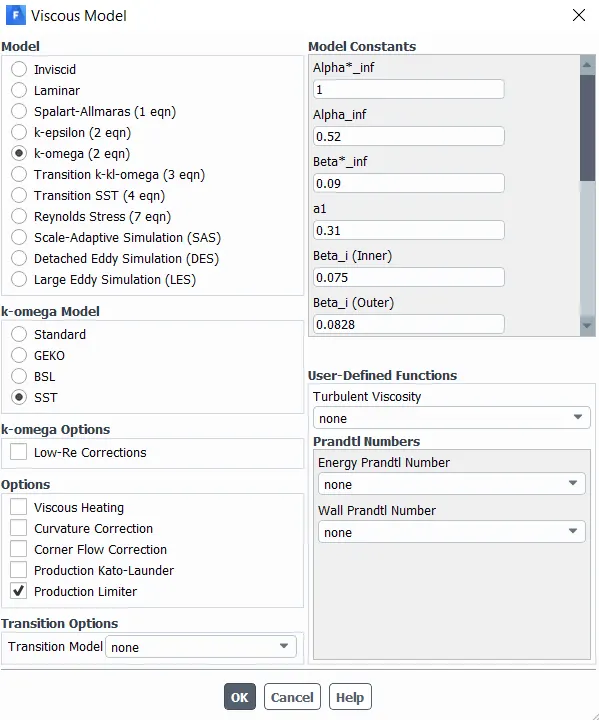
- Select the viscous model as k-omega, SST model.
- Define the materials as given in the images below:
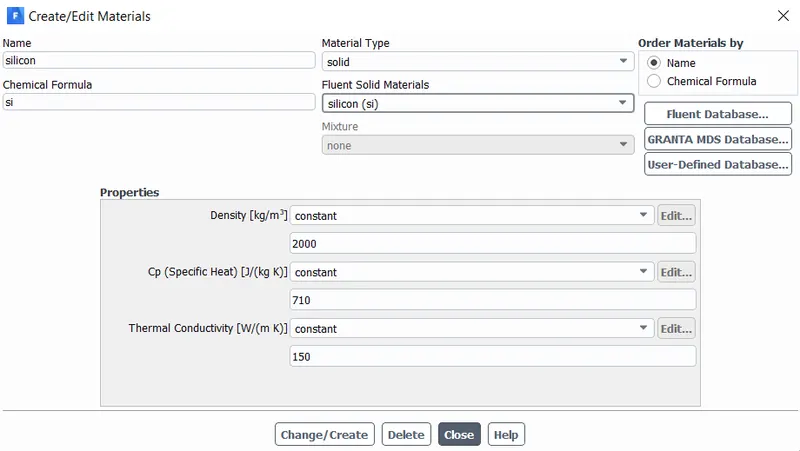
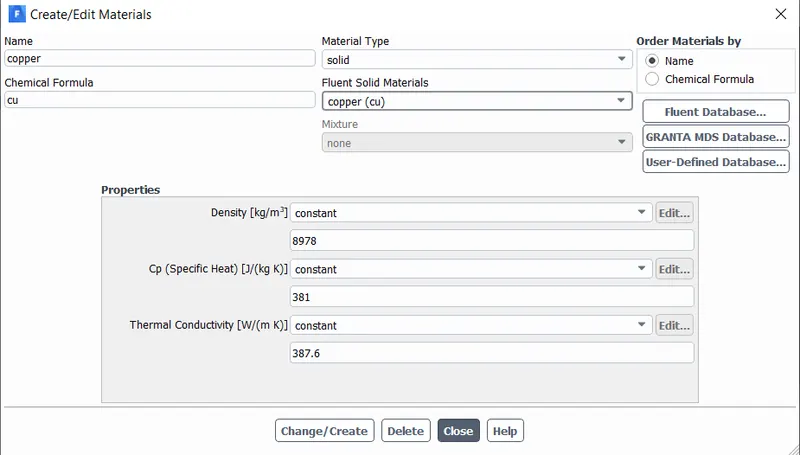
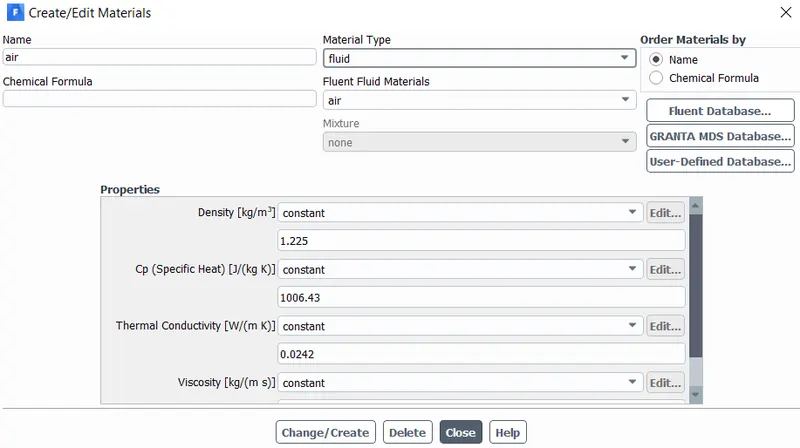
- Assign the materials to their respective zones (air in the enclosure; silicon in chip; copper in pcb and heat sink) and apply heat source value in the chip:
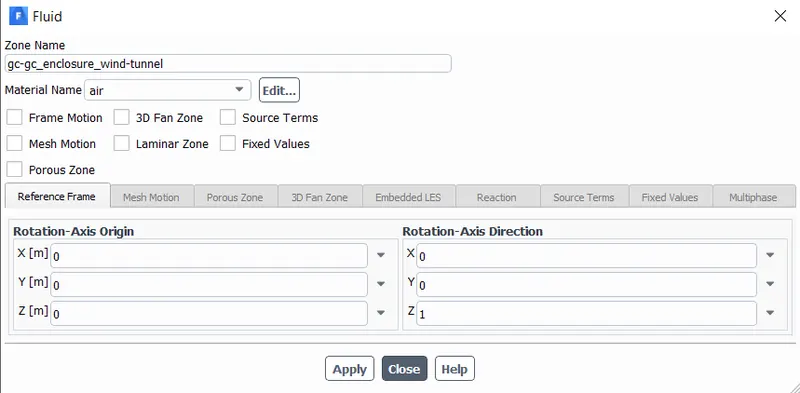
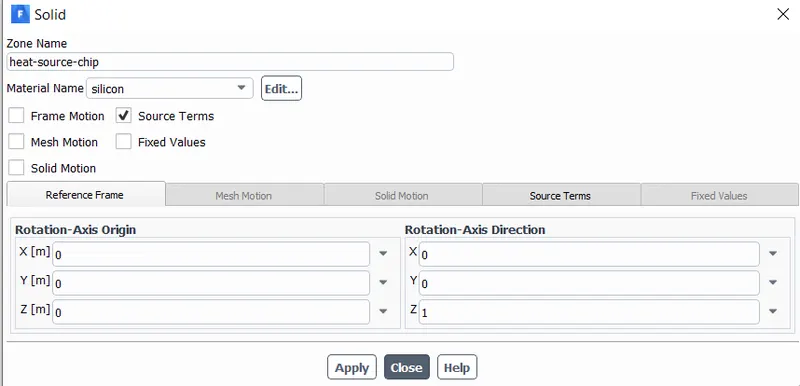
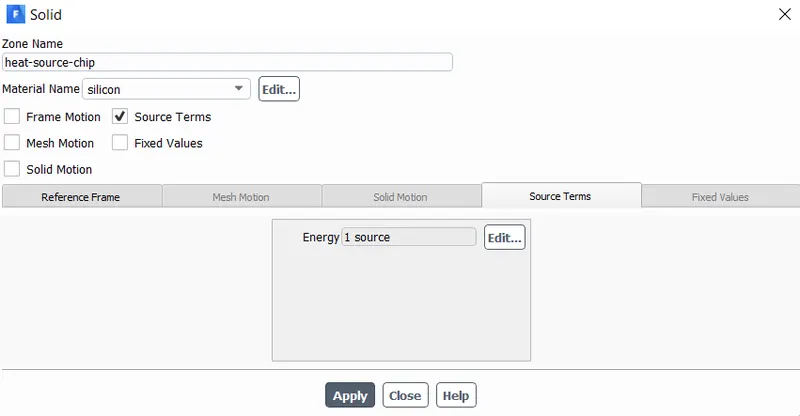
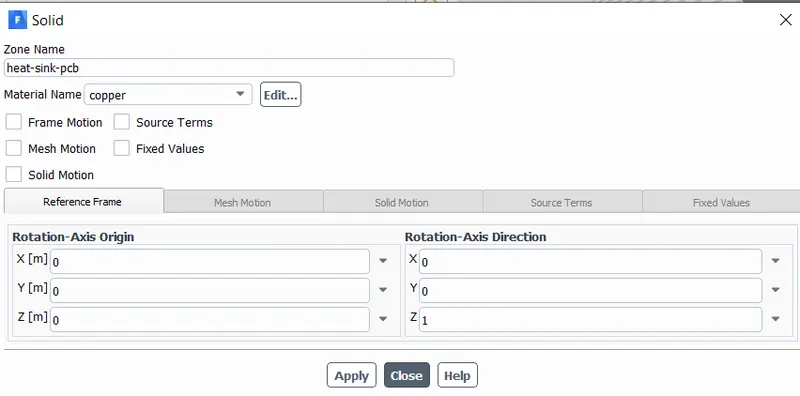
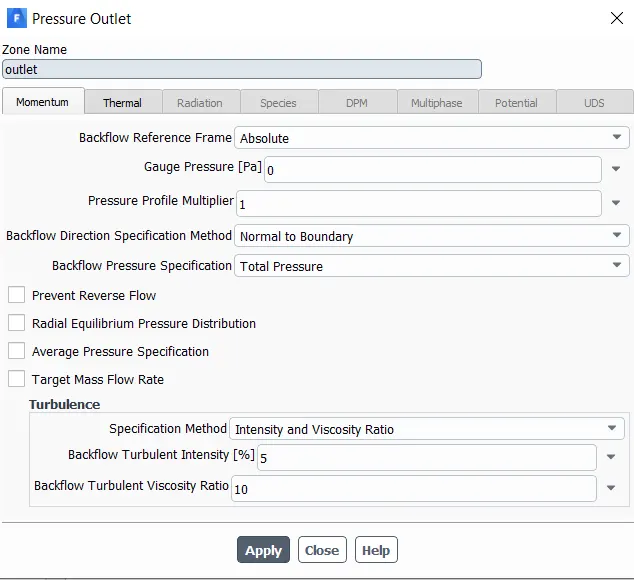
- Set boundary conditions, assign inlet velocity and check gauge pressure at outlet(it should be = 0)
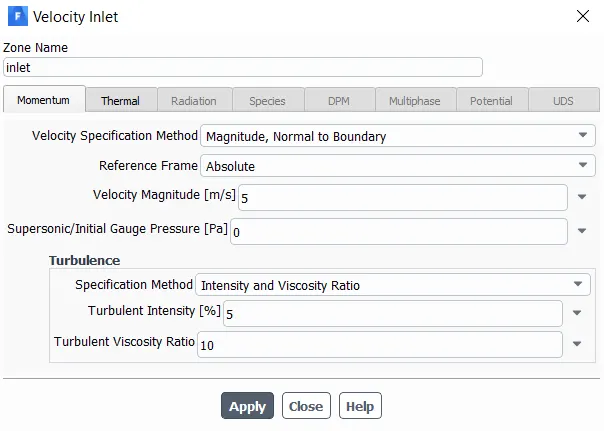
- Go to definitions and plot average temperature and HTC for PCB, heat sink and chip.
- Initialize the solution under hybrid initialization.

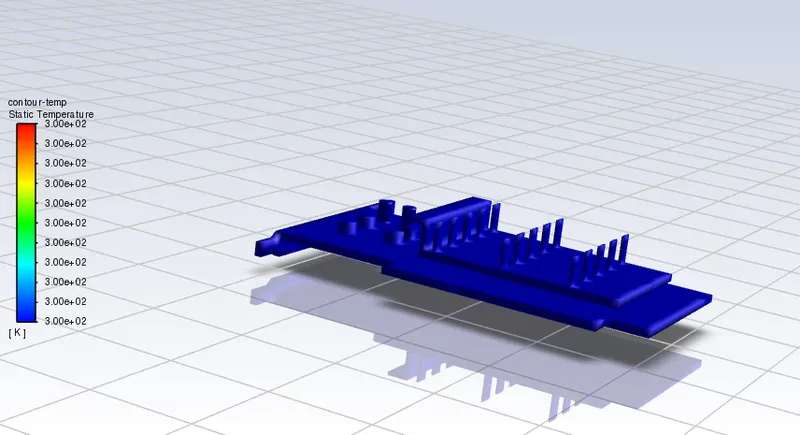
- Generate contour plot of PCB, heat sink and chip to monitor hotspots.
- Start calculation for 700 iterations.
Observation:
Case-1
Velocity = 1 m/s
Max Temperature = 467 K
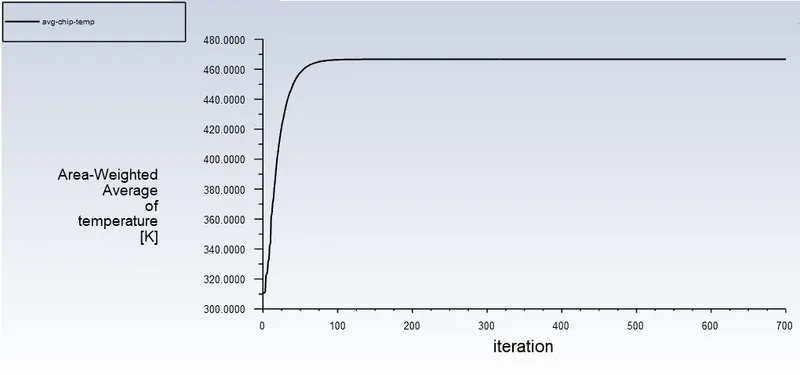
Area weighted average temperature plot:
avg. temp. = 466.6 K
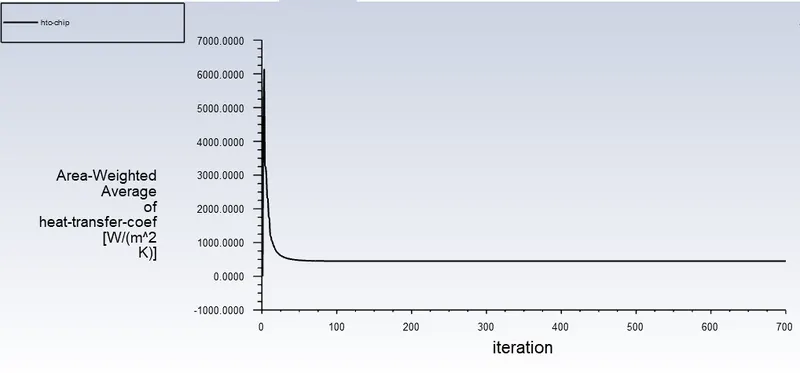
HTC:
HTC = 450.23 W/(m^2 K)
Residual:
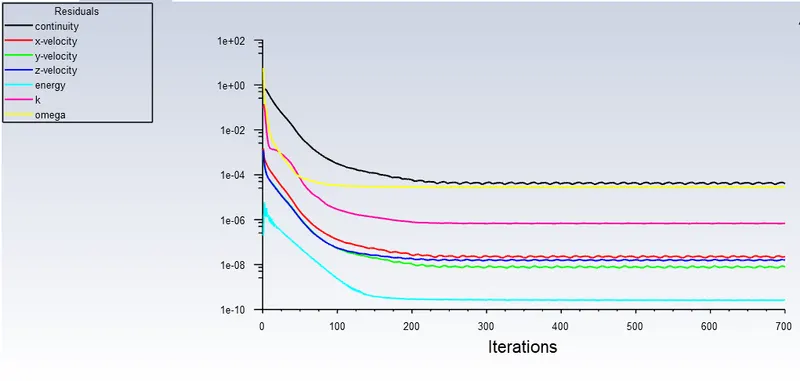
Case-2
Velocity = 2.5 m/s
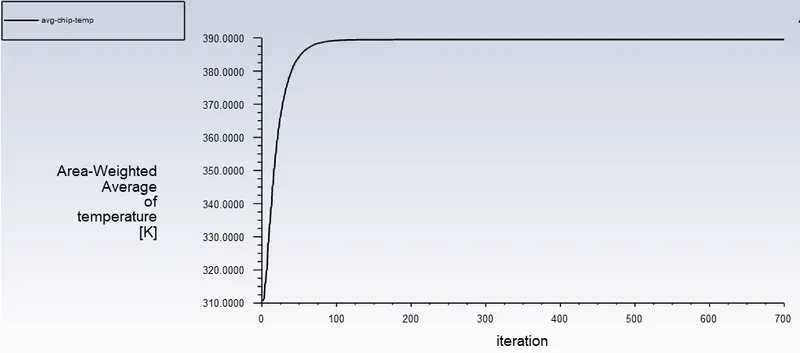
Max Temperature:390 K
Area weighted average temperature plot:
Avg. temperature = 355.5 K
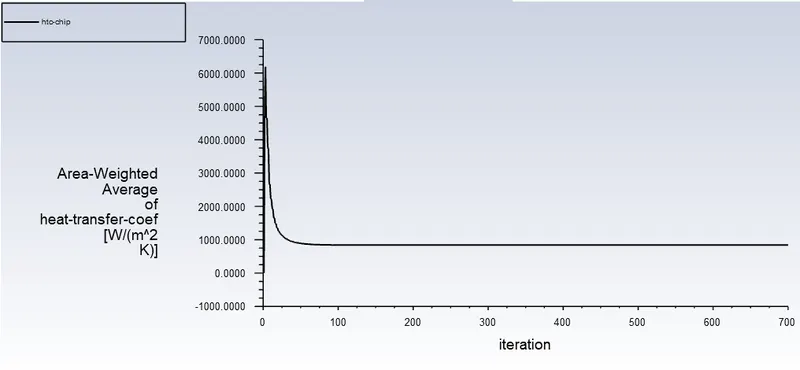
HTC:
HTC = 838.63 W/(m^2 K)
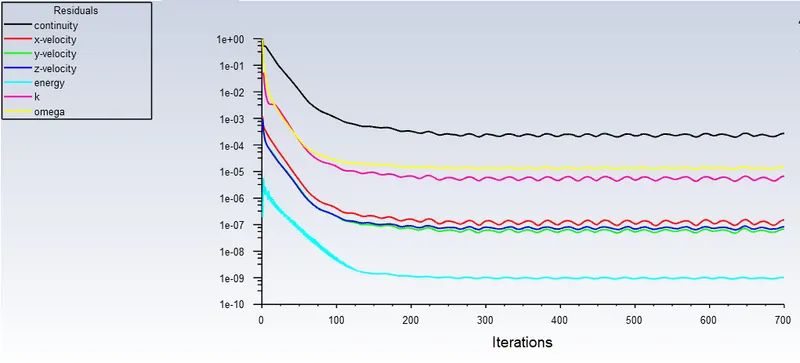
Residual:
Case-3
Velocity = 5 m/s
Max Temperature = 356 K
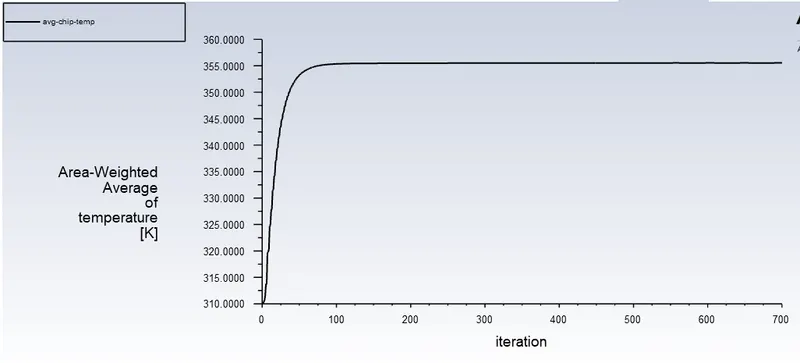
Area weighted average temperature plot:
Avg. temperature = 355.5 K
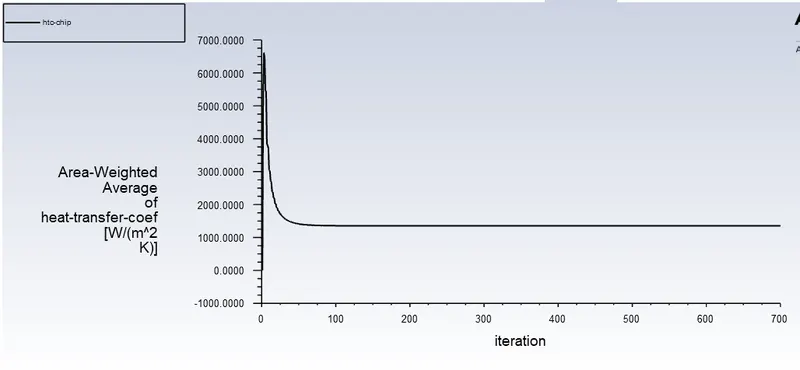
HTC:
HTC = 1352.6 W/(m^2 K)
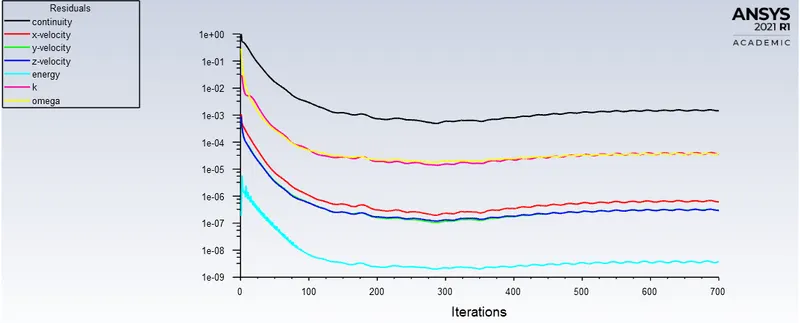
Residual:
Hotspots:
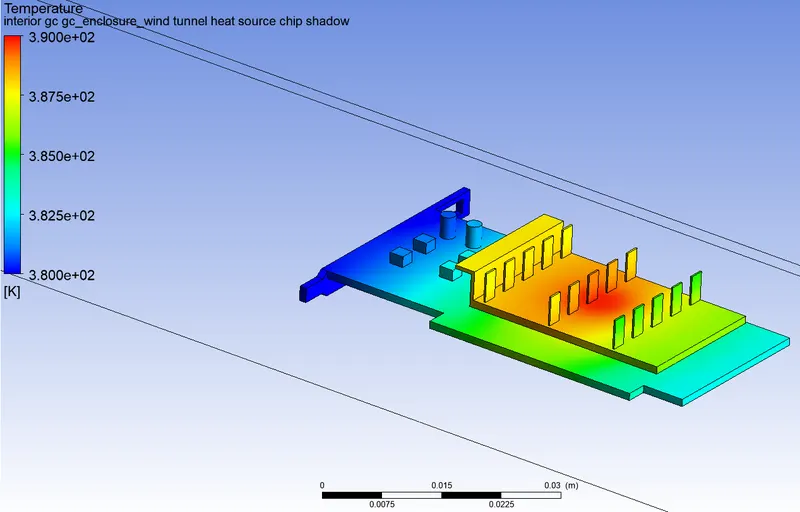
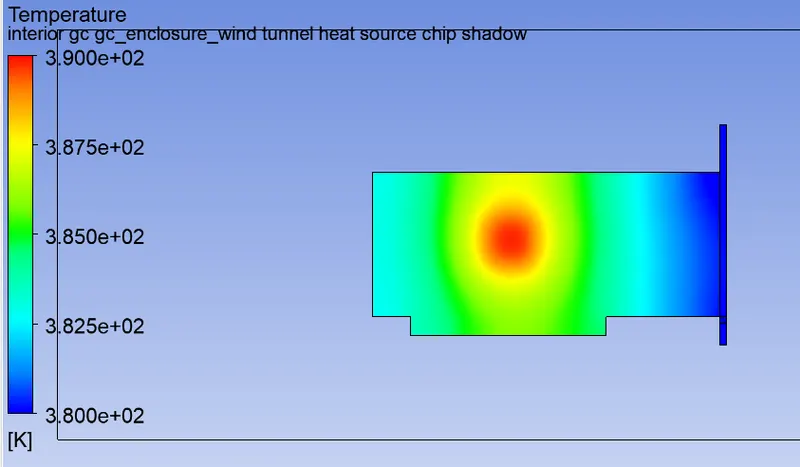
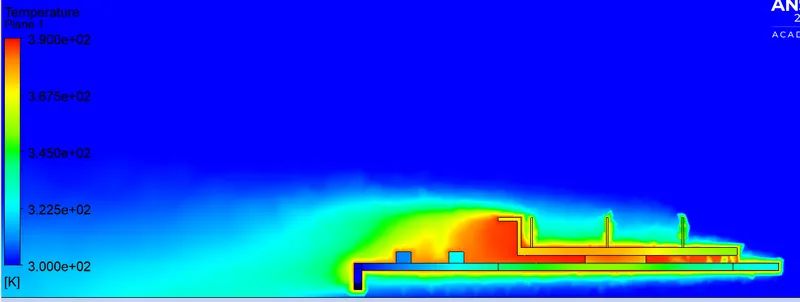
Note: The contours for hotspots were generated for case 2(inlet velocity = 2.5 m/s) by keeping the lowest temperature at 380 K and max temperature at 390 K. this was done because the lowest temperature in the system was only 300 K and that hindered visualization of hotspots in contour form.
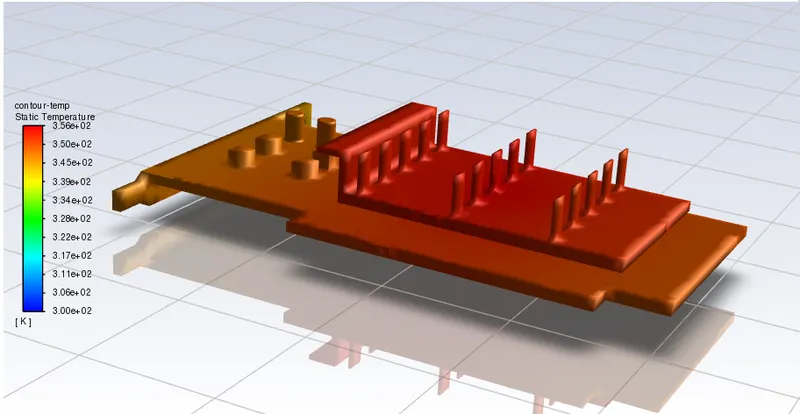
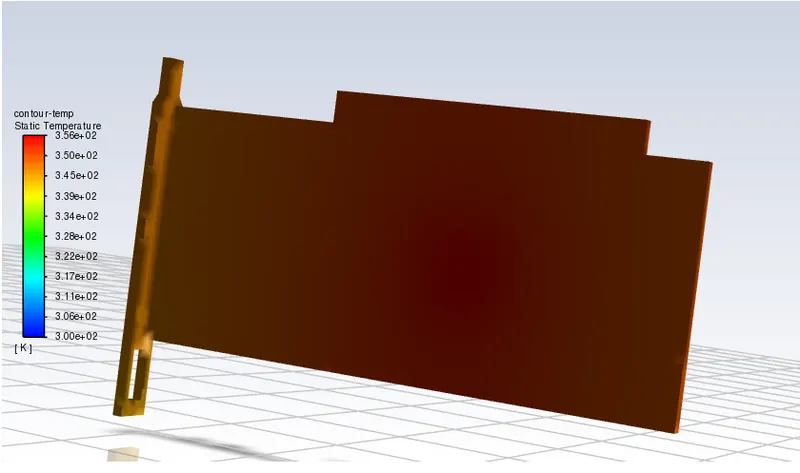
Temperature contour in case-3, same as case-1, with negligible difference in the contour.
Hence it is important to note that temperatures lower than 380 K are not represented correctly here, but can be represented in a better colour gradient by adjusting the lower limit.
It is also worth noting that in other cases the origin of hotspots generated are identical as the heat source (GPU chip) remains constant, while no other heat generating components are added.
Inference:
- The different mesh settings used for different regions was because:
- We were interested in heat transfer taking place near the graphic card(solid domain) instead of the flowing air (fluid region).
- We were limited my number of cell we can produce (half a million cells)
Hence only the solid region was refined instead of the whole system.
- We confirm the solution has converged as deviations in the residual, HTC and avg temperature graphs normalised.
- It is observed that hotspots in the system lie directly above and below the chip i.e. at the interface of chip and PCB; chip and heat sink. This is because only the chip is considered to be the heat source, if the other components that contributed as heat sources were considered the hotspot distribution in the chip would turn out to be different.
- To minimize these hot spots, for heavier loads (i.e. loads of more than 12 W) that might push the temperature of GPU chip beyond the safe operating temperature(ie more than 90 degree celcius) we could either:
- Increase the inlet air velocity.
- Increase the number of fins or optimize fin design.
- Or incorporate both high velocity and better fin design.
- The most important observation in the simulation is that the GPU can not function in case 1 and 2 since the temperature in both cases exceed 100 degree celsius. And chips either start degrading, stop working and shut down, or become a fire hazard in such temperatures.
Conclusion:
A steady state CHT analysis on a model of a graphics card was conducted successfully.