Week 6 - CHT Analysis on a Graphics card
Aim
to performing a steady state conjugatenheat transfer analysis on a model of a graphics card
objectives
- Run the simulation by varying the velocity from 1m/sec to 5m/sec for at least 3 velocities and discuss the results.
- Find out the maximum temperature and heat transfer coefficient attained by the processor.
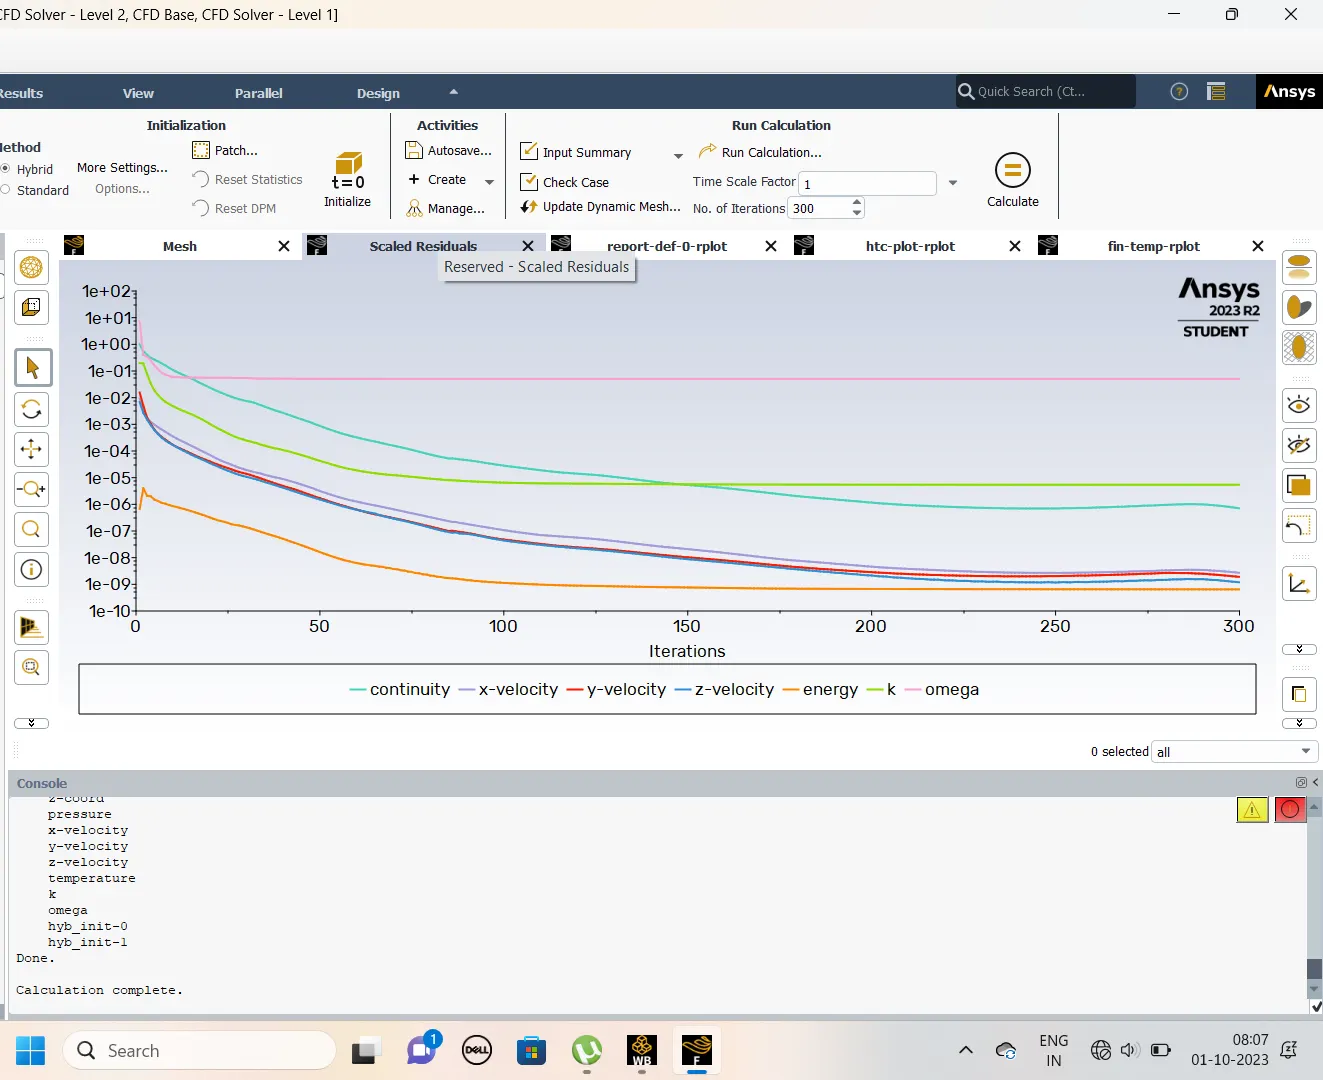
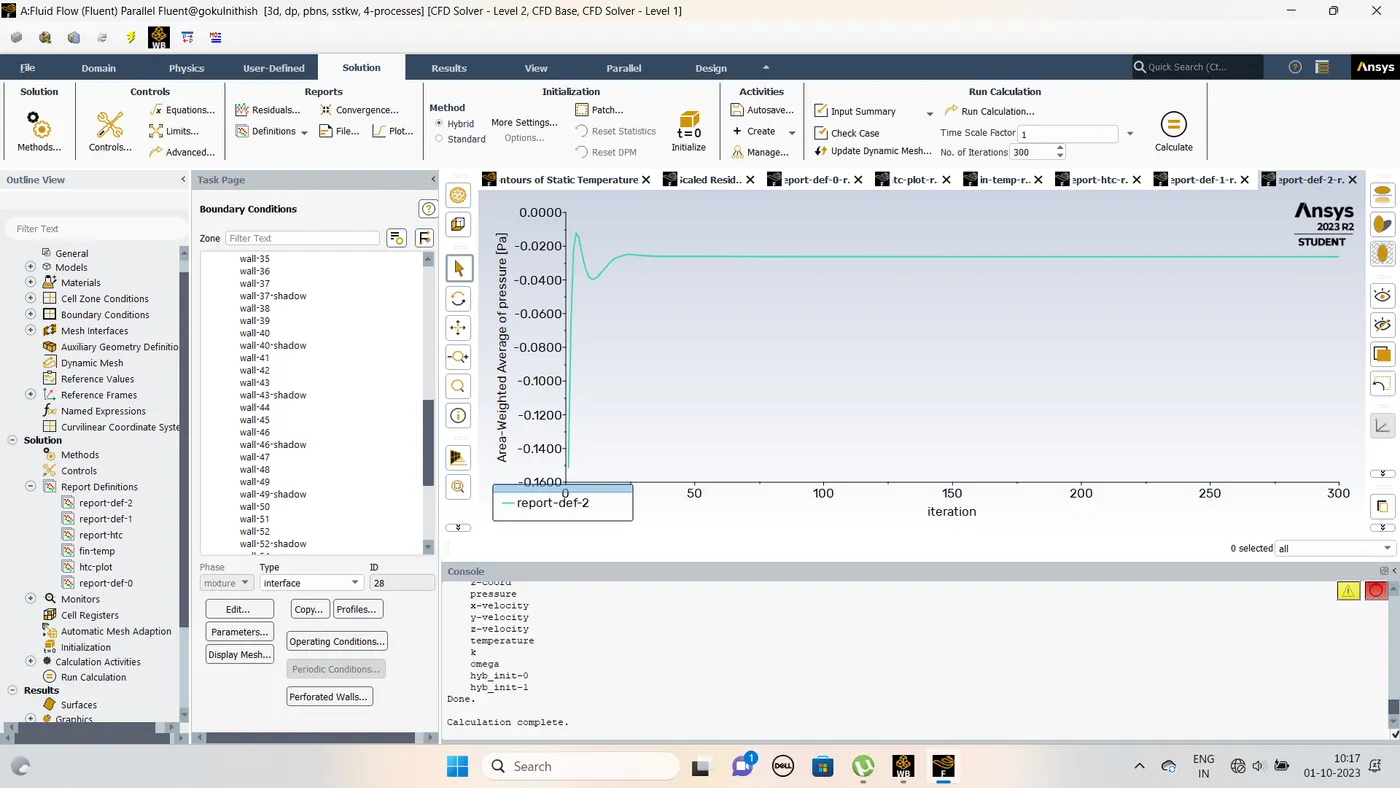
- Prove that the simulation has achieved convergence with appropriate images and plots.
- Identify potential hotspots on the model.
The geometry considered for the current study is a simplified model of the graphics card. The entire card can be classified into three major regions: 1) base of the card, 2) processor and 3) fins. The base of the card includes everything on the card except the processor and cooling component fins. The base is made FR-4 material which is the most commonly used graded synthetic materials for designing PCB. The processor will act as the energy source because of the heat generated due to the supply of the electrical power and is assumed to be made of silicon. The fins provide convective cooling to the processor so that there are no thermal damages on the graphics card. The fins are assumed to made of standard aluminium available in Fluent database.
Spaceclaim
Open the Geomtry through the spaceclaim
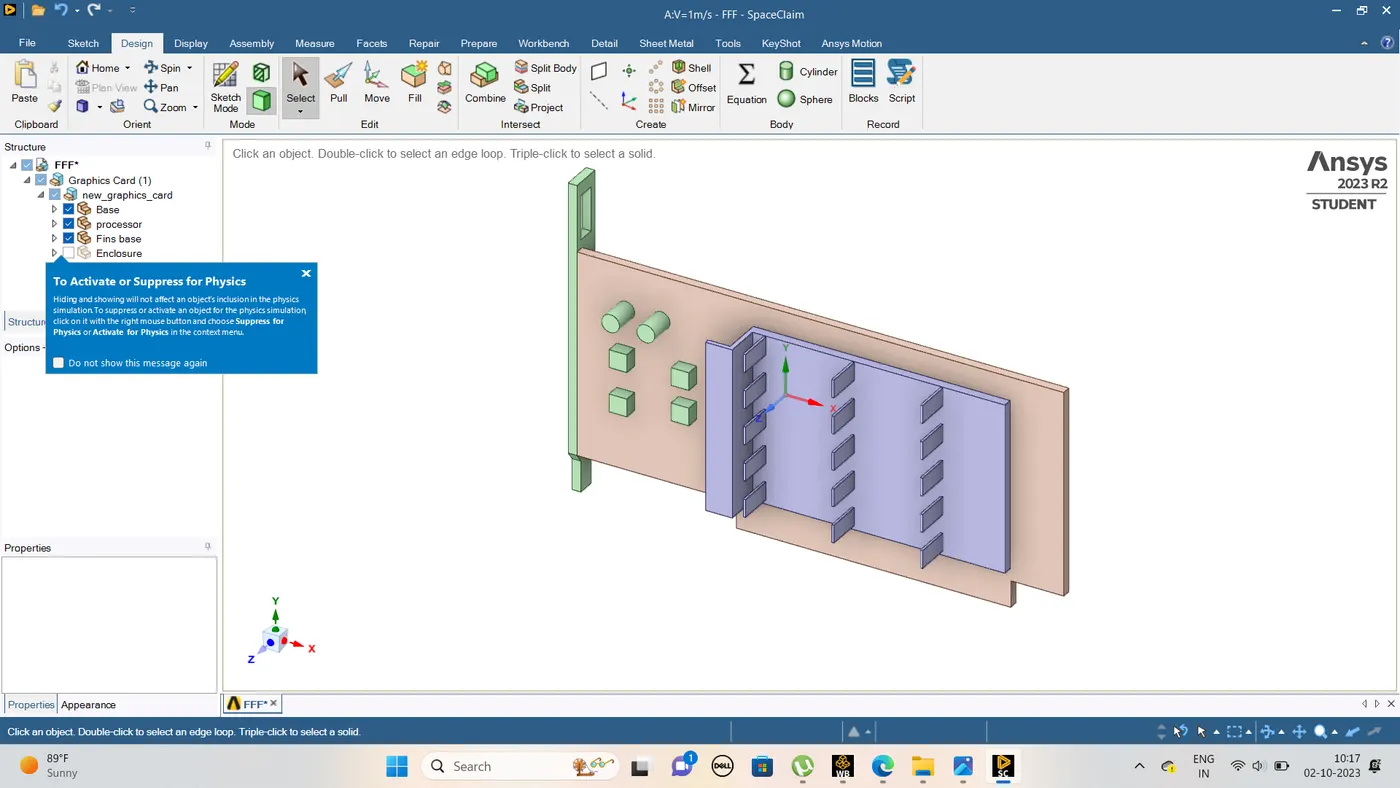
Create the enlosure and Share the Toplogy
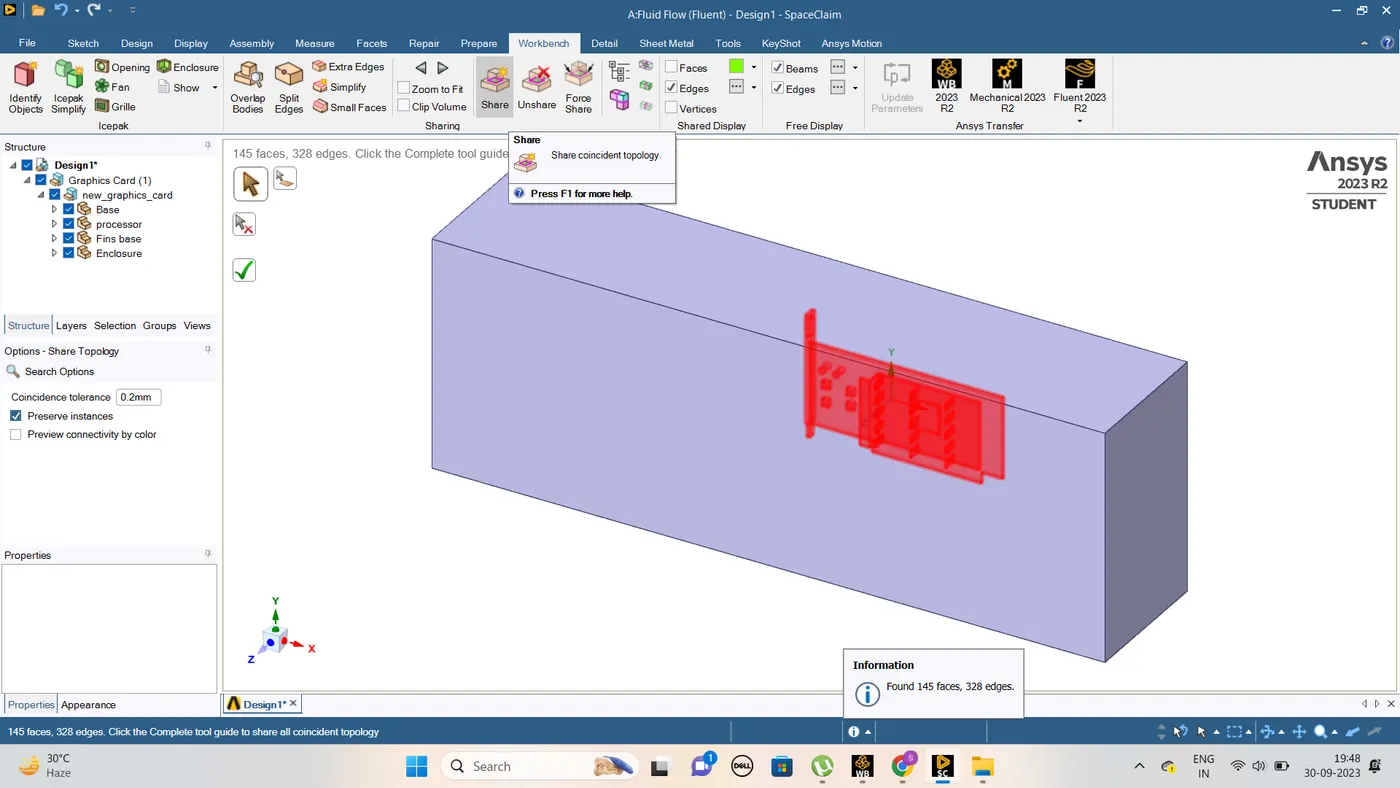
The processor is assumed to be powered with 1 W supply and further its assumed that entire power is converted in thermal energy. Therefore, from simple energy density calculation we can determine the thermal source term.
The working fluid which flows in the enclousre for cooling the card is standard air from the Fluent database. The thermodynamical and physical properties of these materials will be discussed in detail in the Case Setup section.
To solve the Conjugate heat transfer problem, we use the share tool in the Ansys SpaceClaim toolkit, so that we are able to generate conformal mesh. The entire geometry and its components which are discussed above are visualized in the following figures.
Meshing
For this study, we considered two types of meshes for understanding the dependence of the grid on the flow parameters. The first mesh that we use for the simulations has body sizing for each of the components of the graphics card. The enclourse body sizing is of 0.5 mm while the components have a element size of 0.5 mm.
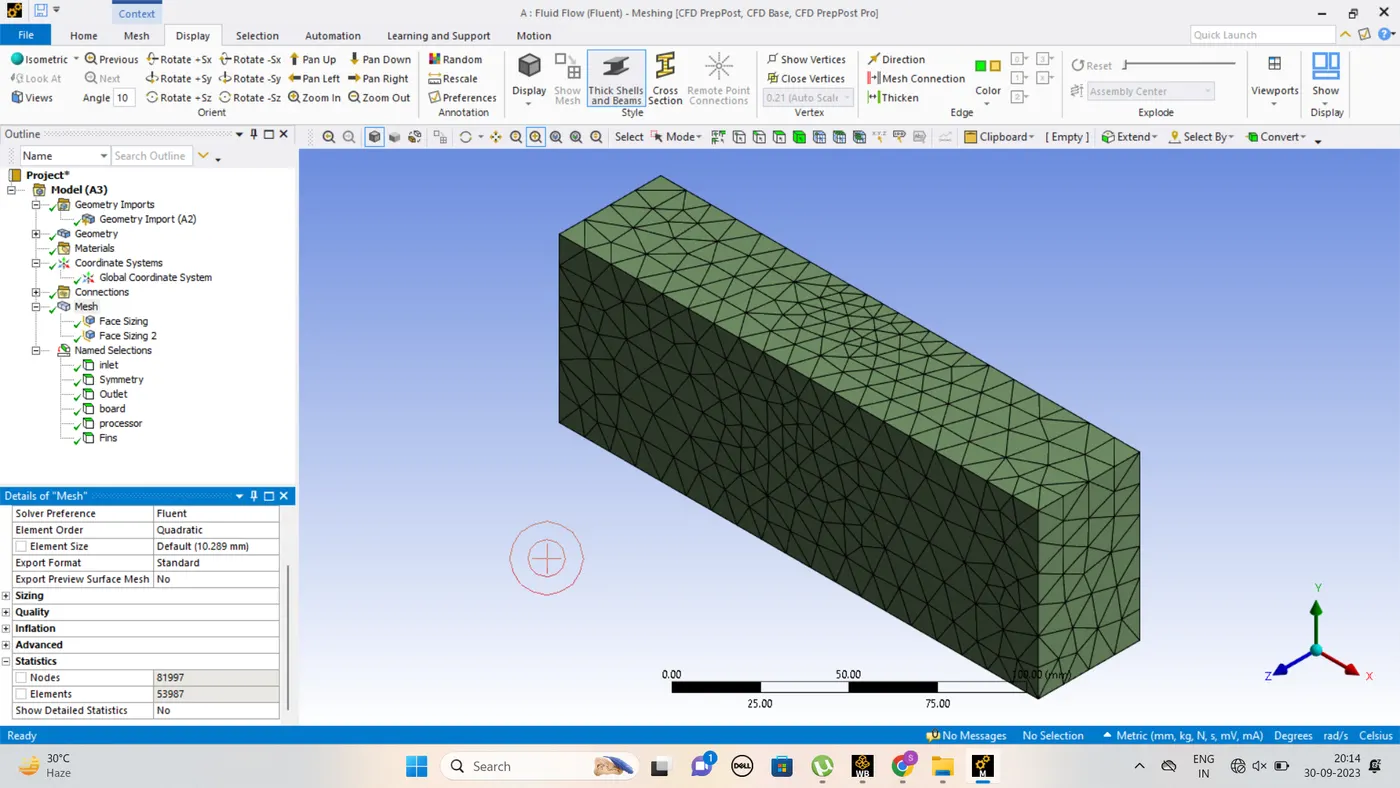
The Second mesh is a base mesh generated using hexa dominant method in the Ansys Meshing toolkit. In the baseline mesh, we add body sizing of 1mm as the hybrid initialization of the simulation with default parameters diverged.
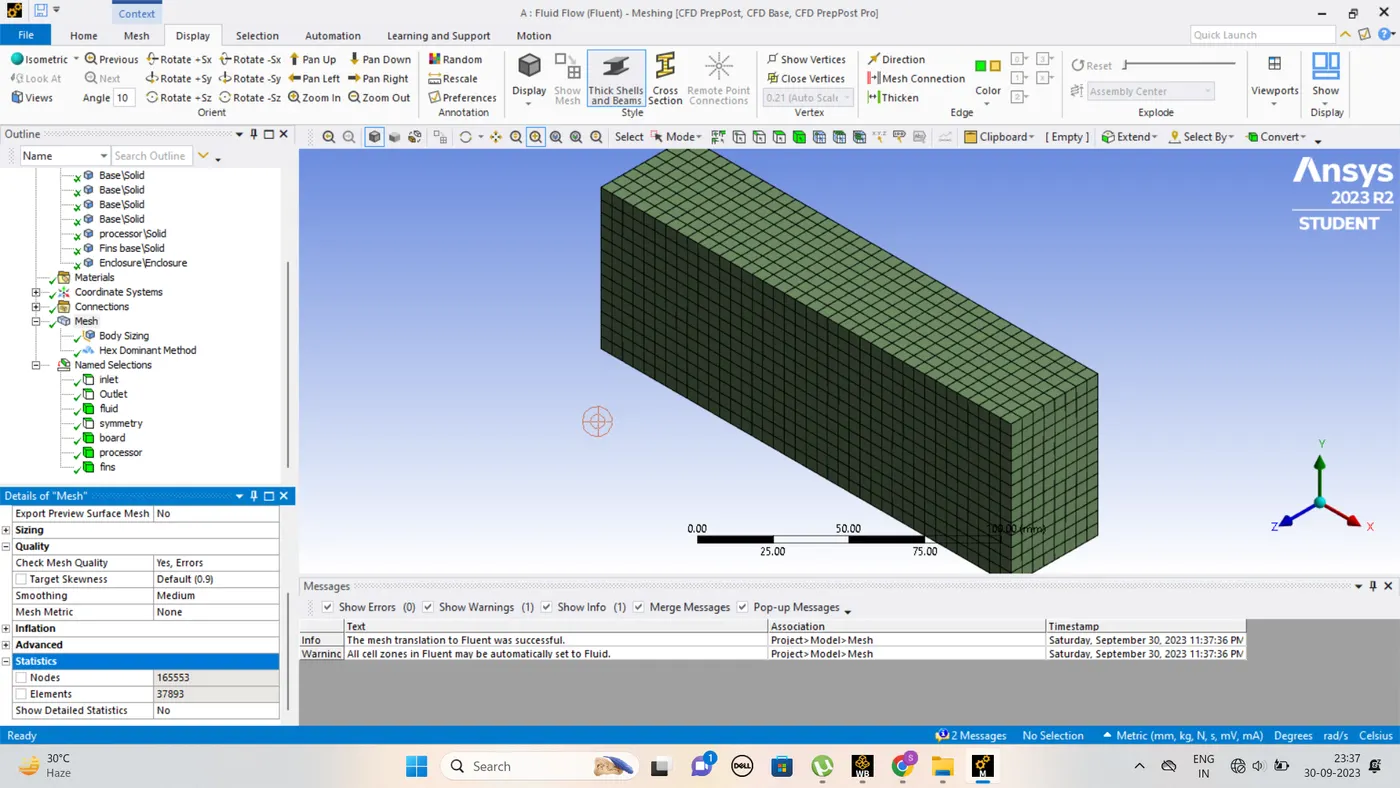
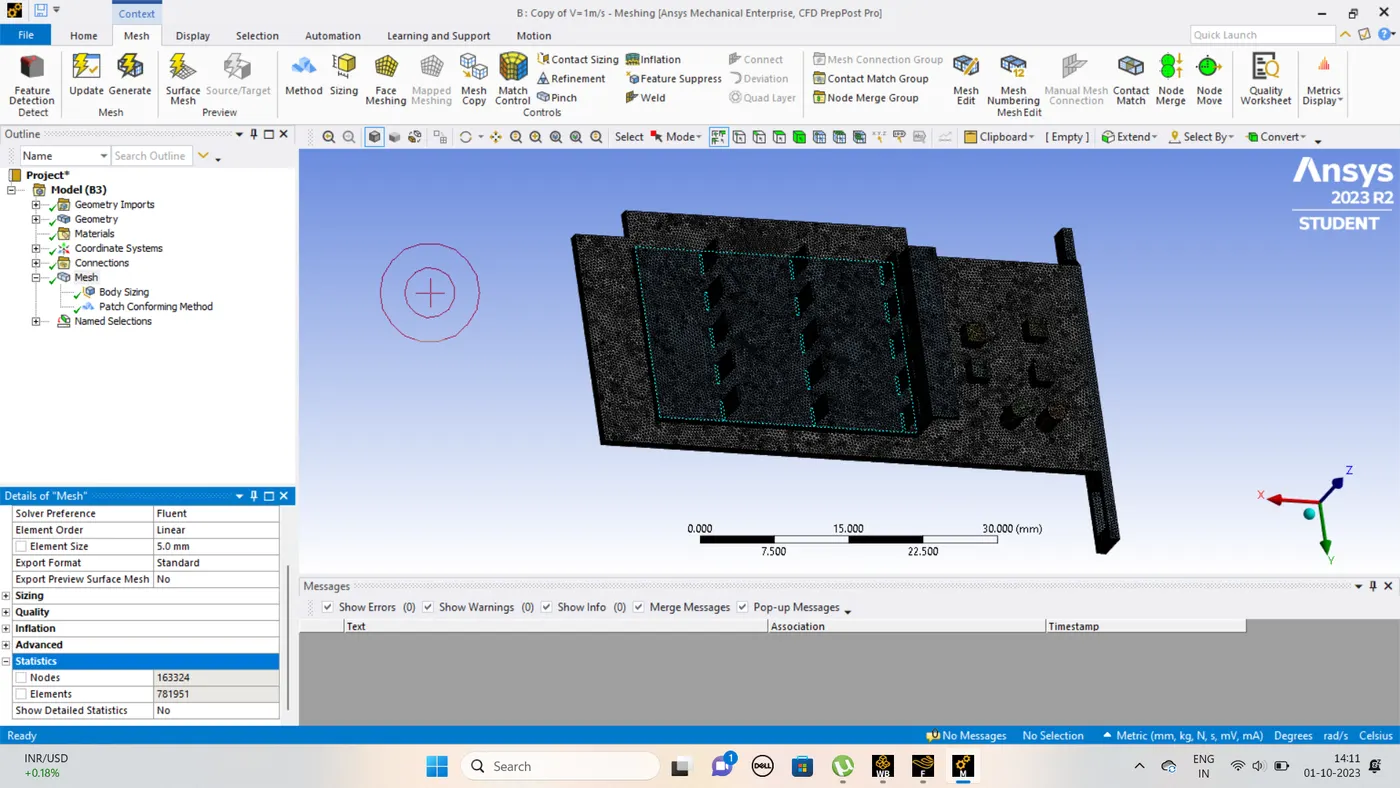
| Mesh size | Cells count |
| 1mm | 53897 |
| 0.5 | 73951 |
Case setup:
- The case setup is almost identical for all the cases in this study. The settings chosen in the Ansys Fluent GUI are as
- follows:
- Pressure based -Steady state solver -Creating the materials
- Board - Polysterene
- Fin -Aluminium
- Processor -Silicon and the material and values
- Inlet value velocity - 1m/s
- Create a Plot
- Processor -Heat transfer coefficient plot
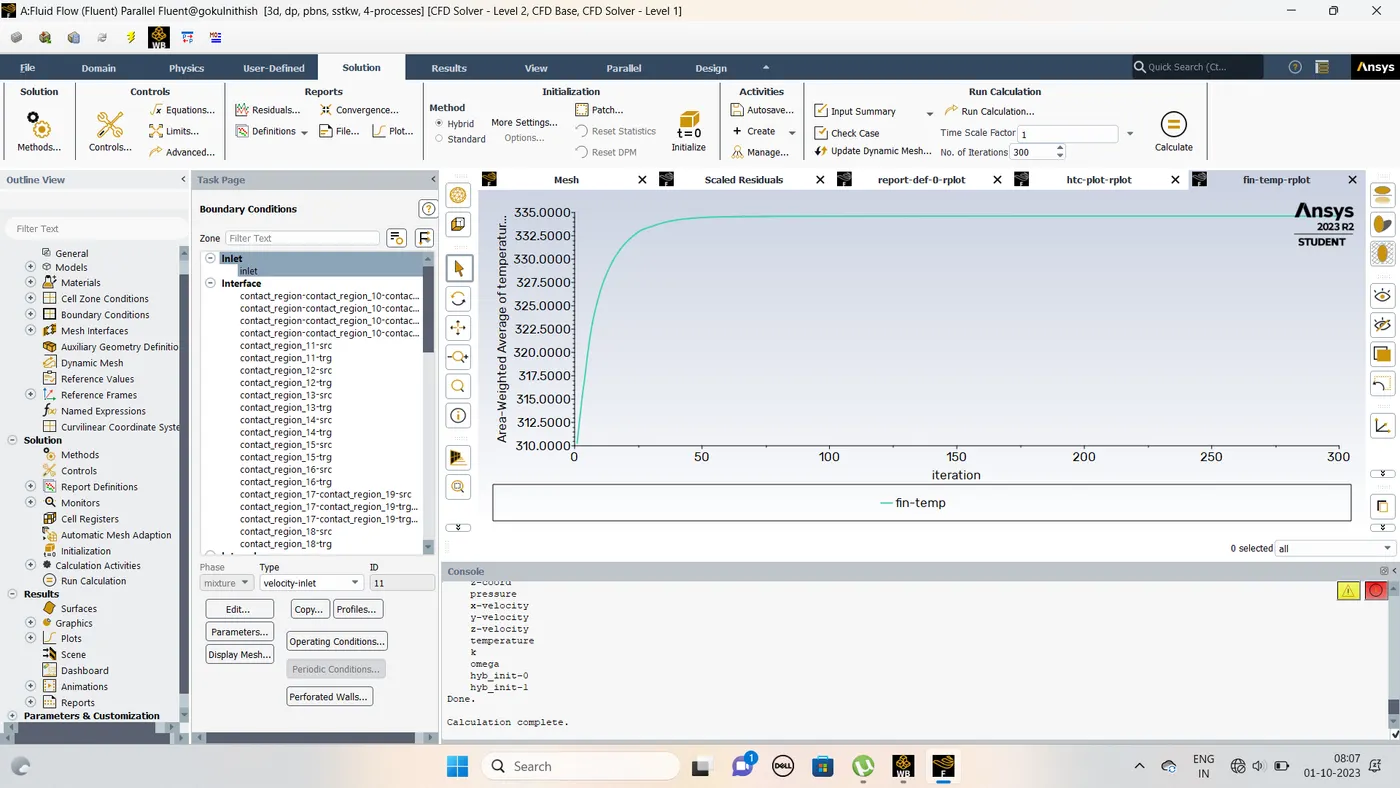
- Fin - Temperature plot
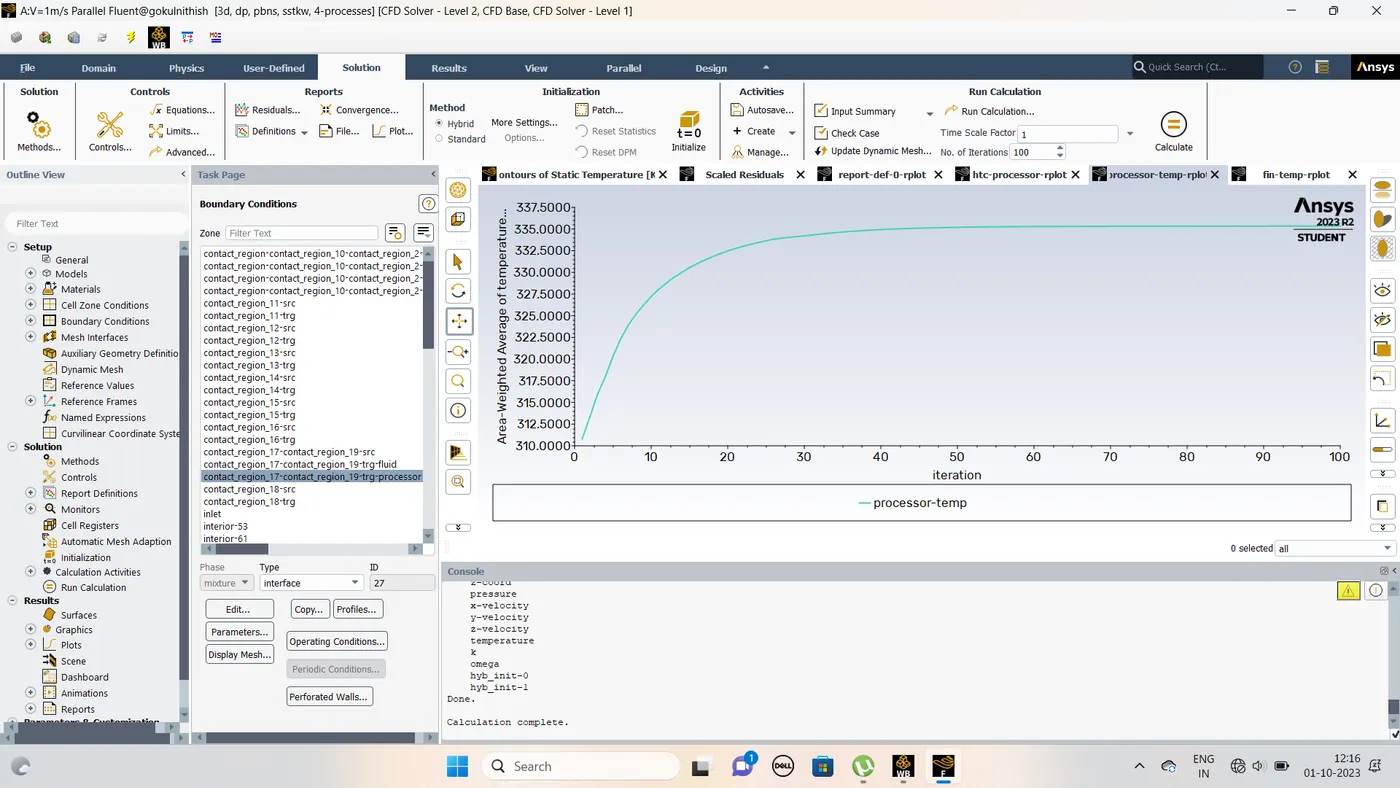
- Processor - plot
- Initialized and run calculation around above 300 iterations
- Then showed below details
- Velocity -1m/s
Residual plot
Fin temperature
Processor temperature
Graphics card HTC
CFD post
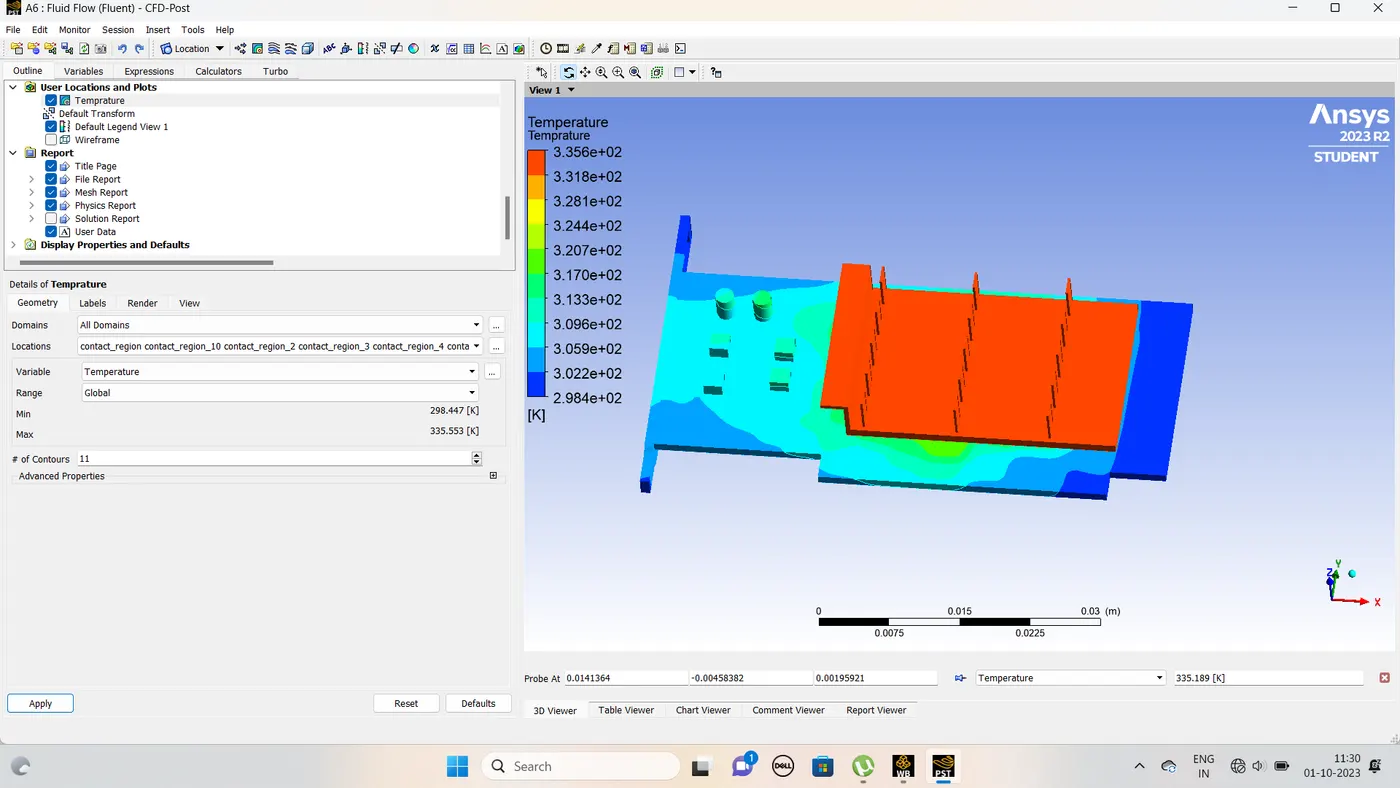
Temperature of (Processor,Fin, Board)
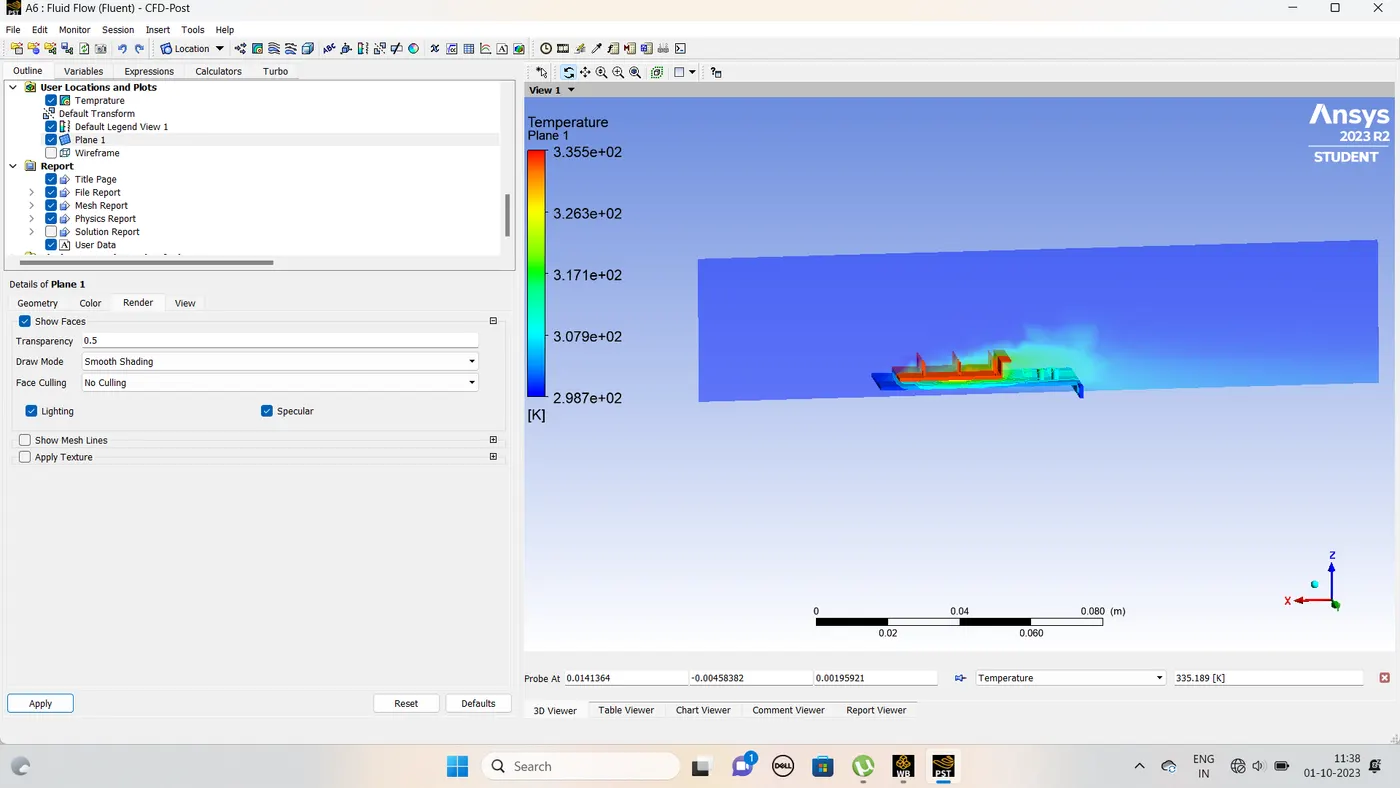
Create a plane Check the temperature
Plane 1
Streamline flow of the board
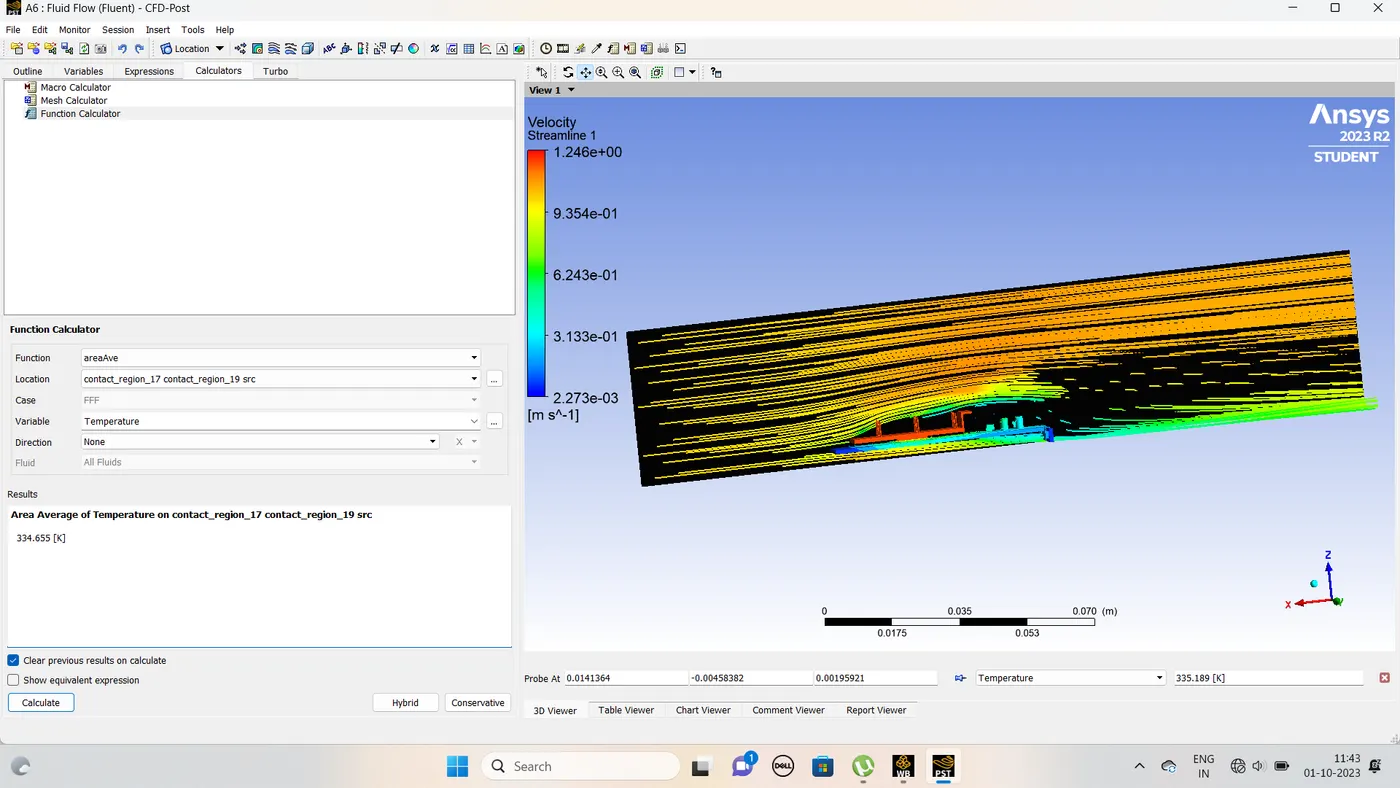
Velocity vector contour
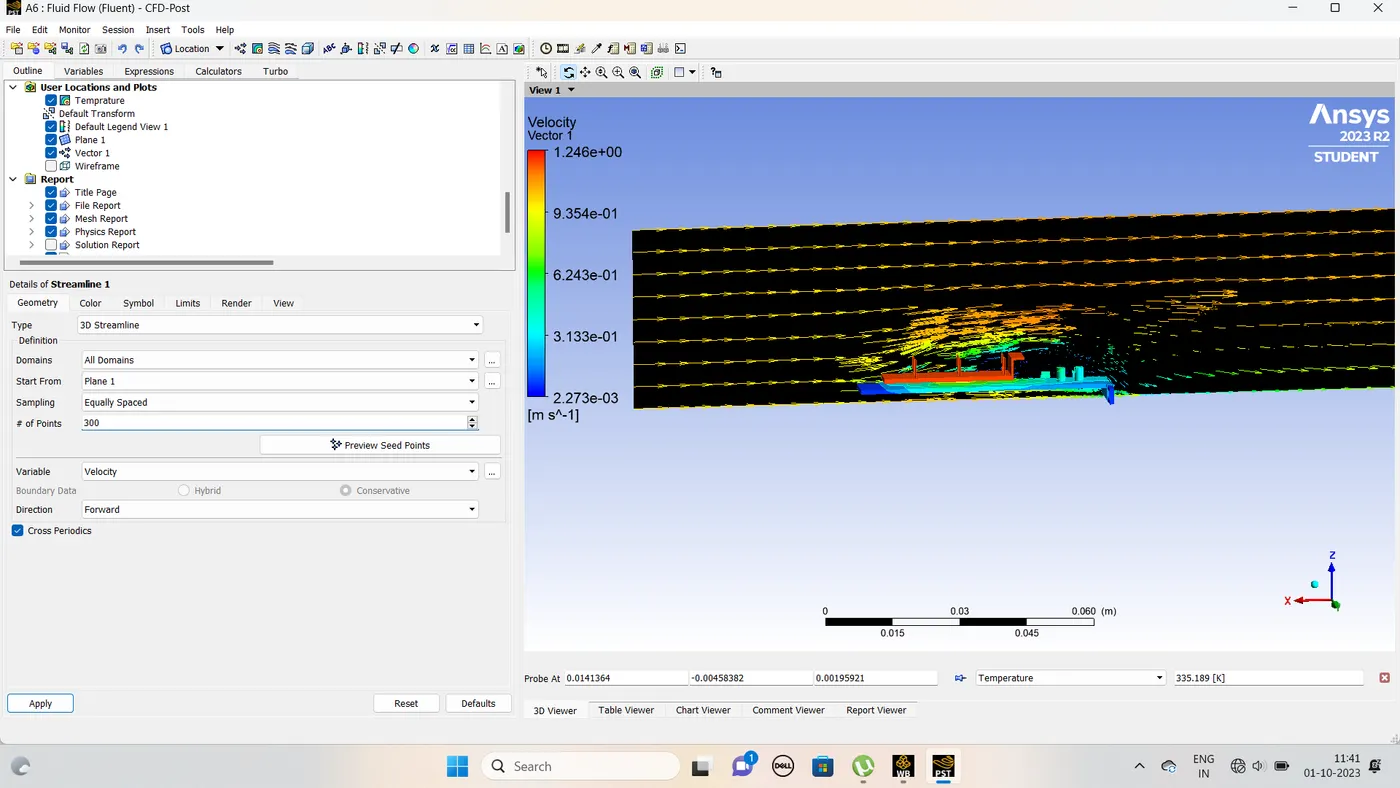
Velocity -5 m/s
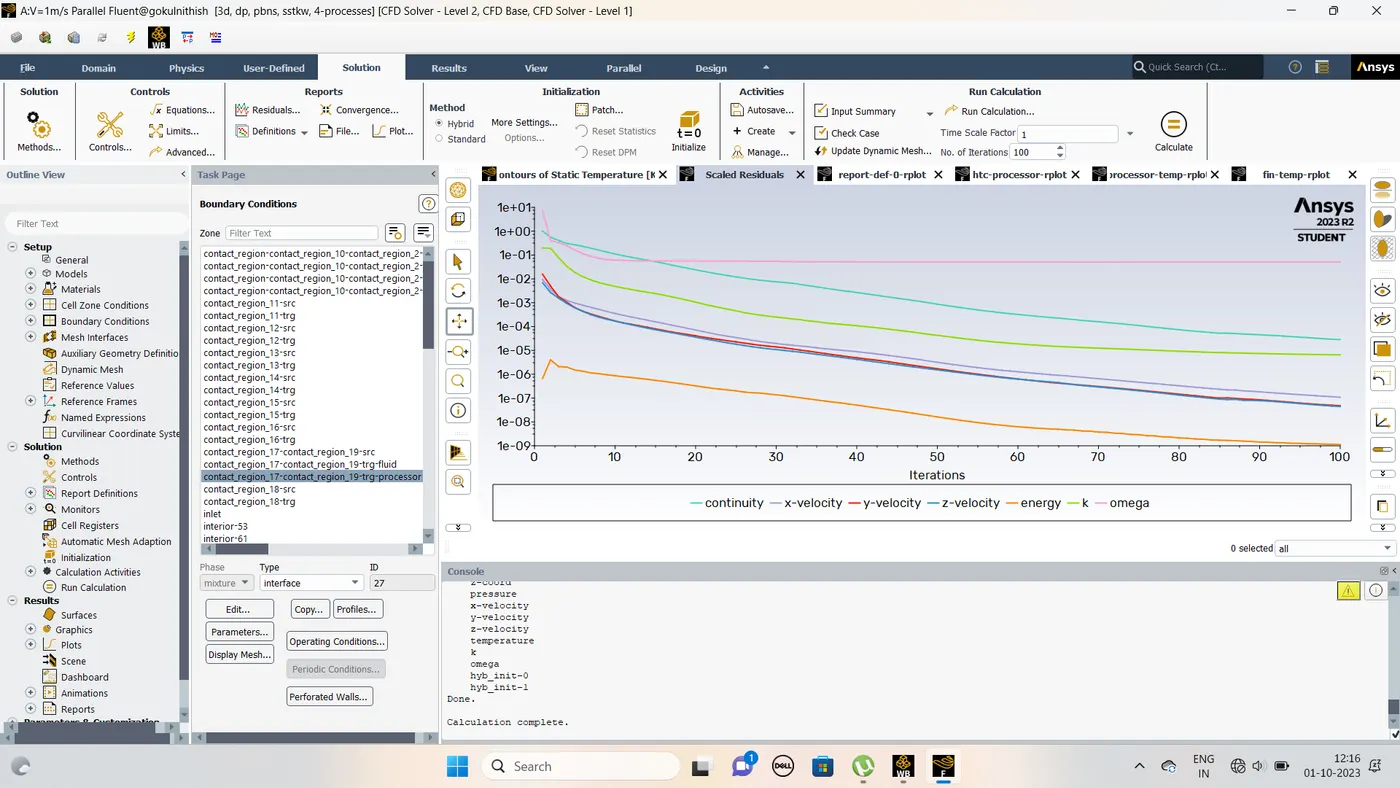
Residual plot
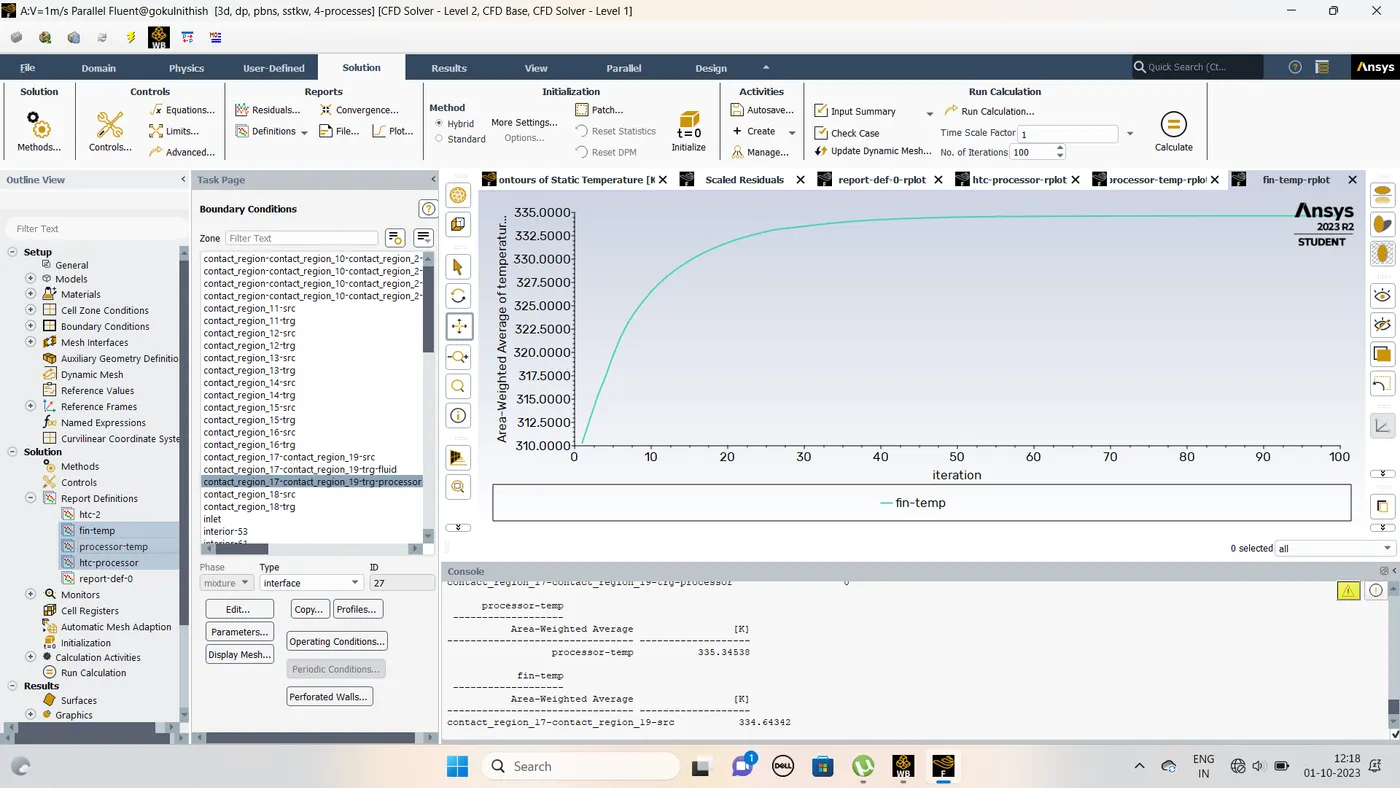
Processor temperature plot
Fin temperature plot
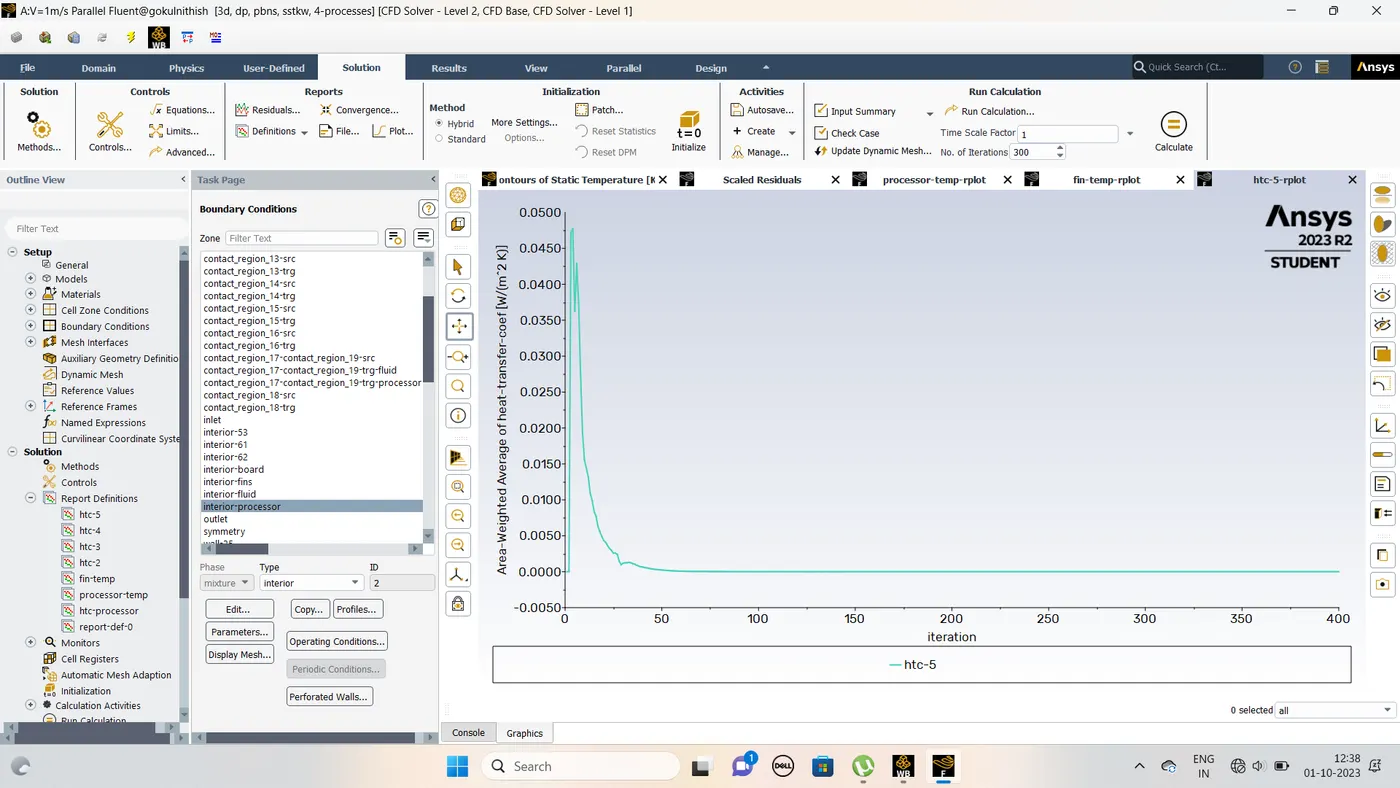
HTC -Processor
Finally checked coarse mesh and refined mesh differnt velocity verified the surface heat transfer depends upon the velocity .
| Velocity | Processor-HTC (W/m^2 K) | Fin temperature (K) | processor temperature (K) |
| 1 m/s | 12.404 | 334.64 | 335.45 |
| 5 m/s | 3.472 | 402.5 | 400.43 |
CFD post
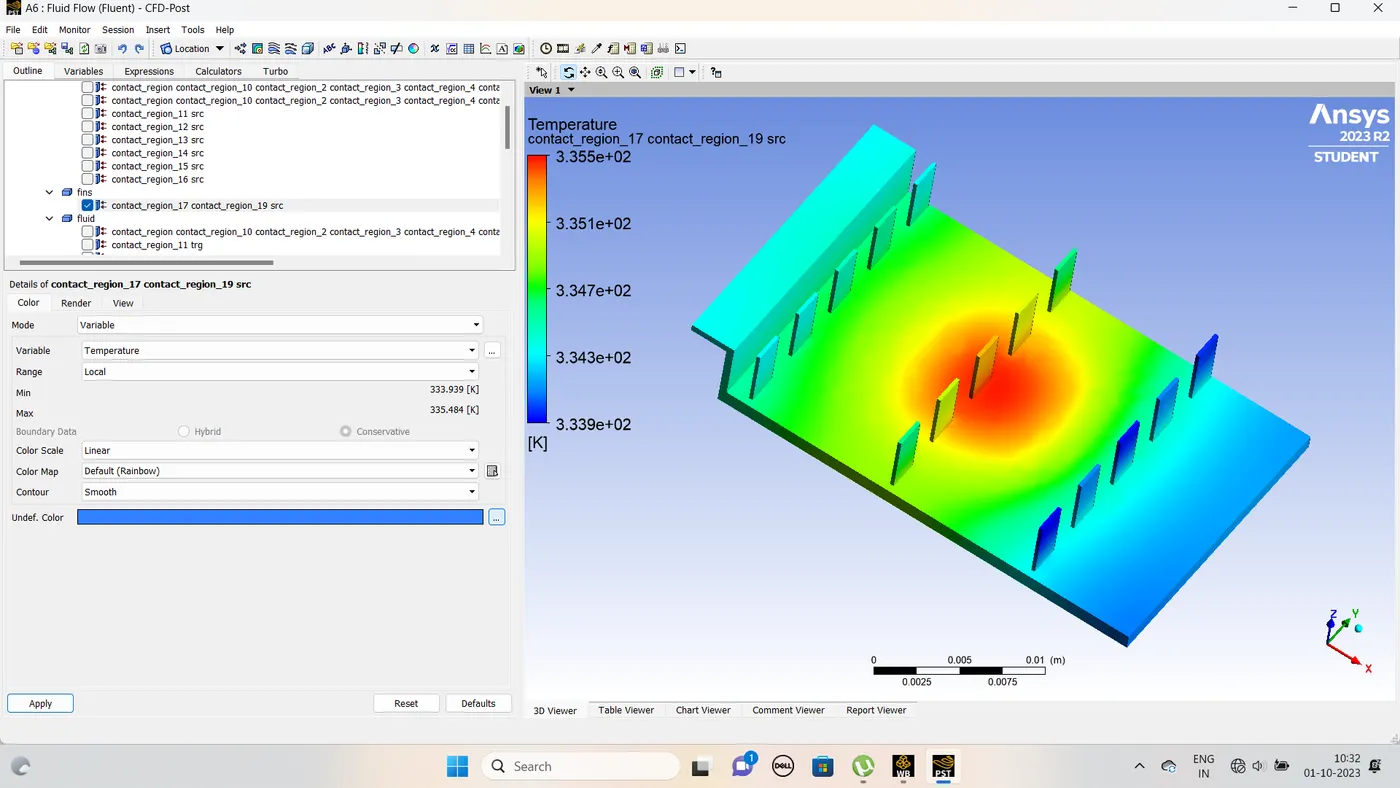
This Snap clearly showed the where the heat is high and how heat transfer to the proceesor to fin.
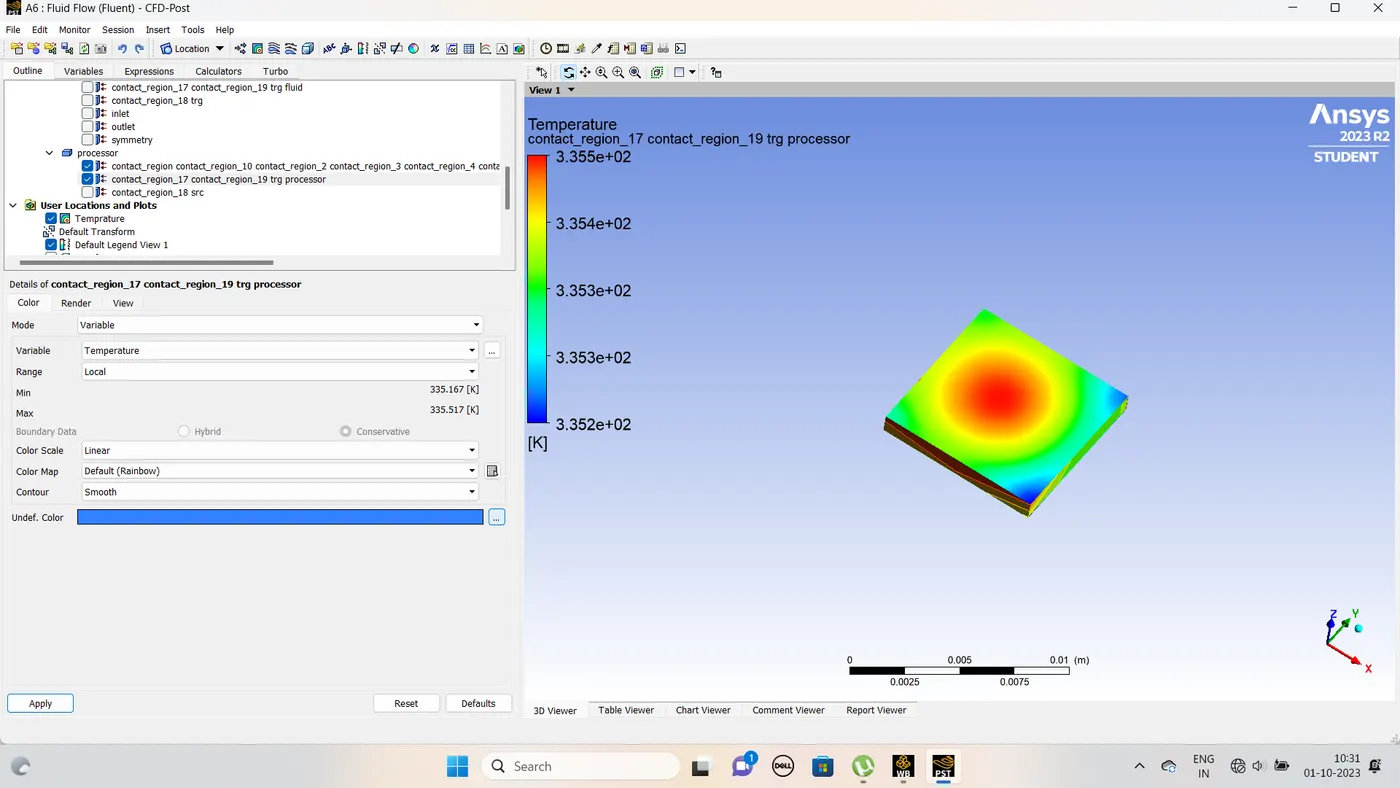
This snap clearly showed specific reegion high heat heat generated.
Conclusions
From the above plots and contours we note the following observations and conclusions:
- Residuals do not provide information on the convergence to the steady state of the flow.
- The temperature monitor for all the three cases reach a steady state value and proves to be a great indicator of the convergence of the steady state problem.
- As the velocity decreases, we observe that the thermal hot-spots are much stronger in magnitude and have an impact on larger regions of the graphic car. This observation is inline with the theoritical expectation of the effects of the convective heat transfer.
- The heat transfer coefficient near the fins is highest for inlet velocity of 5m/s. This observation is inline with the experimental trend.