Week 1- Mixing Tee
Aim
- To verifying the steady state simulations to compare the mixing effectiveness through the mixing tee.
Introduction
- Created the two versions the mixing tee one of them is longer than the other.
- Short mixing tee hot inlet velocity of 3m/s,Momentum ratio of 2,4.
- Long mixing tee hot inlet velocity of 3m/s,Momentum ratio of 2,4 we value that cell count,Average ouutlet temperature,Number of iteration.
Theory
- Turbulent mixing of fluid of different temperature in T-junction geometries became of significant importance in the field of nuclear reactor safety.Since it can lead to highly temperature fluctuations at the adjacent pipe walls,cyclic thermal stresses in the pipe walls and consequently to thermal fatique and failure of the pipeline.Thermal striping and mixing in general is however challenging to predict by using common CFD simulation and turbulance modelling approaches.
Procedure
Pre prcessing
- open Ansys software and Fluid flow fluent open the option.
- Then show the dialoque box . Open the model through the ansys software
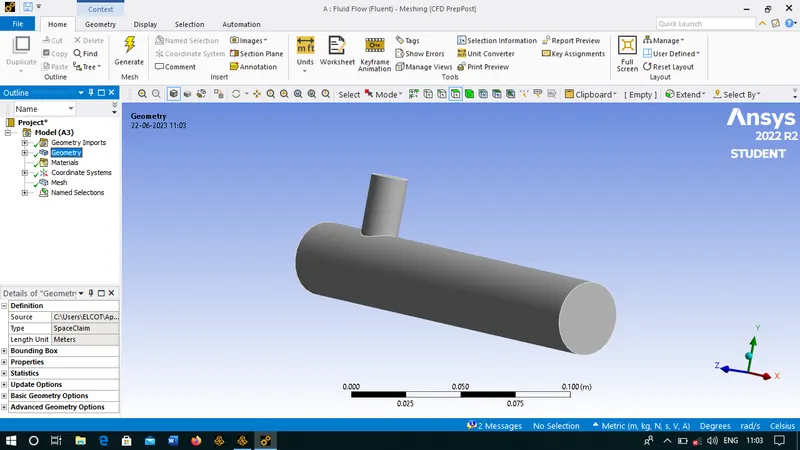
- start the geometry cleanup of the model.open the Spaceclaim options unwanted surface removed through the volume extract.
- We need inside volume inlet x,inlet y ,outlet volume.Provide name inlet x, inlet y ,outlet suitable name given.
Meshing
- Mixing tee took the suitable name and materials properties
- next step start the meshing
- Mesh-metric display-metric graph-element quality
- Check the mesh values and value of graphs.
- Meshing of the value done .
Solving
- First set the model -viscous model select k-epsilon and select standard wall function
- Go to the solution give boundary condition value horizantal inlet velocity(x) 3m/s and temperature 36degree celcius.Vertical inlet (y) velocity 6m/s
- Set gauge pressure is zero.
- Next step initialize the value zero.
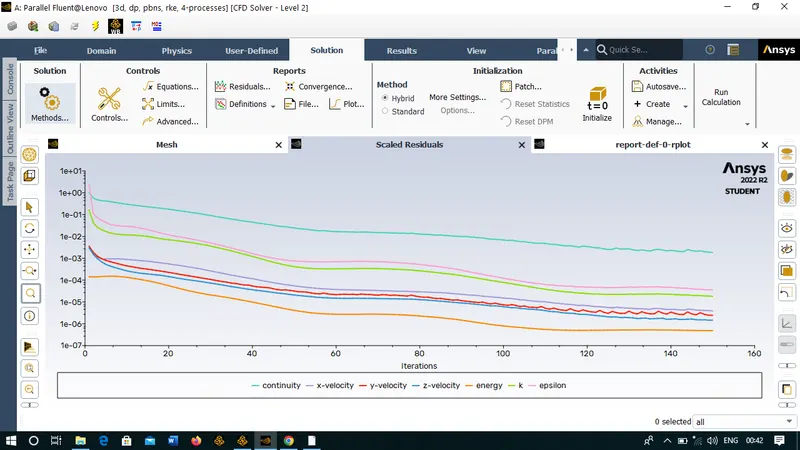
- Run calculation give the iteration value 150 and 300 etc..
- Finally we get the contour plots .
- Depend upon the iteration value.
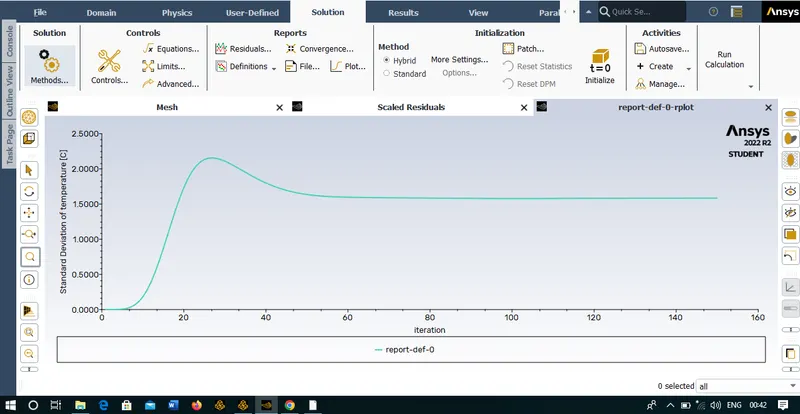
- Residuals plots show the graphs velocity and temperature.
Post processing
- The mixing tee inlet and outlet boundry negligble.
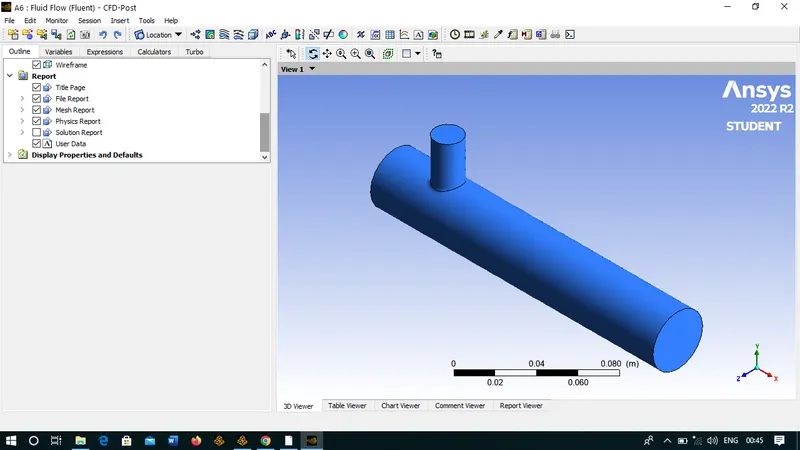
- Wall volume one present and select the double click render -transparency value (0.756)
- Next step insert-location-plane 1.
- Created the wall colour is changed white colour.
- Select the plane apply show the mixing effectiveness.
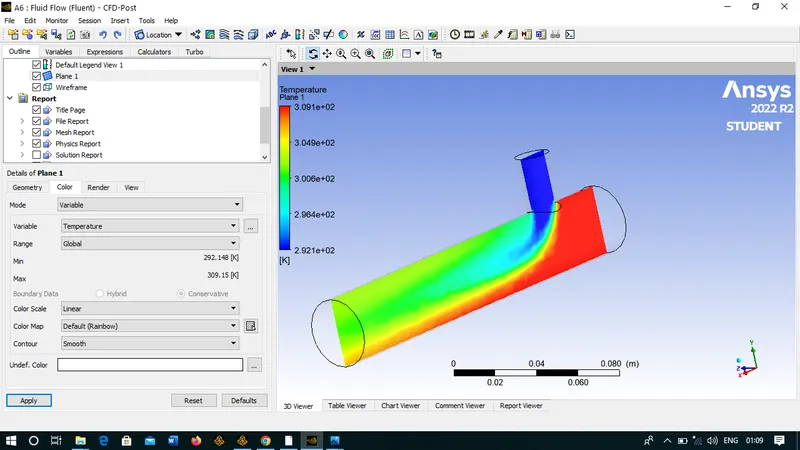
Result
|
Inlet velocity&Temperature (X) |
Inlet veloicity&Temperature (y) |
Outlet temperature |
| 3m/s,36 Degree (C) | 6m/s,19 Degree (C) | 26degree (C) |
Finally verified the steady state simulations mixing tee effectiveness through ansys software.
My project file link:
https://drive.google.com/file/d/1HIILR2F8NV3CbLP8VWdMHUp6XUkJSlPx/view?usp=drivesdk