Week 6 - CHT Analysis on a Graphics card
Aim --> To do CHT (conjugate heat transfer) analysis on a graphics card model.
Objectives:
- Run the simulation by varying the velocity from 1m/sec to 5m/sec for at least 3 velocities and discuss the results.
- Find out the maximum temperature and heat transfer coefficient attained by the processor.
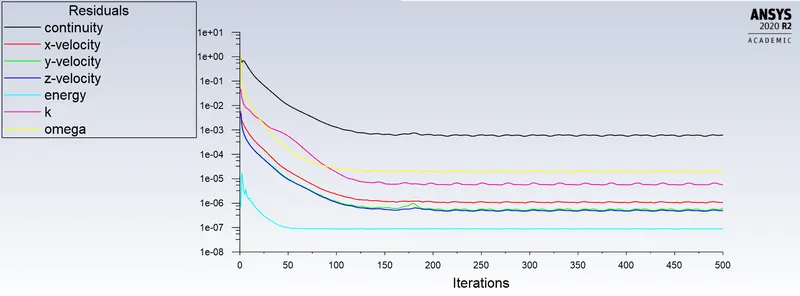
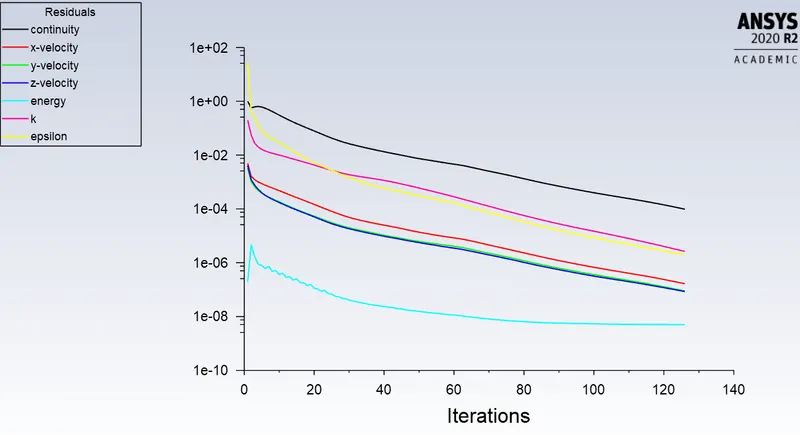
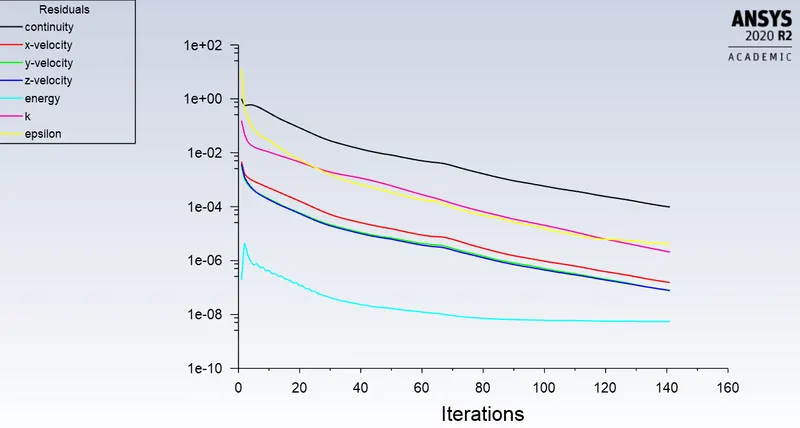
- Prove that the simulation has achieved convergence with appropriate images and plots.
- Identify potential hotspots on the model.
Introduction
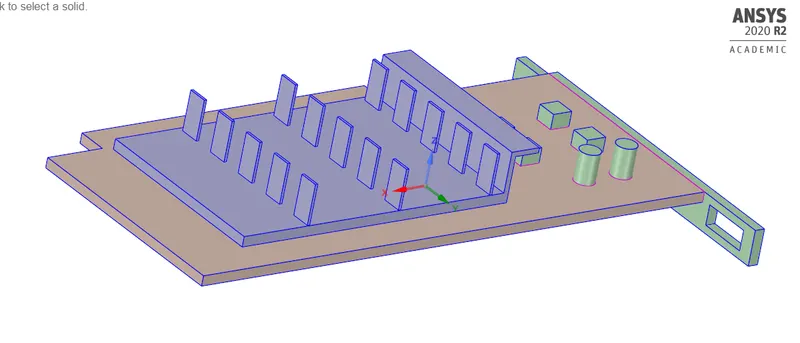
We have to perform Heat transfer analysis on the following model of the computer graphics card. Our model is very basic and it contains all the important features of a normal graphics card. In this project, the air is blown at some velocity over the graphics card, heat is generated inside the processor which is conducted by fins and base, and it is convected by the moving air.
Graphics Card model
Components of graphics Card
1. base --> It consists of the PCB (printed circuit board) base with the components as shown. Material used for PCB is FR-4. It is a glass-reinforced epoxy laminate material that is commonly used in PCB’s. The material is known to retain its high mechanical strength values and electrical insulating qualities in both dry and humid conditions. FR stands for “flame retardant”.
Density = 1850 kg/m^3
Heat capacity = 950 J/Kg-K
Thermal conductivity = 0.29 W/m-K
2. Processor --> material used for the processor is Silicon.
Density = 2000 kg/m^3
Heat capacity = 710 J/Kg-K
Thermal conductivity = 150 W/m-K
3. Fins base --> material used for fin material is Aluminium.
Density = 2719 kg/m^3
Heat capacity = 871 J/Kg-K
Thermal conductivity = 202.4 W/m-K
Input Parameters
Inlet velocity of air = 2,4,5 m/s.
Heat generation = 23437500 m/s. (Heat generated inside processor)
Geometry
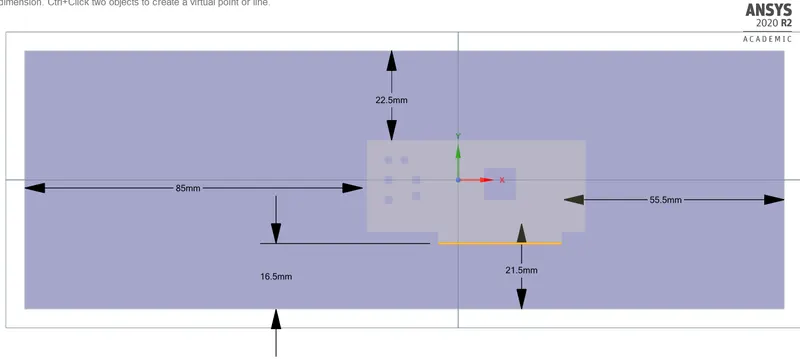
The geometry dimensions with enclosure dimension are as follows -->
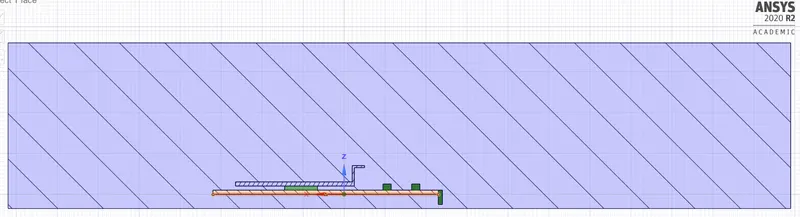
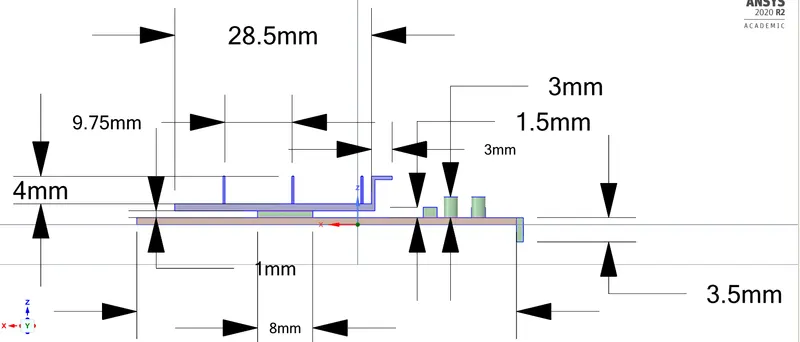
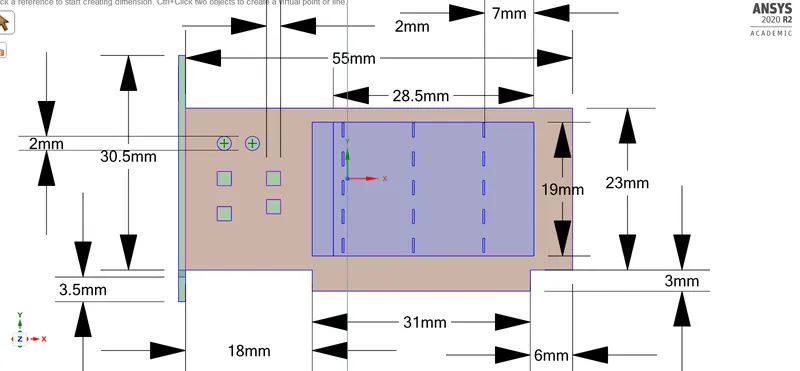
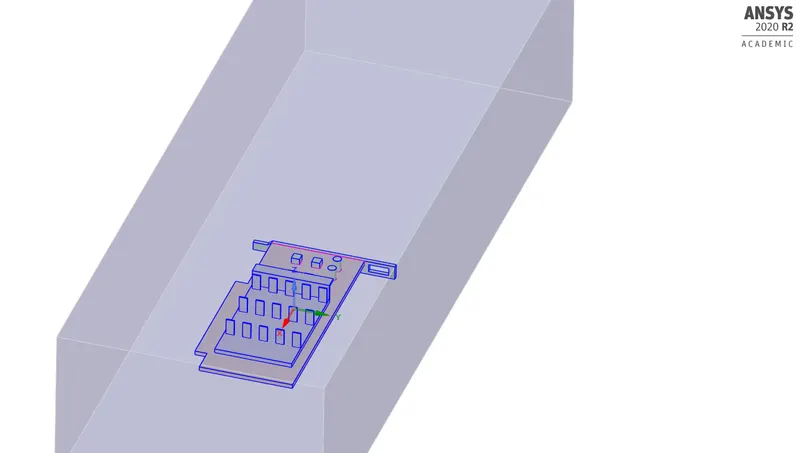
After enabling share topology to generate conformal mesh, we get the following geometry.
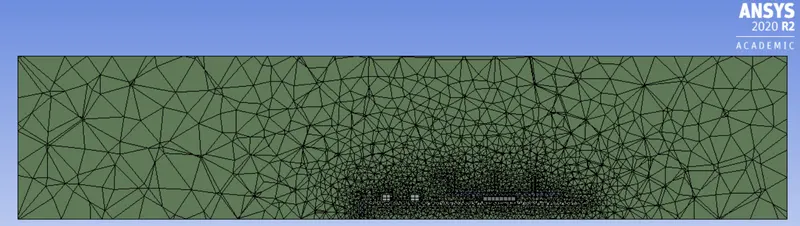
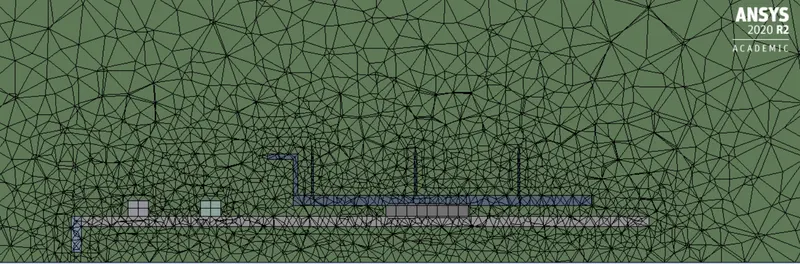
Mesh settings (base mesh)
Element size = 10 mm.
1. PCB base body sizing
element size = 1 mm
capture curvature = yes, 18 deg
2. Processor body sizing
element size = 1 mm
capture curvature = no
3. Fins body sizing
element size = 1mm
capture curvature = no

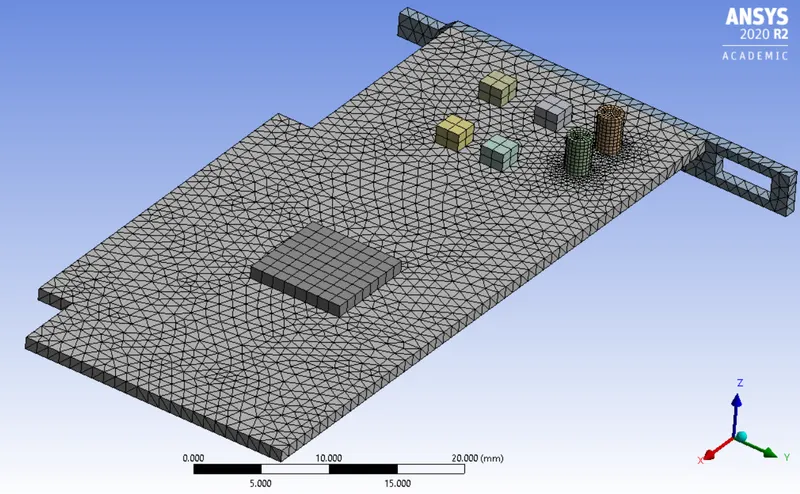
Graphics card
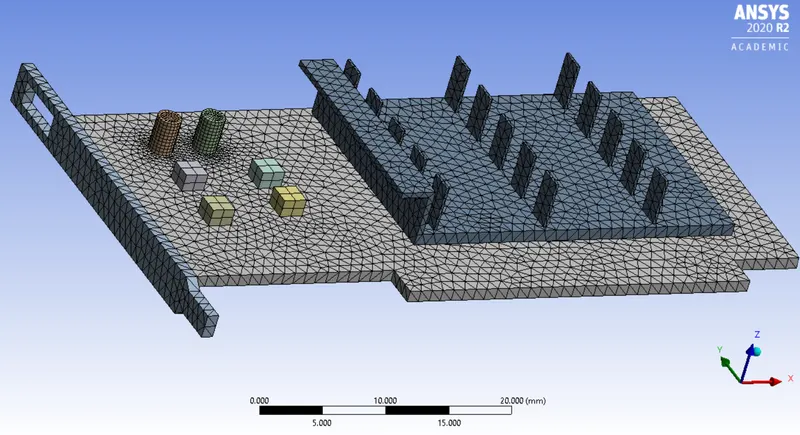
Processor on the base
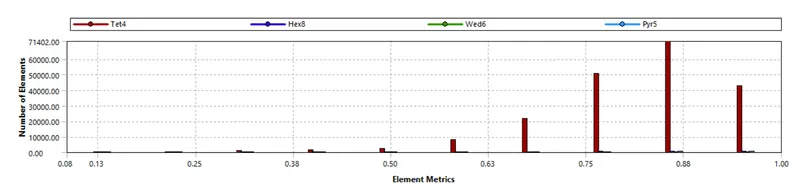
Element quality
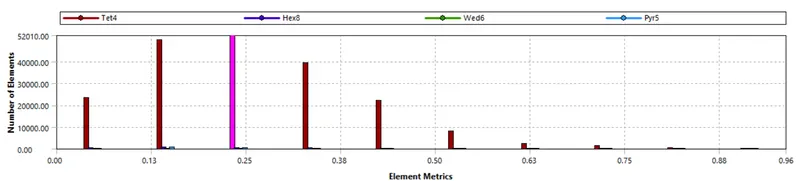
skewness
SETUP(base case) -->
Steady-state analysis
coupled solver
Turbulence model --> Realizable k-e model
Inlet velocity = 2 m/s
Heat generation rate = 23437500 W/m^3
side walls = symmetry
Number of iterations -- 500
RESULT (Base case)
Temperature contour
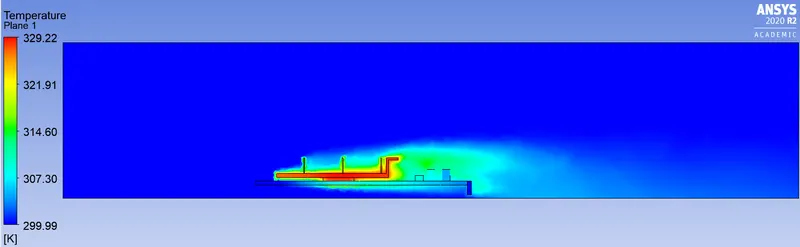
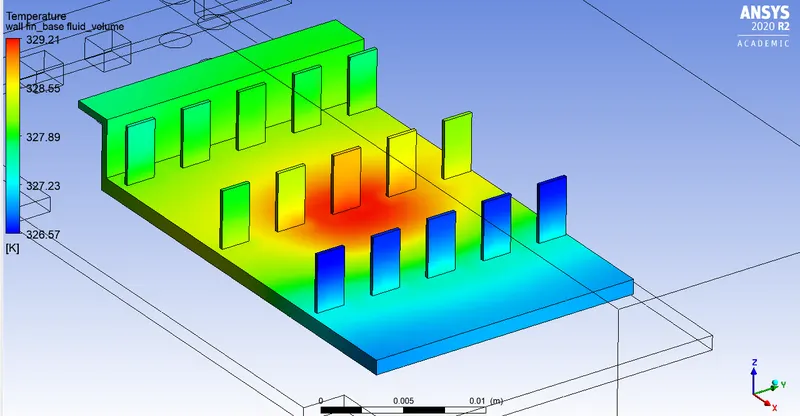
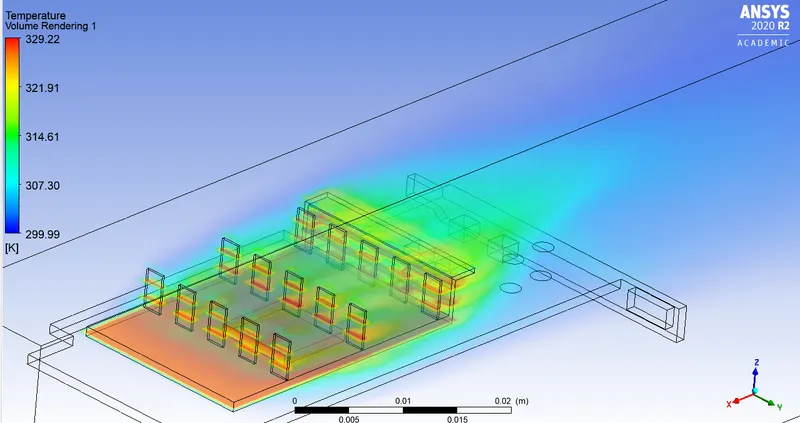
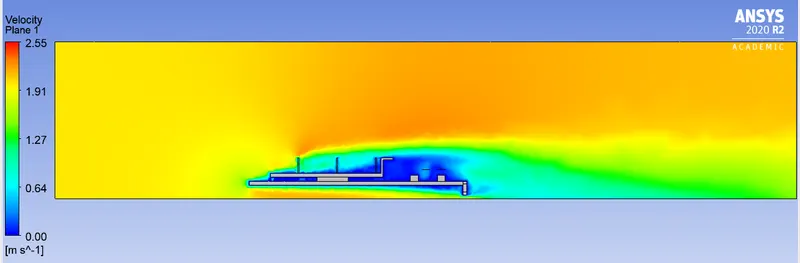
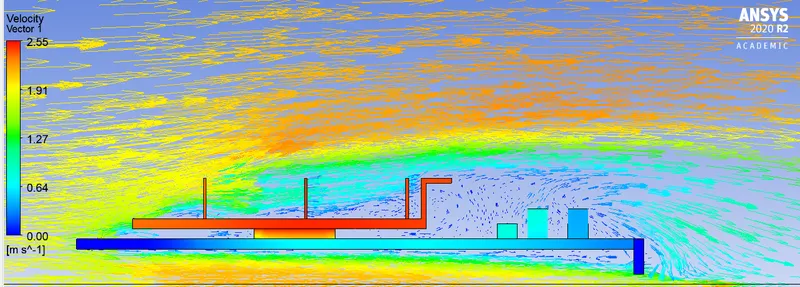
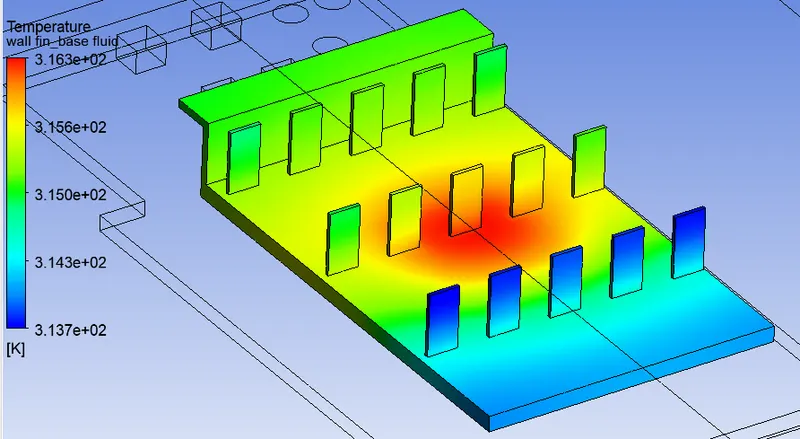
The max. temperature attained is 329.22 K or 56.06 deg C. Max. heat is conducted by the fins and is transferred by fins to air by convection. PCB base is made of insulating material and conducts very little heat. Components that are placed behind the fins are subjected to 30 deg C air at low velocity (< 0.5 m/s), so heat might be accumulated at that region.
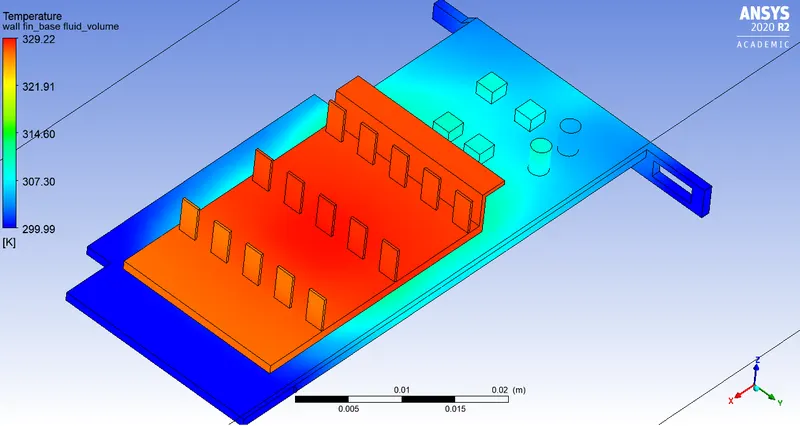
Global Temperature Contours
PCB Base
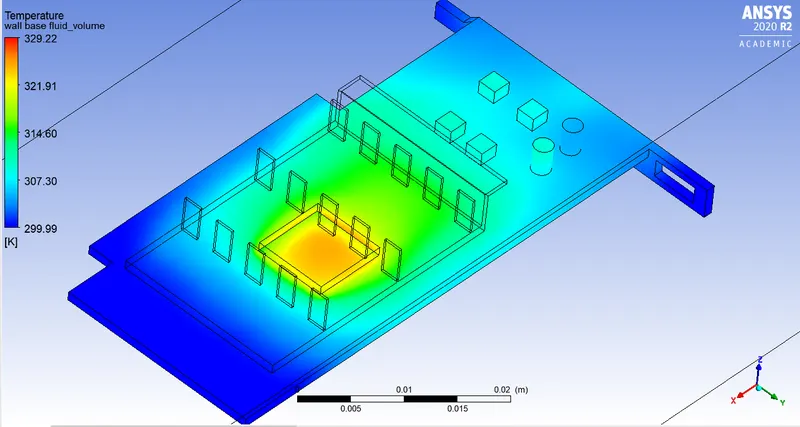
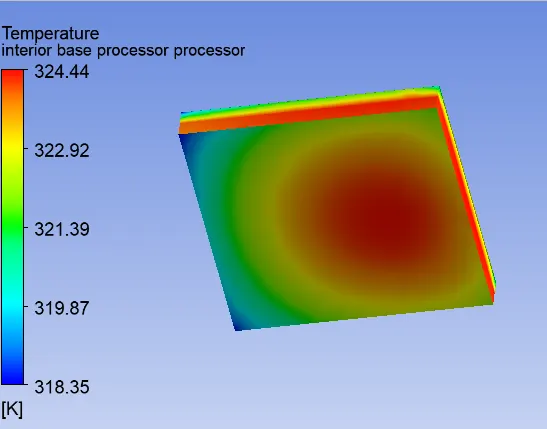
Temperature hotspot in the middle of the PCB base.
Processor
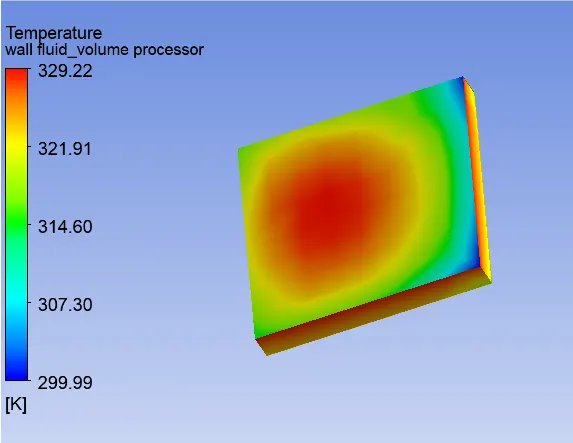
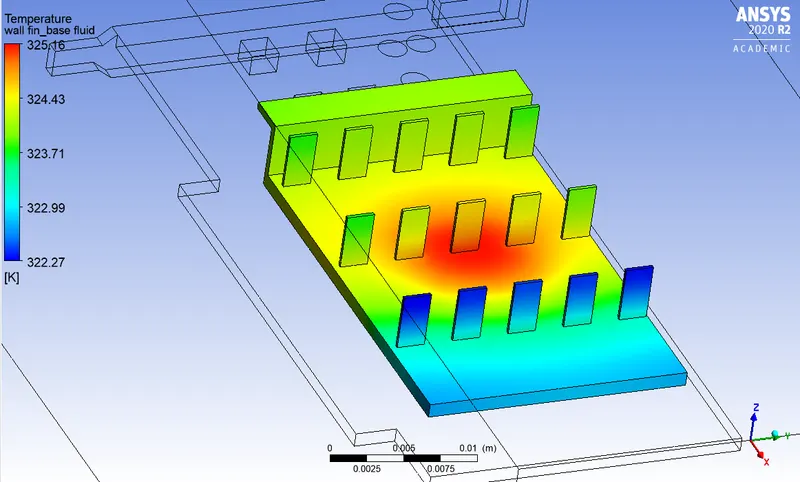
We can identify the Temperature hotspots in the above contours. Components must be placed at a low-temperature zone so that they do not get damaged.
Local Temperature contour
Temperature Volume rendering
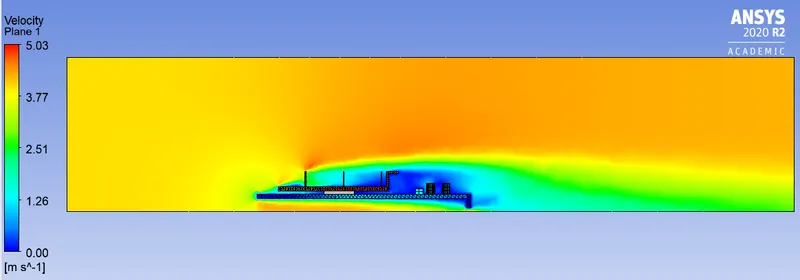
Velocity Contour
Velocity Vector Contour
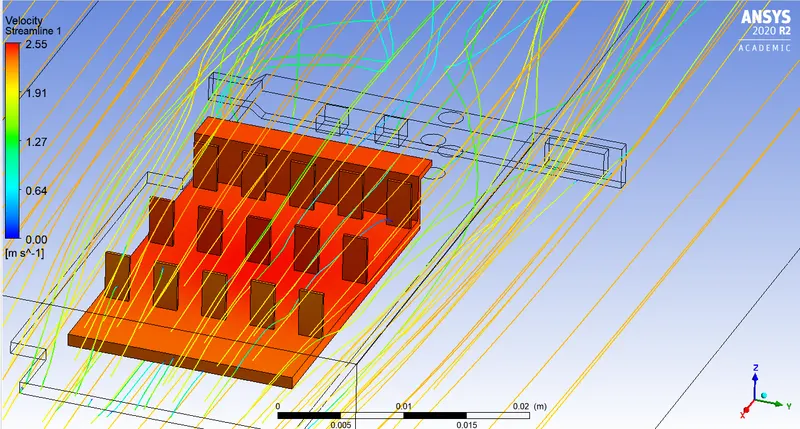
Velocity Streamline Contour
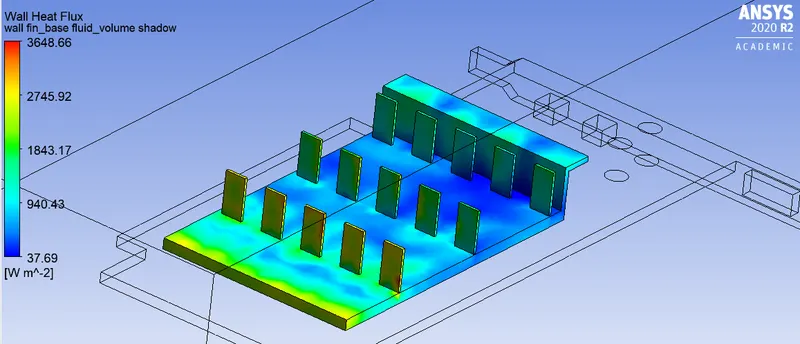
Wall heat flux
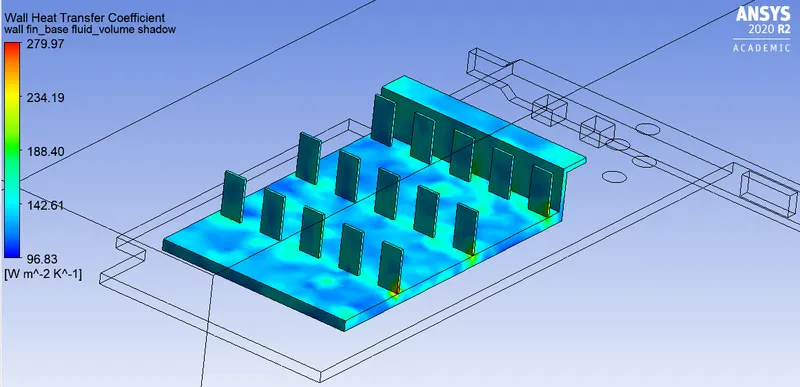
Wall heat transfer coefficient
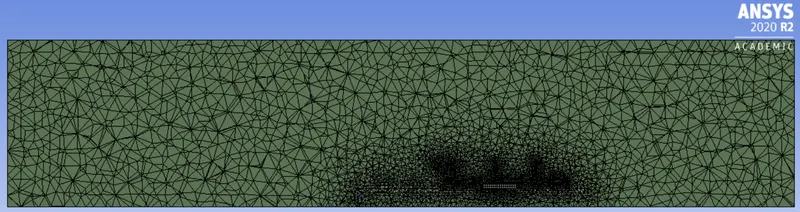
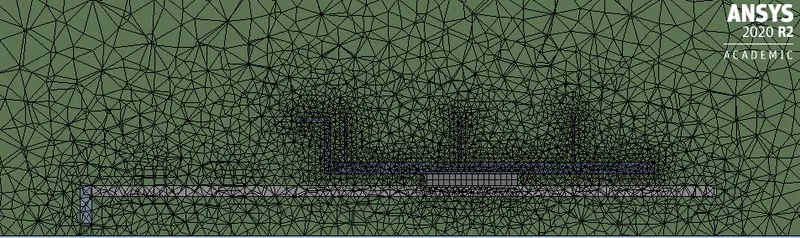
Need for Refinement -->
1. Element quality and skewness are not good.
2. The recirculation region is not clear.
3. Wall HTC have a higher value at some location due to bad mesh.
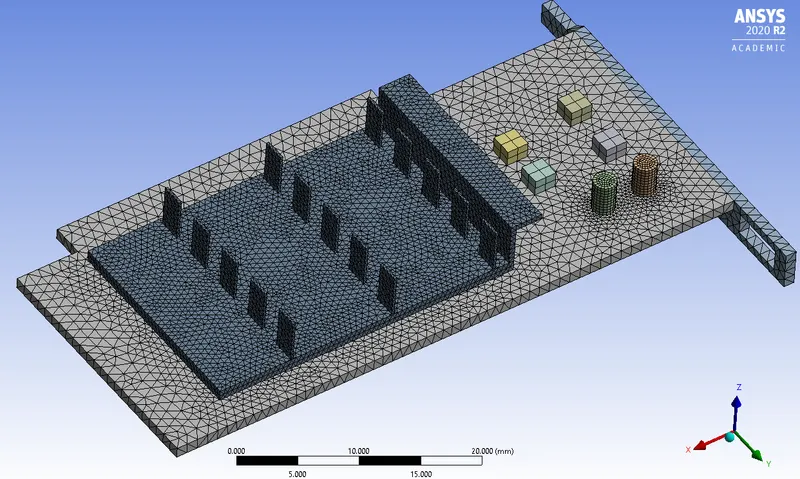
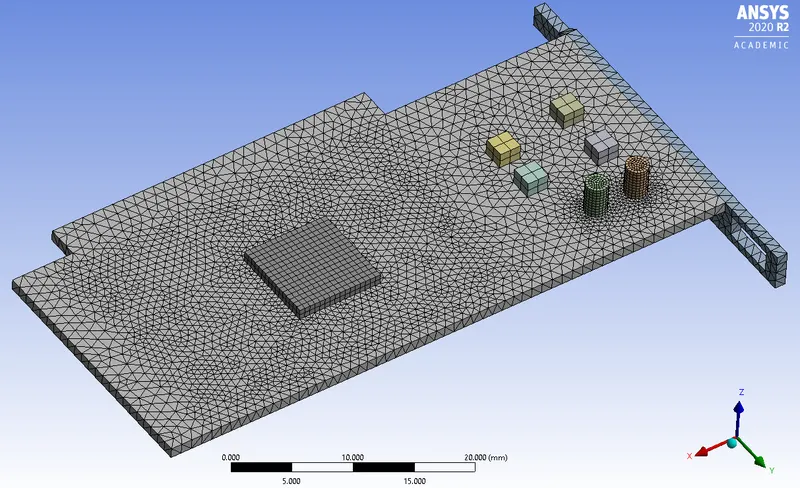
Refined Mesh
Element size = 4 mm.
1. PCB base body sizing
element size = 1 mm
capture curvature = yes, 18 deg
2. Processor body sizing
element size = 0.5 mm
capture curvature = no
3. Fins body sizing
element size = 0.5 mm
capture curvature = no

Element quality

Skewness

RESULT CASE I
Steady-state analysis
coupled solver
Turbulence model --> Realizable k-e model
Inlet velocity = 2 m/s
Heat generation rate = 23437500 W/m^3
side walls = symmetry
Number of iterations -- 500
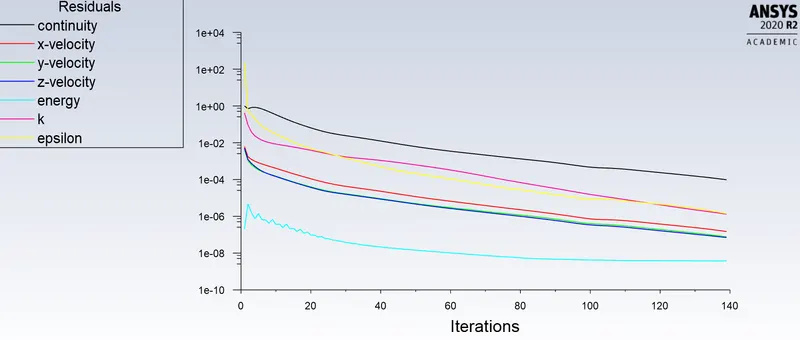
The solution converged at 140 iterations.
Temperature Contour
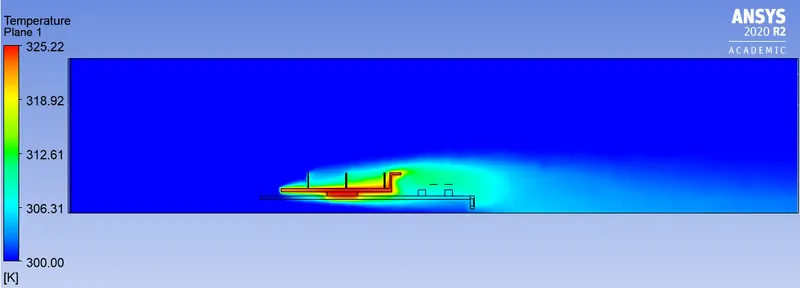
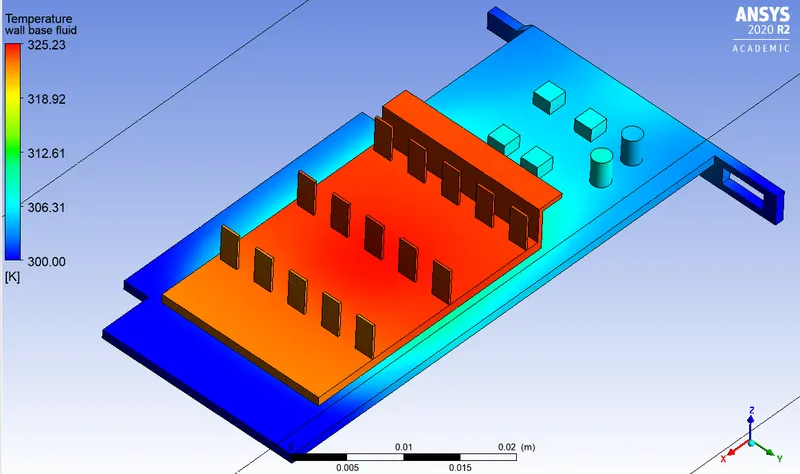
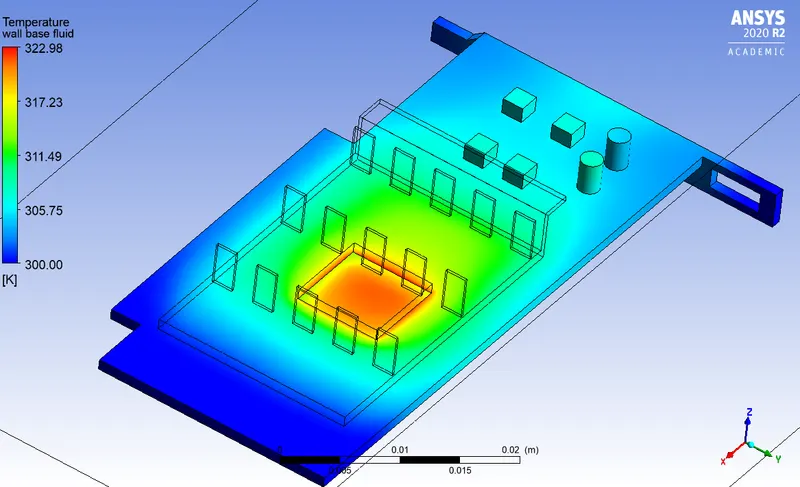
Local Temperature contour
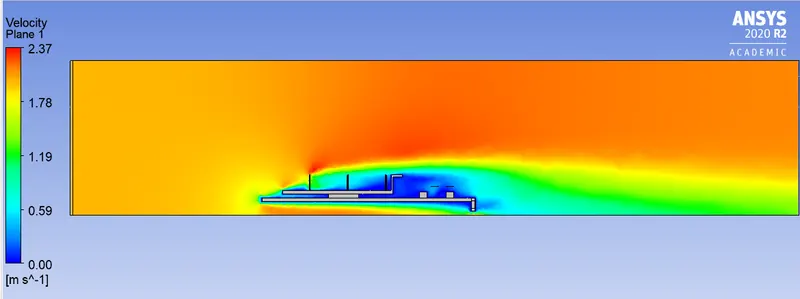
Velocity contour
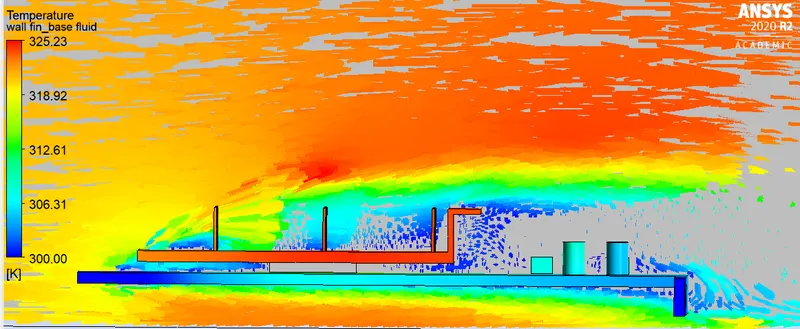
Velocity Vector contour
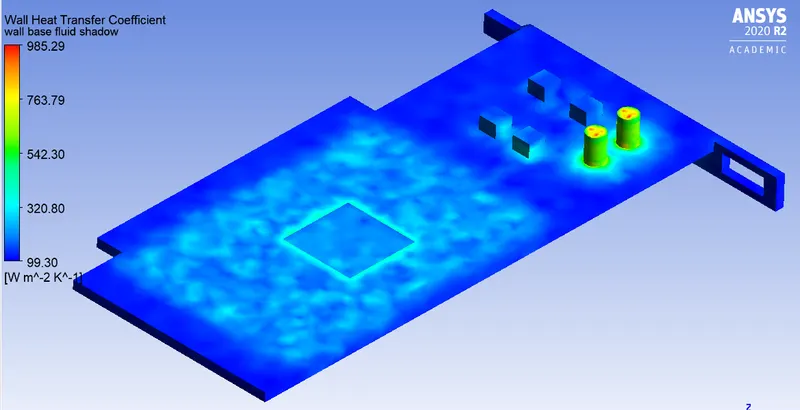
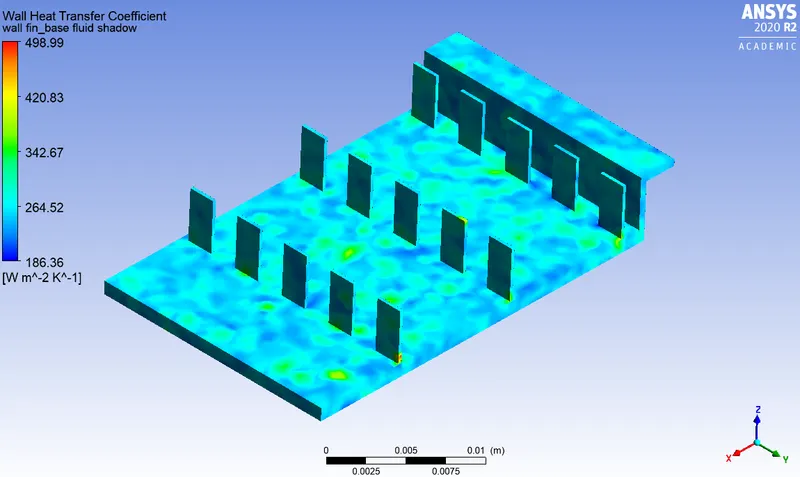
Wall Heat transfer coefficient
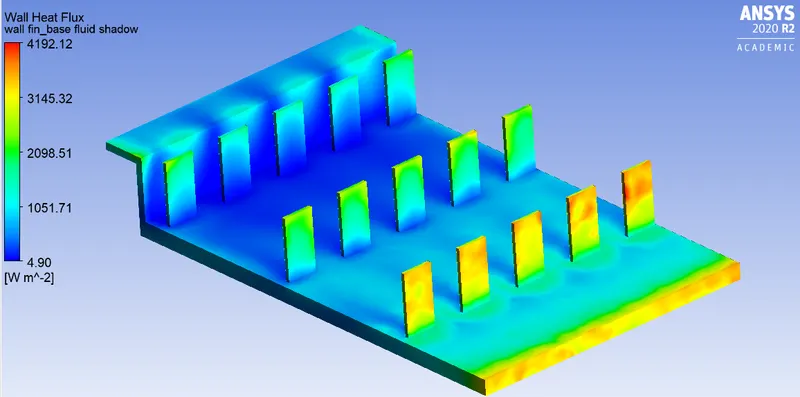
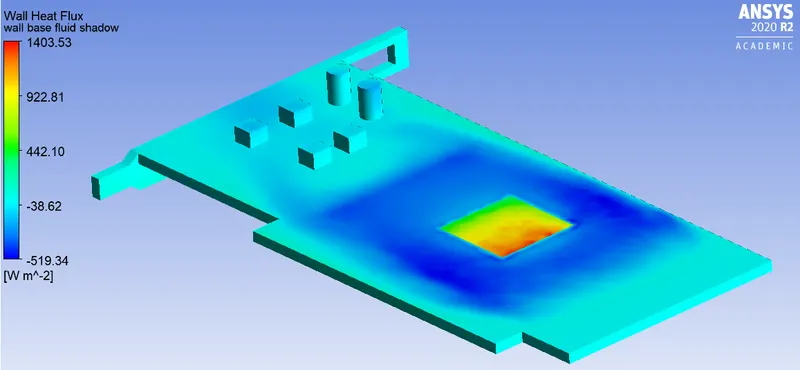
Heat flux
RESULT CASE II
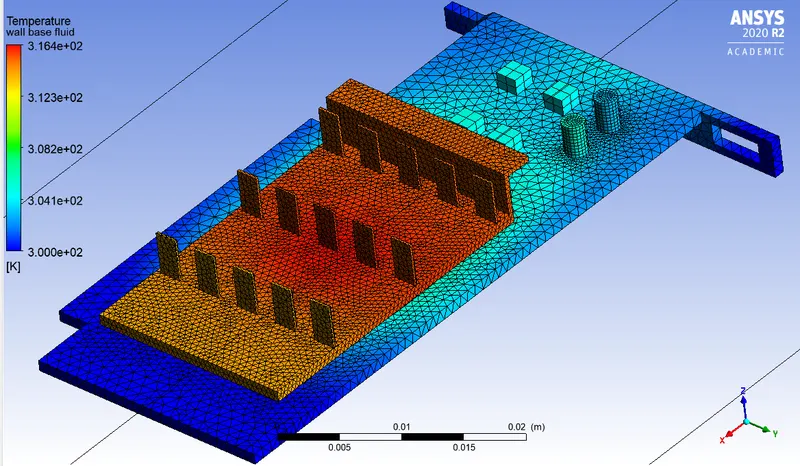
Inlet velocity = 4 m/s
Temperature contour
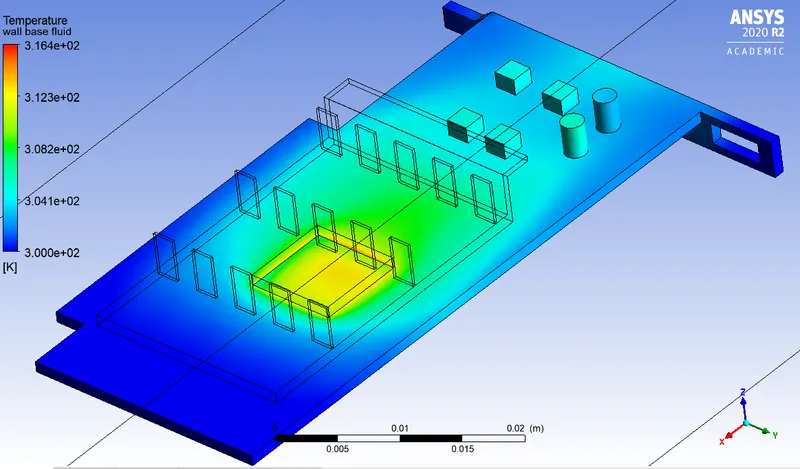
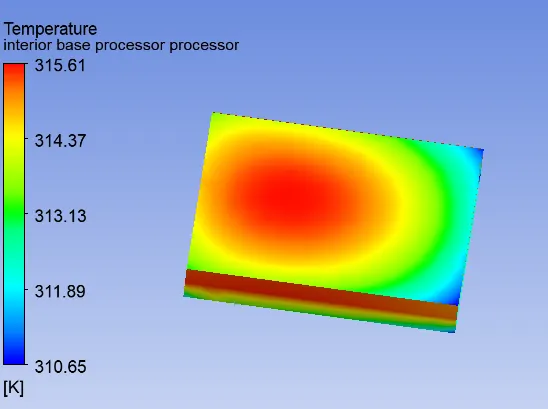
Local Temperature contour
Velocity contour
Velocity Vector contour
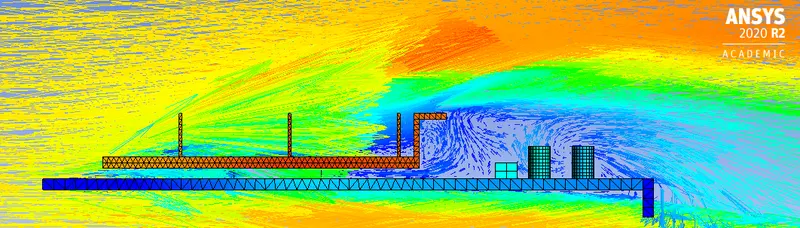
The recirculation region is clearly visible.
Wall HTC contour
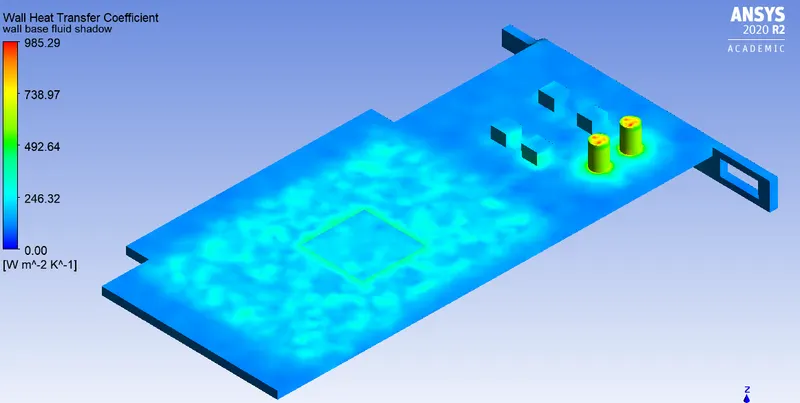
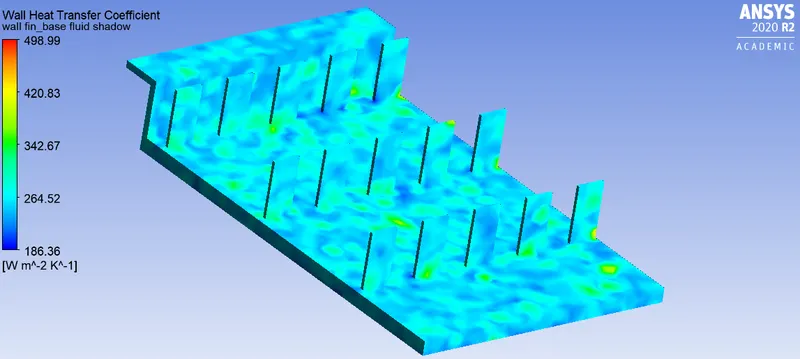
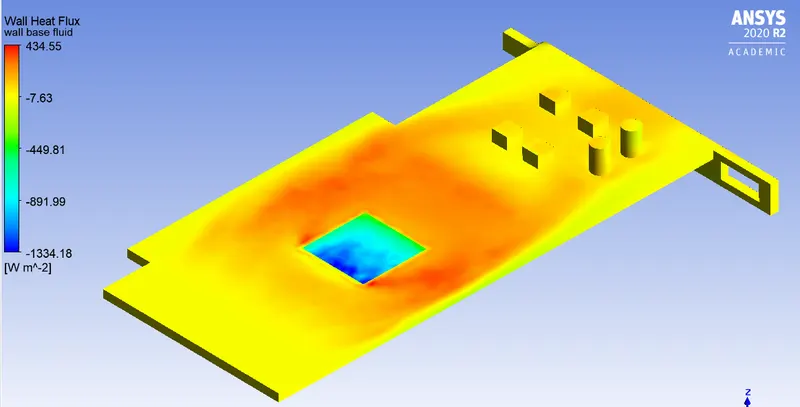
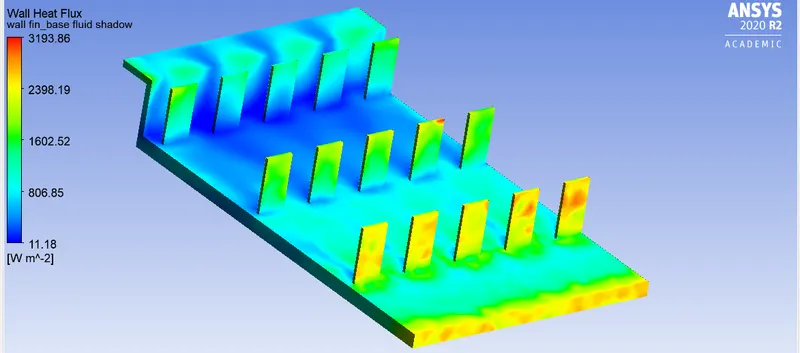
Wall Heat transfer contour
RESULT CASE III
Inlet velocity = 5 m/s
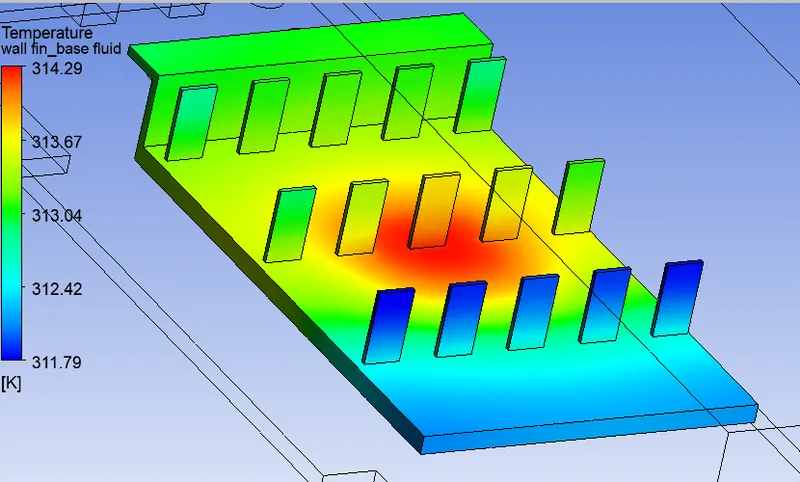
Temperature contour
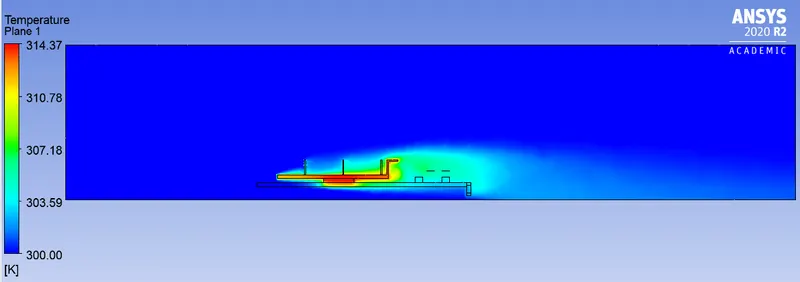
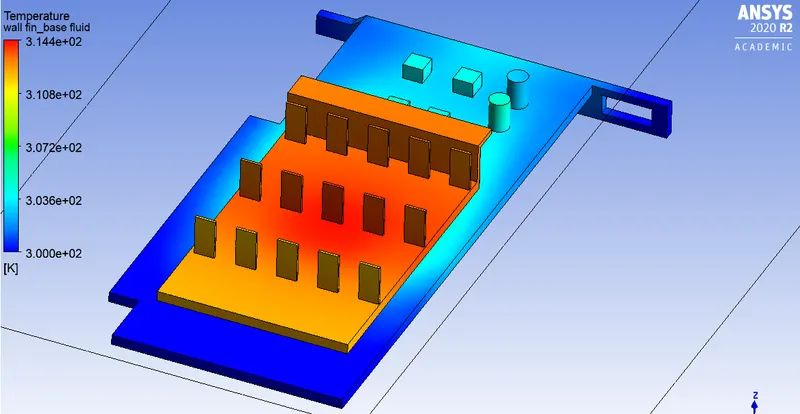
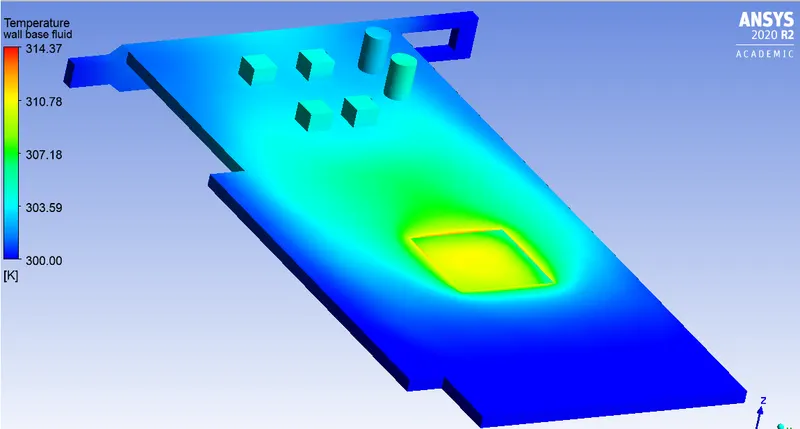
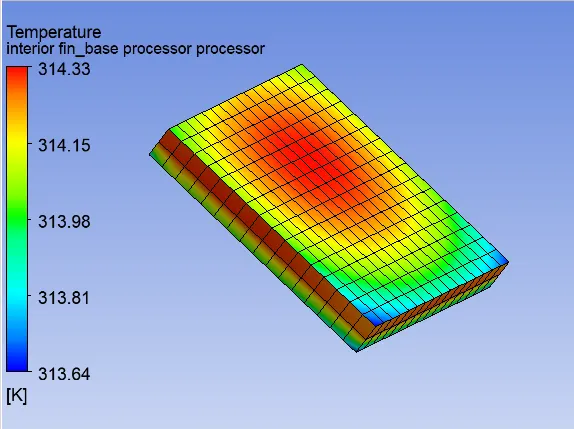
Local Temperature contour
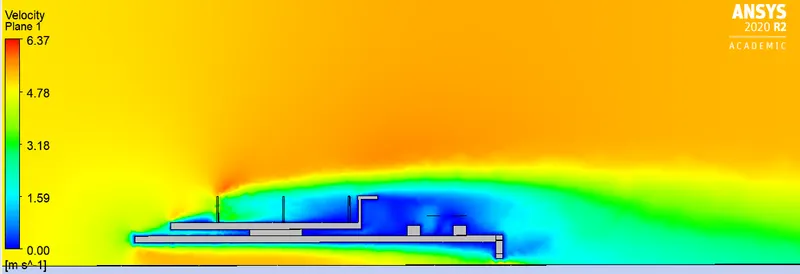
Velocity contour
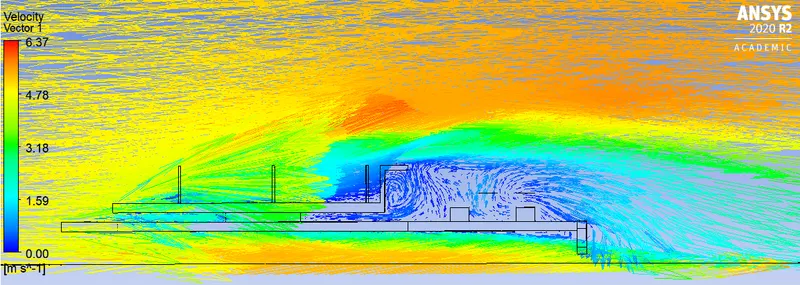
Velocity Vector contour
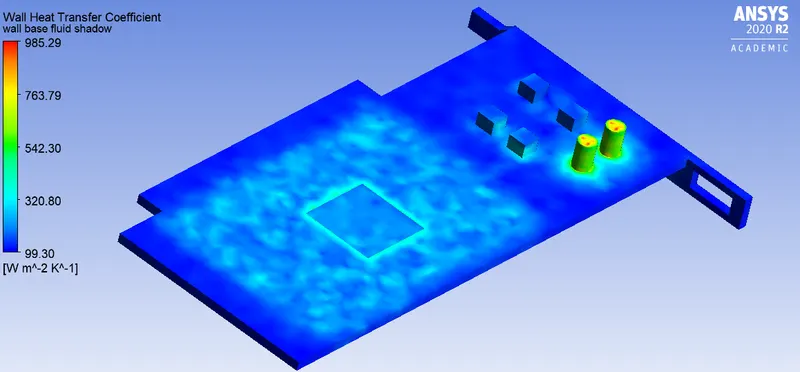
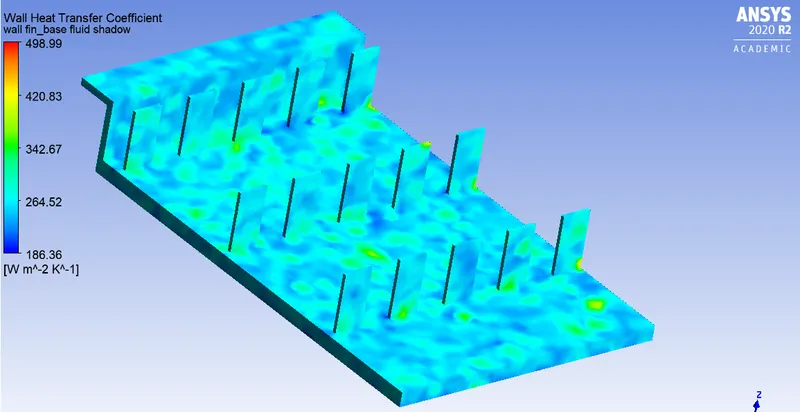
Wall HTC(Heat transfer coefficient) contour
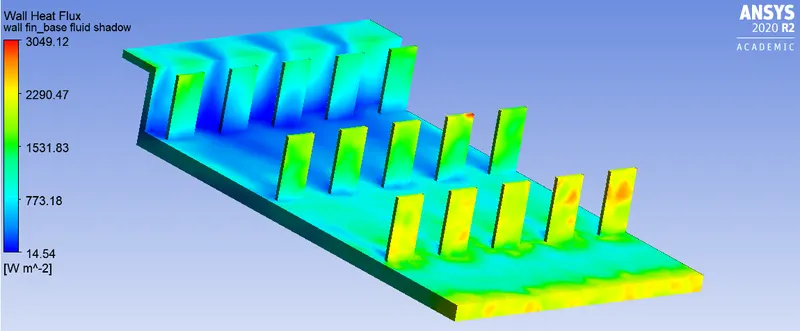
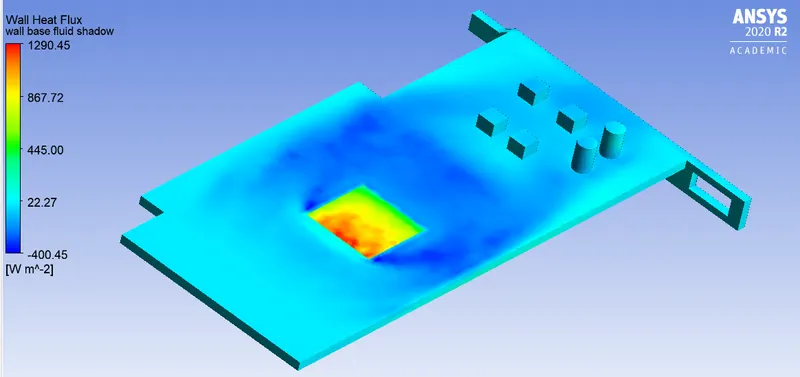
Wall Heat transfer contour
Conclusion -->
| Number of elements | Max. Temperature | Max. Velocity | |
| Base case | 200388 | 329.22 K | 2.55 |
| Refined | 456266 | 325.22 K | 2.37 |
--> CHT Analysis on graphics card has been done. Temperature hotspots and temperature variation of different regions and component have been identified.
--> There are multiple recirculation zones behind the fins which are shown. In these zones, velocity is very less. The heat from the fins is accumulated in that zone. This might not be good for the components placed there.
--> The mesh quality is not very good, there is a scope for more mesh refinement. As the velocity of air increases the maximum temperature reduces.