Week 6 - CHT Analysis on a Graphics card
REPORT ON CHT ANALYSIS ON A GRAPHIC CARD
AIM
- To perform a steady-state conjugate heat transfer analysis on a model of a graphics card.
- Run the simulation for best possible mesh with combination of coarse and refined mesh in different regions. Explain the reason for choosing the particular mesh settings.
- Run the simulation by varying the velocity from 1m/sec to 5m/sec for at least 3 velocities and discuss the results.
- Find out the maximum temperature and heat transfer coefficient attained by the processor.
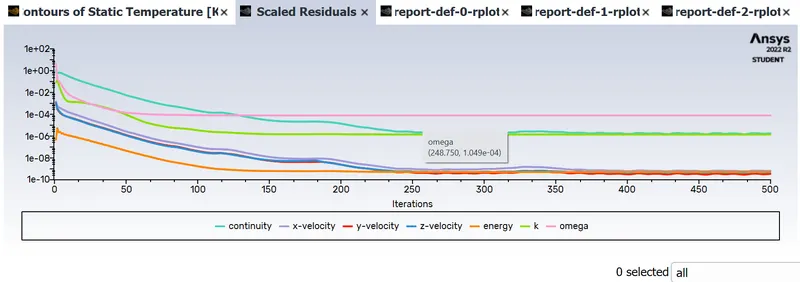
- Prove that the simulation has achieved convergence with appropriate images and plots.
- Identify potential hotspots on the model.
THEORY
Conjugate Heat Transfer:
Conjugate Heat Transfer analysis is used for the processes that involve a variety of temperatures concerning solids and fluids, due to thermal interaction between them. A typical example would be the heating or cooling of a solid by the flow of air.
The exchange of heat between two bodies is known as heat transfer and the rate of heat transfer is directly proportional to the temperature difference between them. Heat transfer in solids is usually occurred by conduction whereas in the case of fluids heat transfer occurs by convection. Efficiently combining heat transfers between solids and fluids is the key to design effective coolers, heaters, or heat exchangers. Forced convection is the most common way to achieve higher heat transfers. For some applications, the performance is further improved by combining convection with phase change(for example liquid water to vapor phase change).
Heat transfers in solid and heat transfers in fluids are usually combined in the majority of the applications. This is because fluid flows around solids or between solid walls and usually solids are immersed in the fluids.
An accurate description of parameters such as material properties, flow regimes, geometry configurations, selecting correct models based on the physics to be captured, heat transfer modes near the boundaries is needed for the analysis of temperature fields and heat transfer.
The CHT approach has an advantage over FE thermal analysis in that wall heat transfer coefficients and their local variations on surfaces are directly calculated within the model rather than based on simplified empirical calculations. The CHT approach therefore has benefits for those applications where heat transfer is either non-uniform or difficult to calculate empirically.
Heat Transfer Coeffiicent: It is a constant used to calculate the flow rate inside or over a body.
It is used in calculating the heat transfer, typically by convection or phase transition between a fluid and a solid. The heat transfer coefficient has SI units in Watts per square meter Kelvin (W/m2/K).
The overall heat transfer rate for combined modes is usually expressed in terms of an overall conductance or heat transfer coefficient, U. In that case, the heat transfer rate is:

where (in SI units):
- A: surface area where the heat transfer takes place (m2)
- T2: temperature of the surrounding fluid (K)
- T1: temperature of the solid surface (K)
PROCEDURE
The first step is the share prep of the geometry which helps in the interfacing of the mesh
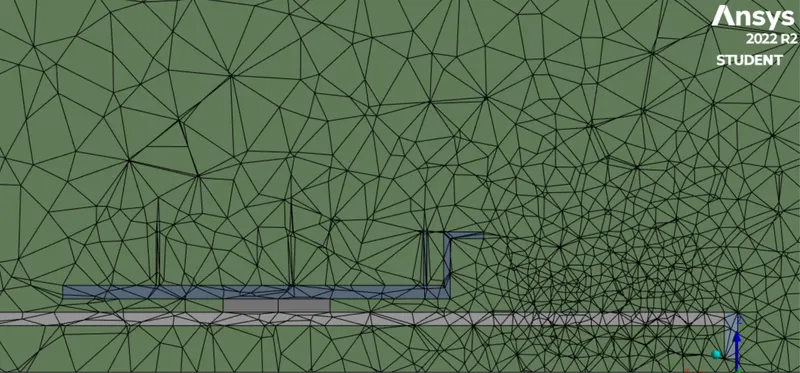
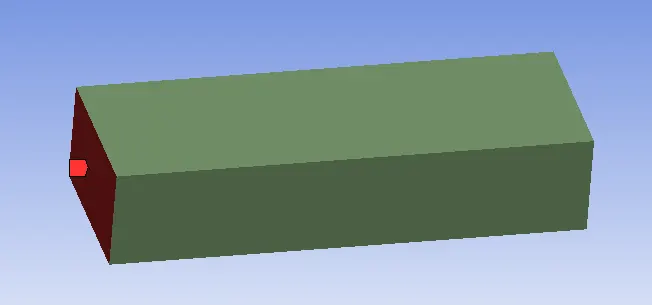
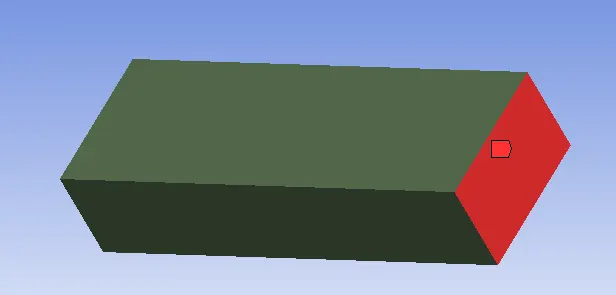
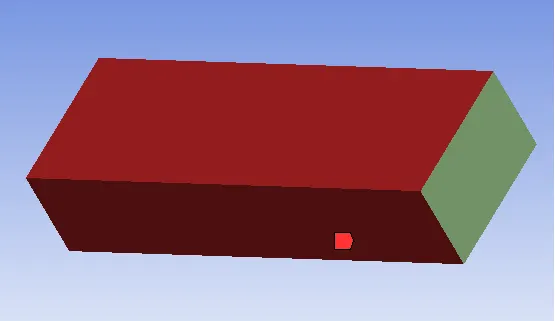
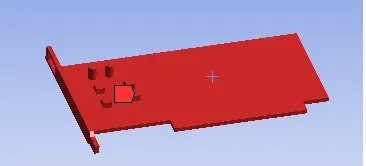
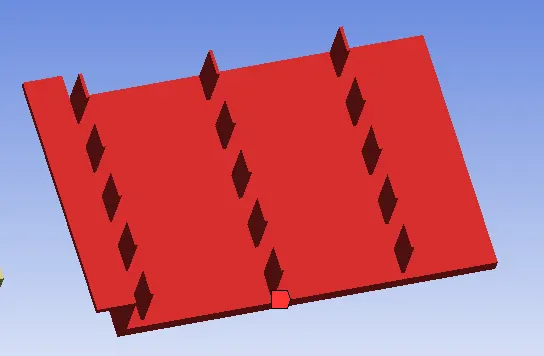
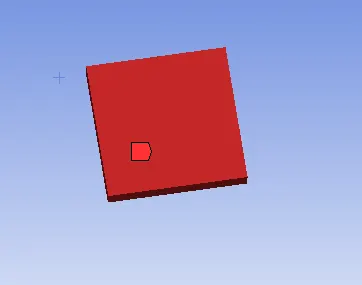
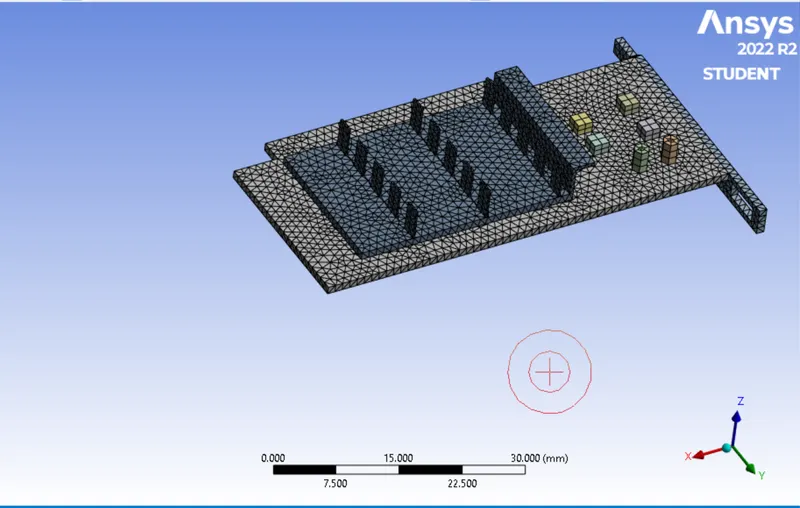
We then create the name selection where we give names for each part like the base, inlet, outlet, processor, fins and symmetry-wall.
Inlet velocity
Outlet
Symmetry Wall
Graphics card base
Fins
Processor
Now let us start with the setting up the physics for the simulation
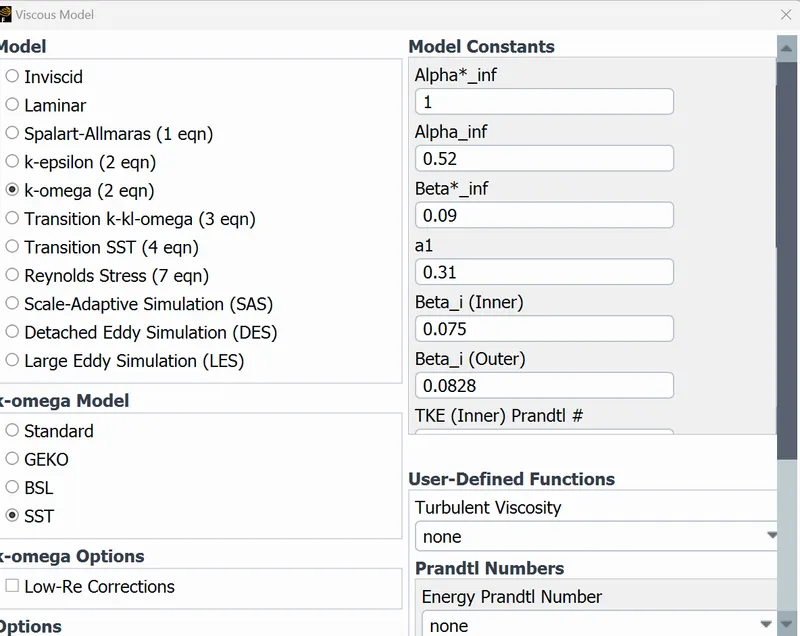
First we use the K-omega model with SST because we have to find the near wall properties.
Then we add the appropriate materials for solid using the material selection and cell zones.
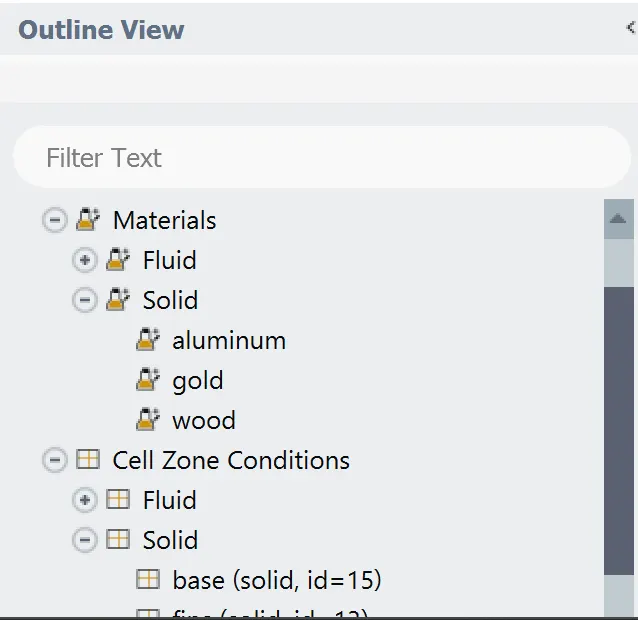
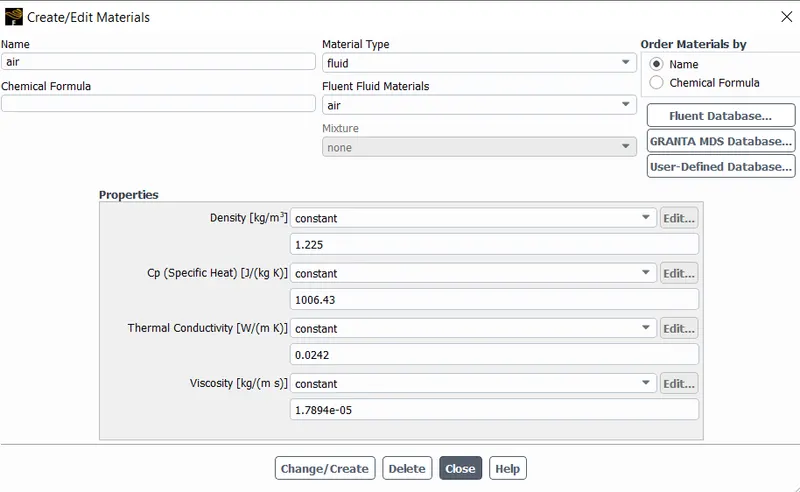
Solids
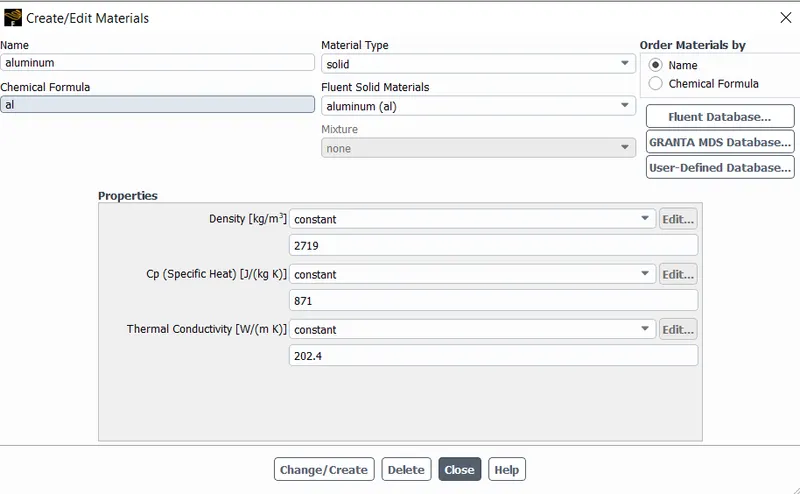
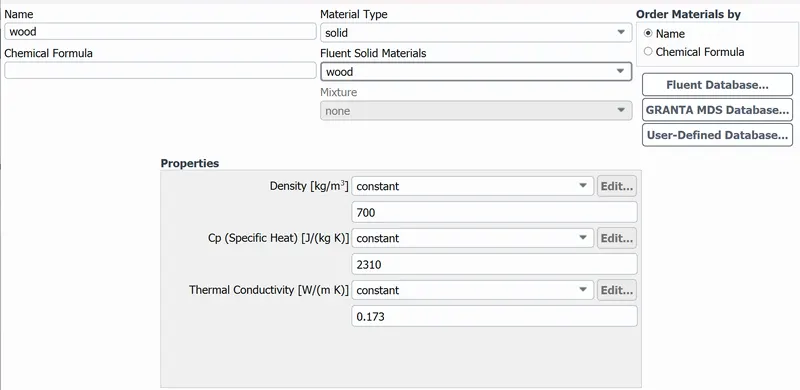
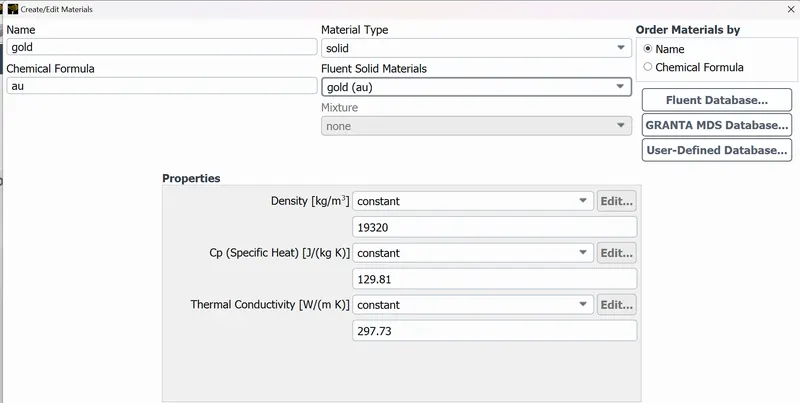
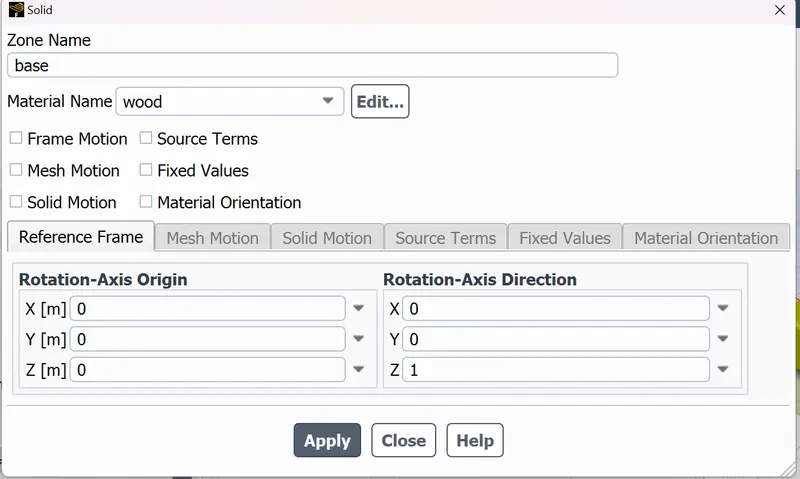
Graphics Card Base: Material chosen is wood
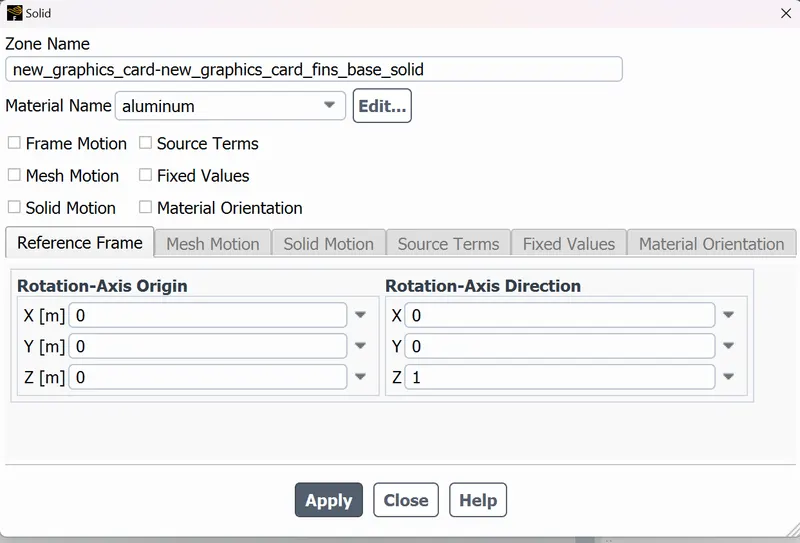
Fins:Material chosen is aluminium
Processor: Material chosen is gold
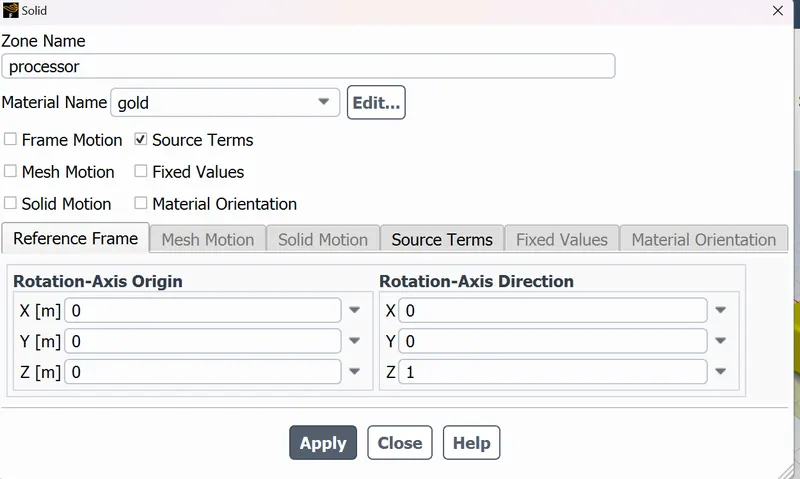
Here in the material selection of processor we activate source term to calculate the heat generation rate using the equation Heat generation rate = `(Power)/(Volume)`
The heat should be applied to the processor as Energy Sources (Source term) by considering the heat produced and volume of the processor.
Dimension of the processor = 0.008*0.008*0.001 m^3
Graphics Card Power = P=1W
Volume of the processor=V=6.4e-08 `m^3`
Energy produced by the processor=P/V=15625000 `(W)/(m^3)`
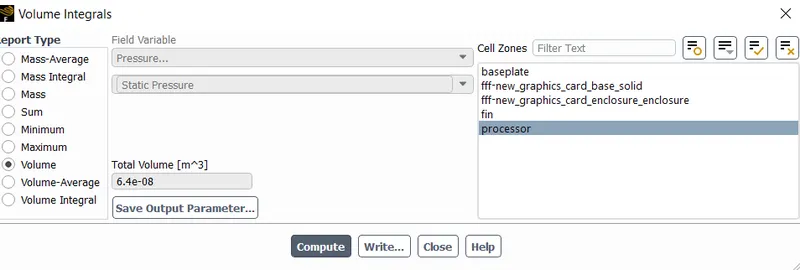
Then we initialize the equation and create the contour plot and also we create the maximum temperature plot and surface heat transfer coefficient as per the requirement.
RESULTS
Base line mesh with enclosure element size of 5mm and the base, processor and fins with 1mm element size 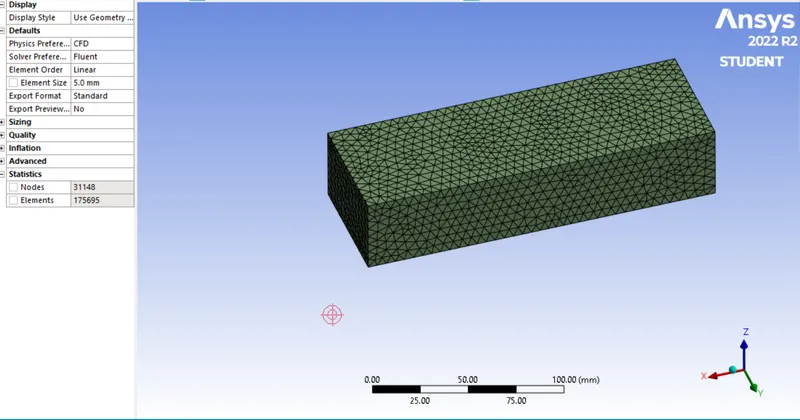
Residuals
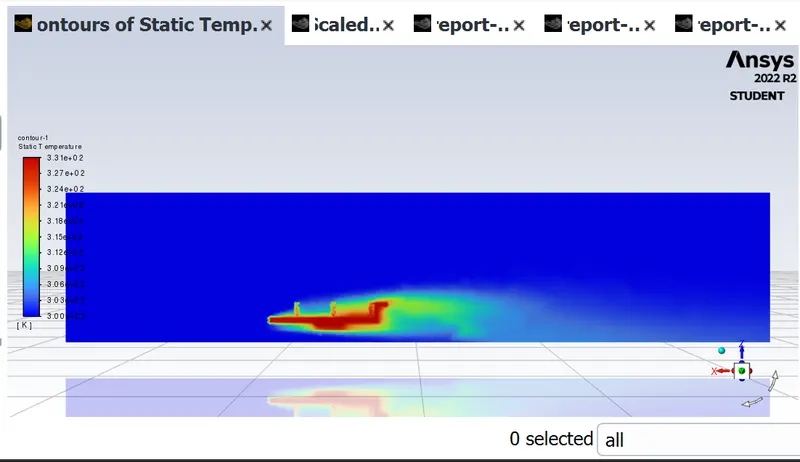
Temperature contour
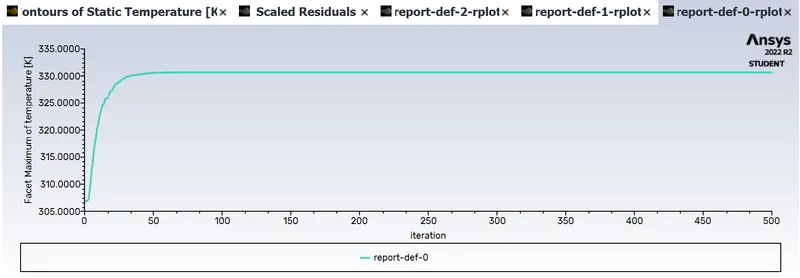
Maximum Temperature
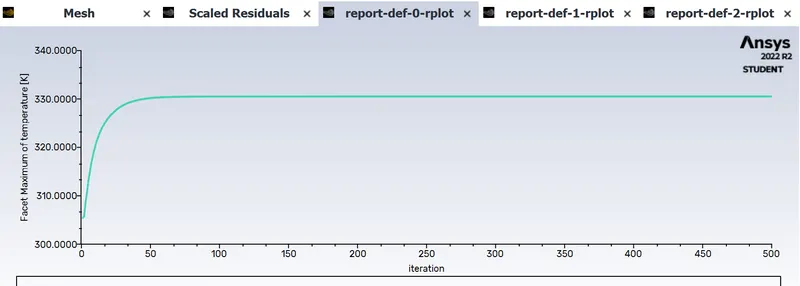
Here the maxmum temperature is around 330K i.e. 57 degree celcius which is within the range of the maximum temperature that is generated by the processor
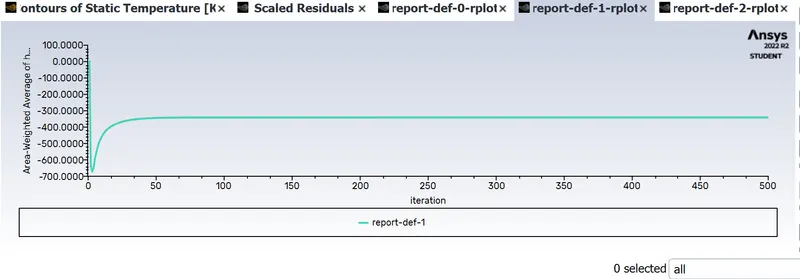
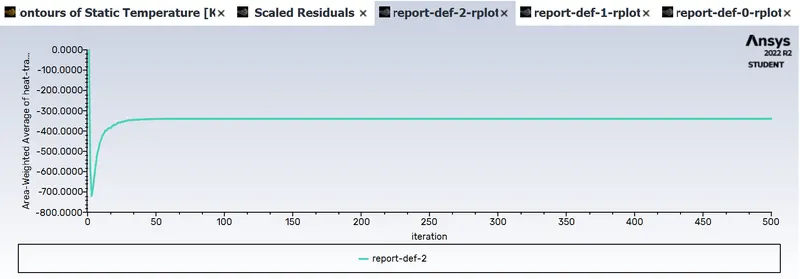
Surface Heat transfer coefficient
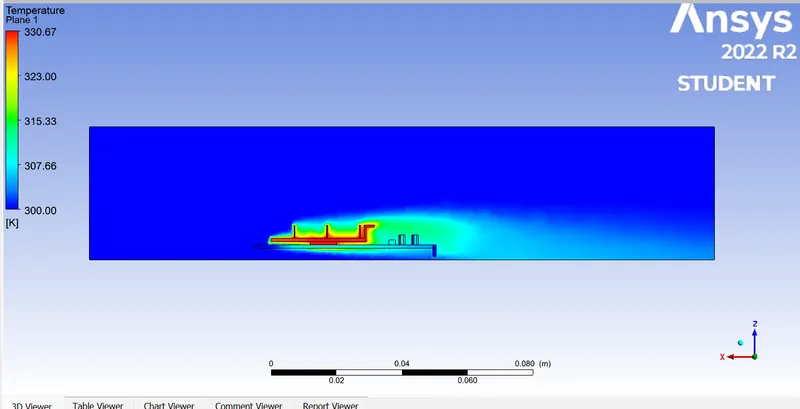
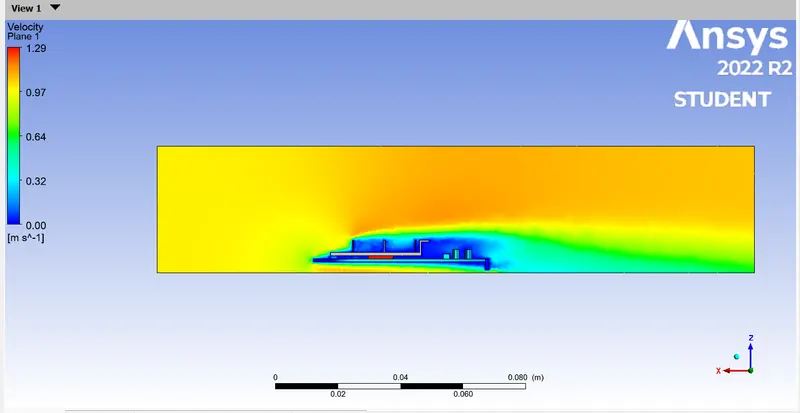
Post processing plot for temperature and velocity
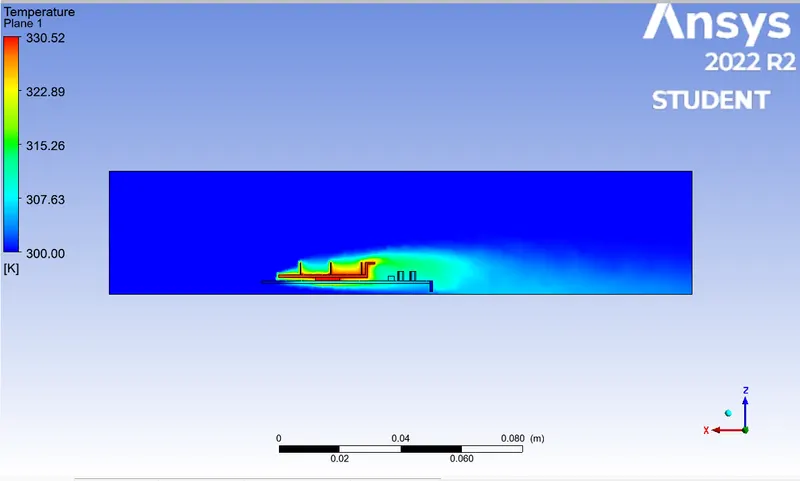
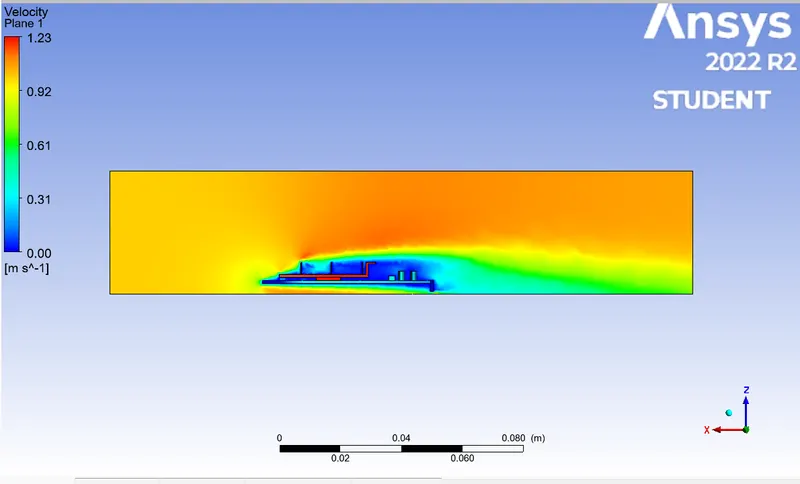
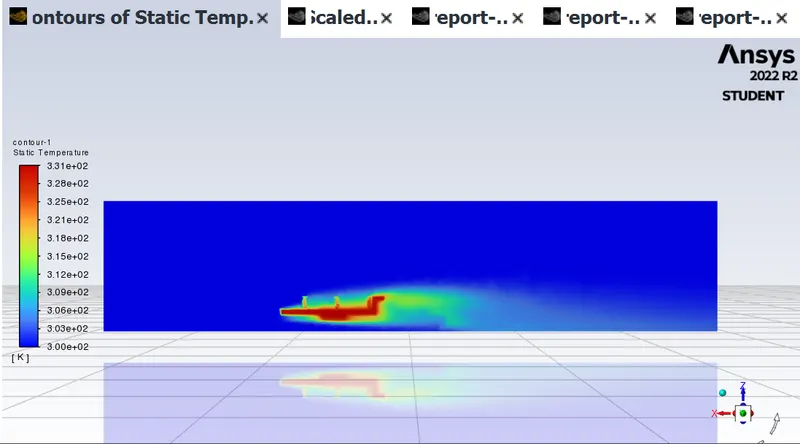
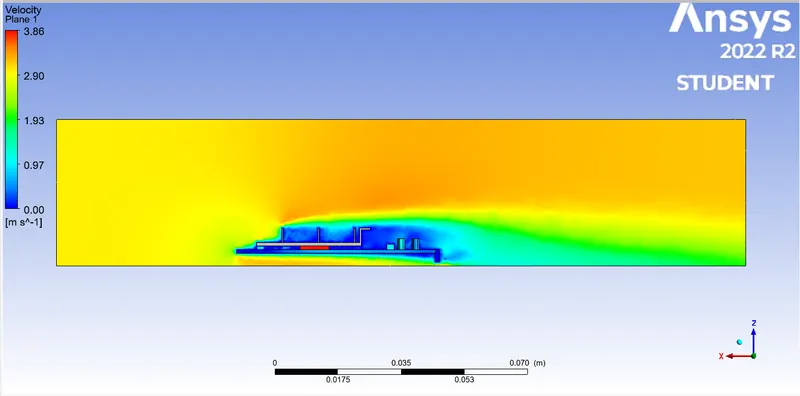
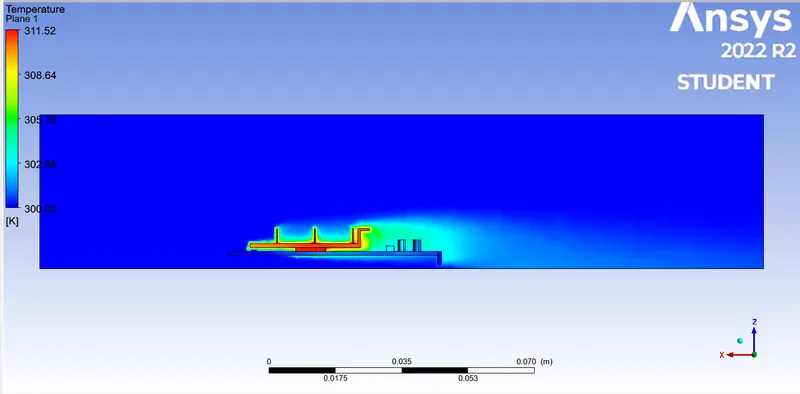
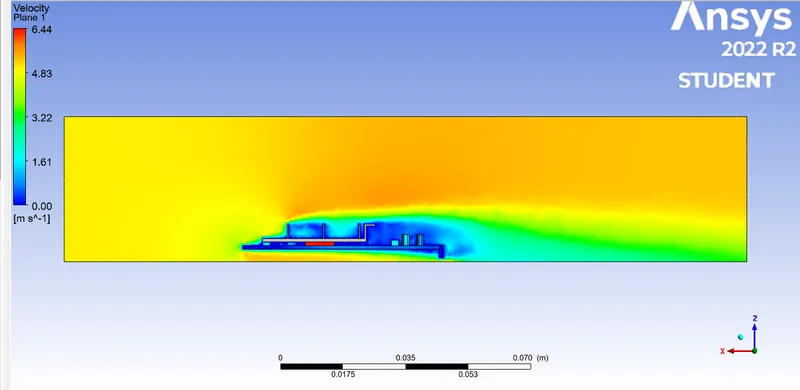
In the above plots we can see that the temperature near the geometry is higher because the heat is generated by the processor and transmitted in the outward direction and the air that flows removes the heat from the fins. Similarly from the velocity plot we can see that the veloity near the surface lower as compared to far from surface.
REFINED CASE
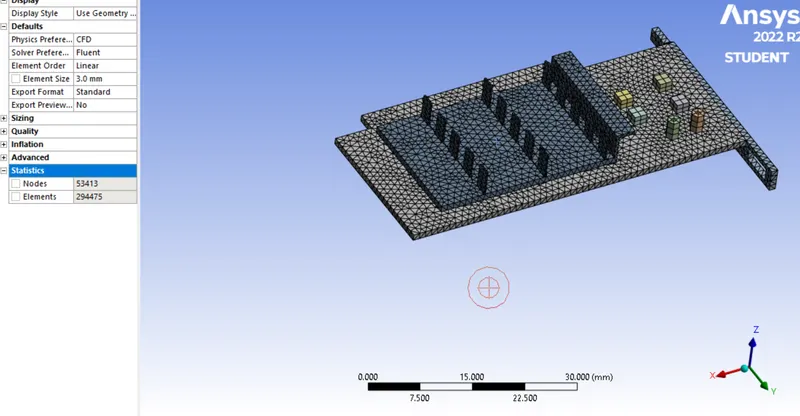
Refined case with enclosure size of 3mm and base, processor and fins with element size of 0.5mm
Residuals
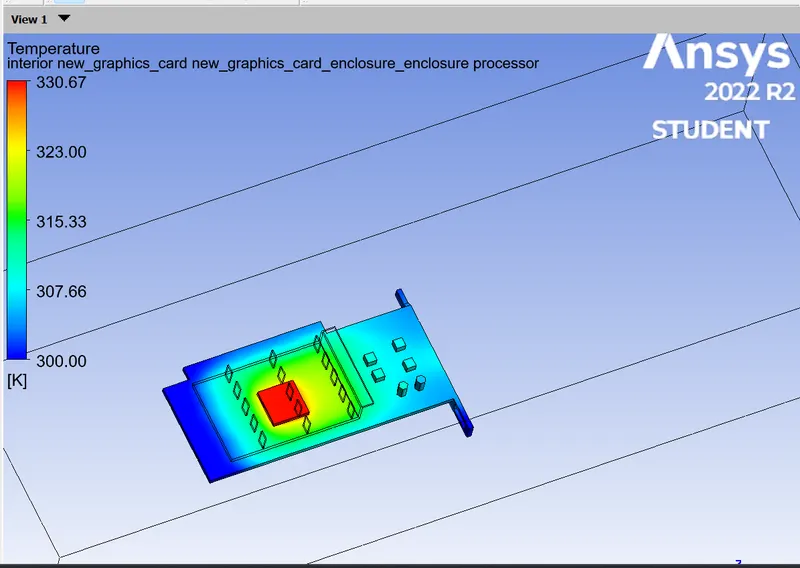
Temperature contour
Maximum Temperature
Surface Heat transfer coefficient
Post processing plot for temperature and velocity
CASE 2: Varying Inlet velocity
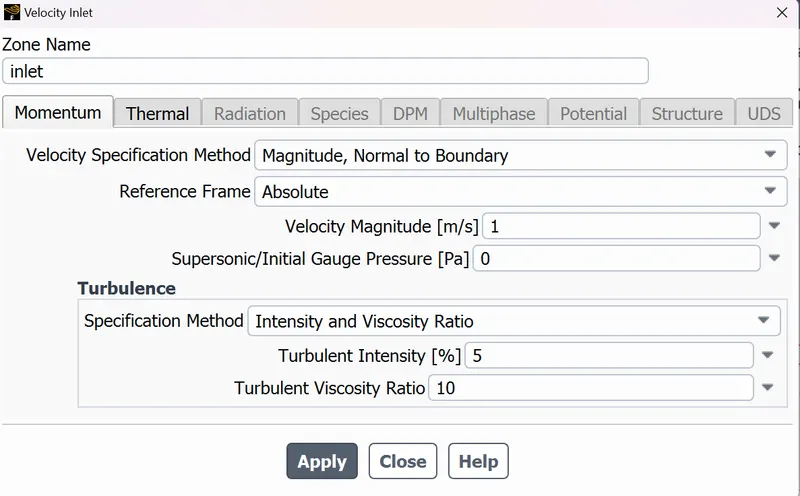
Now let us calculate the heat transfer coefficient and maximum temperature using the variation of inlet velocity on the refined mesh.
At Inlet velocity = 1m/s
Residuals
Temperature contour
Maximum Temperature
Surface Heat transfer coefficient
Post processing plot for temperature and velocity
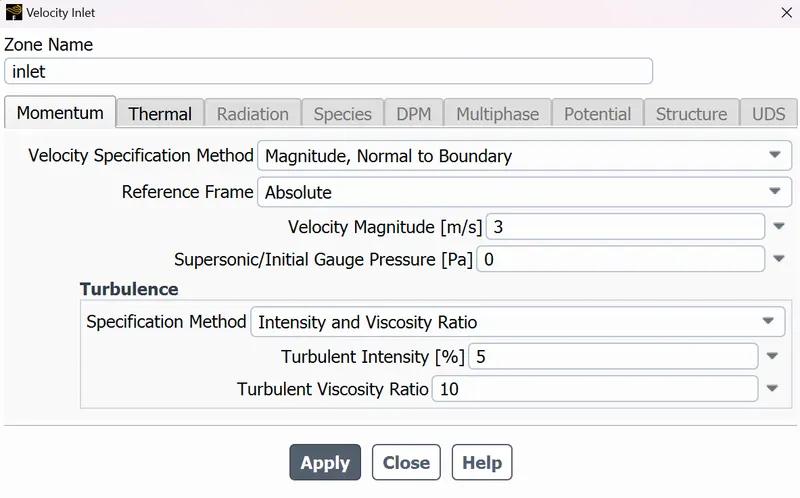
At velocity = 3 m/s
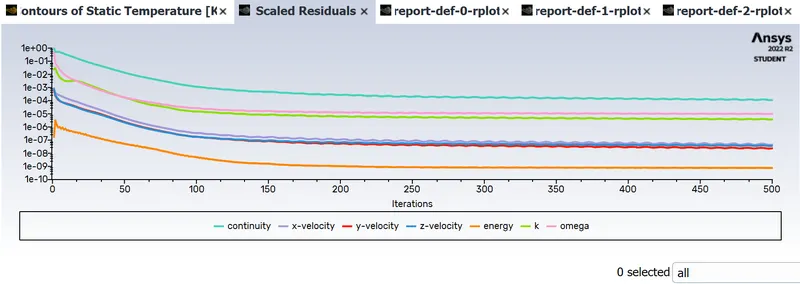
Residuals
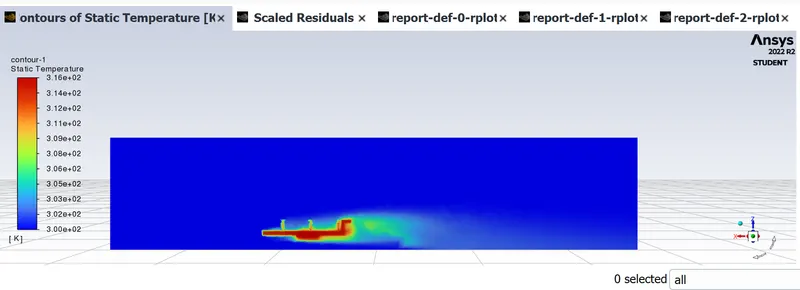
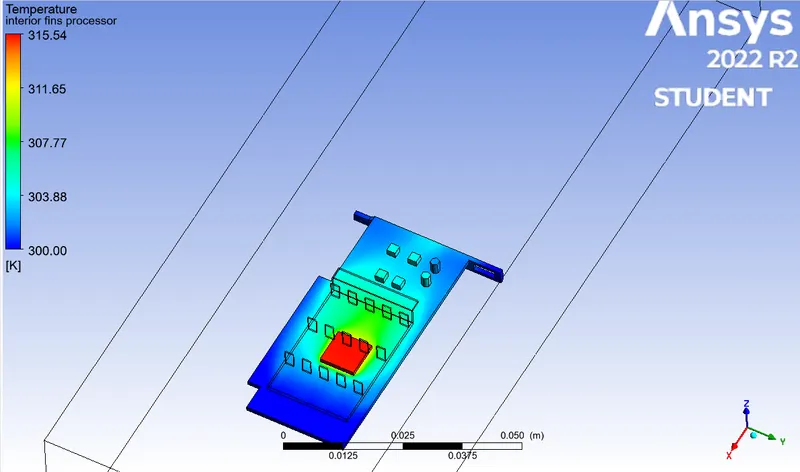
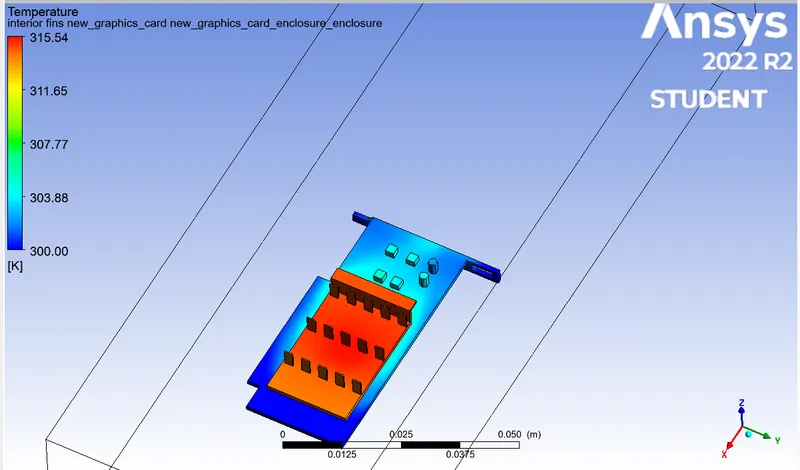
Temperature Contour
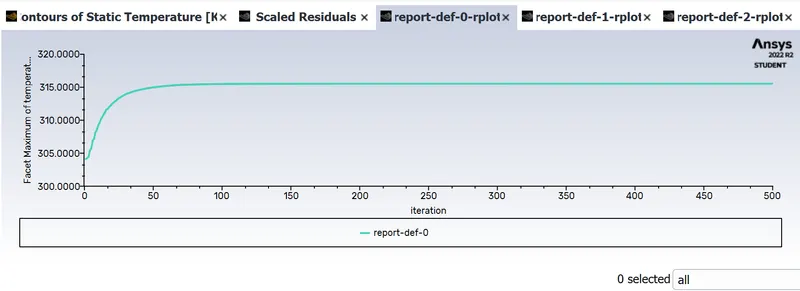
Maximum Temperature plot
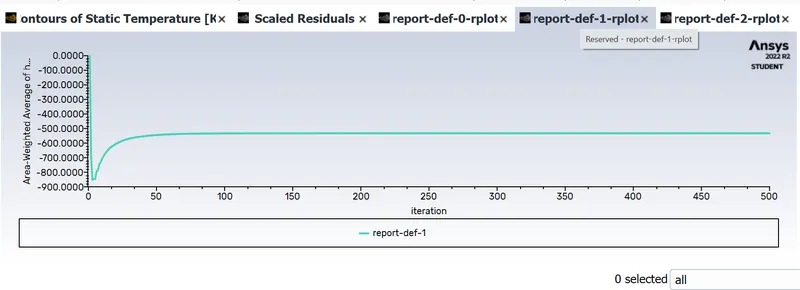
Heat transfer coefficient plot
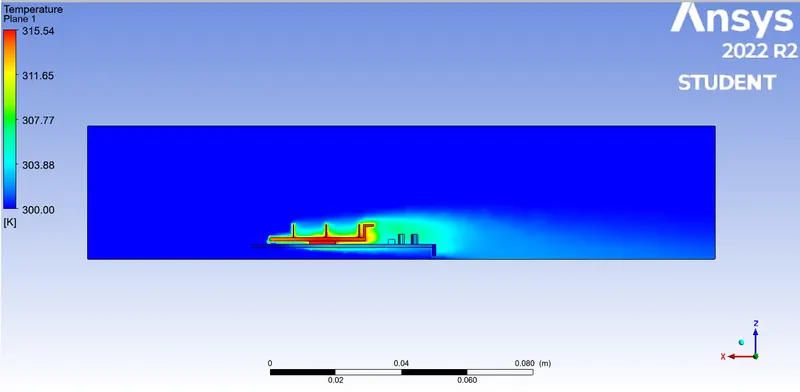
Post processing plot for temperature and velocity
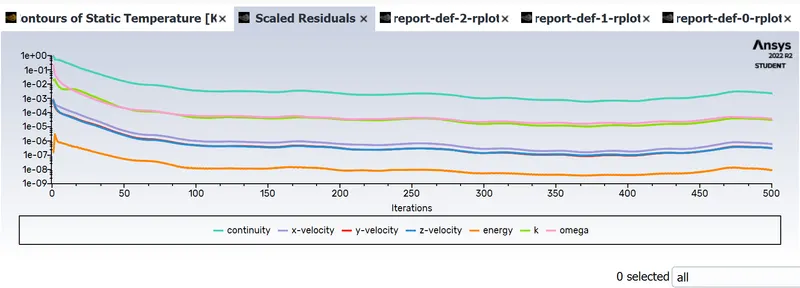
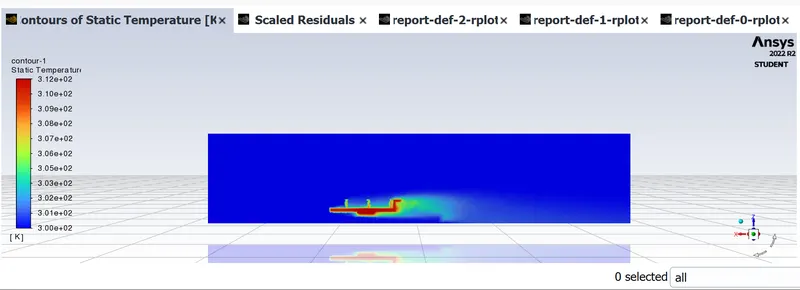
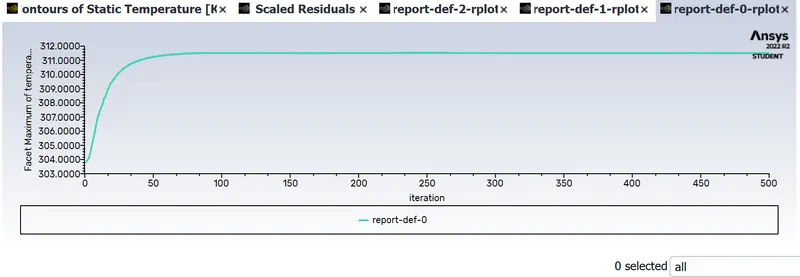
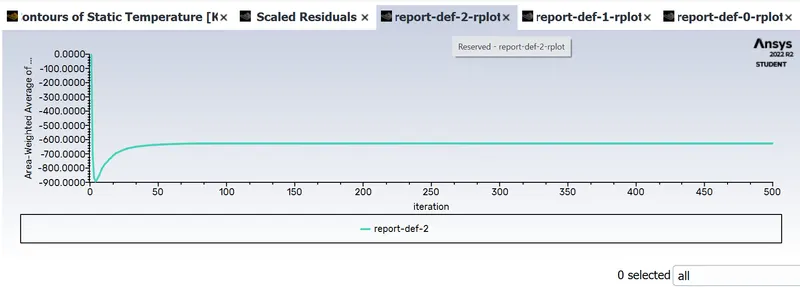
At Inlet velocity = 5 m/s
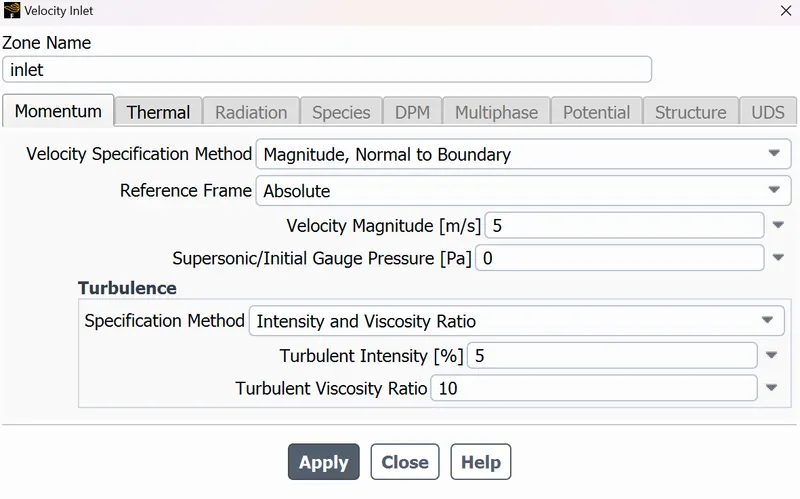
Residuals
Temperature Contour
Maximum Temperature plot
Heat transfer coefficient plot
Post processing plot for temperature and velocity
CONCLUSION
Grid Independence
|
Baseline 1 m/s |
Refined 1m/s |
Refined 3m/s |
Refined 5m/s |
|
| Max temperature Processor (K) | 330 | 330 | 315 | 312 |
| Wall Heat transfer coefficient processor (W/m2K) | 420 | 420 | 560 | 680 |
After completing the simulation succesfully the following points are noted.
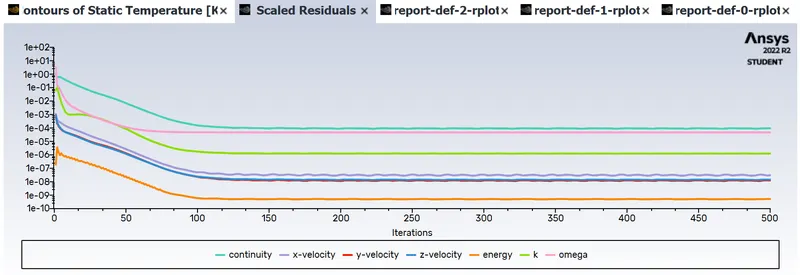
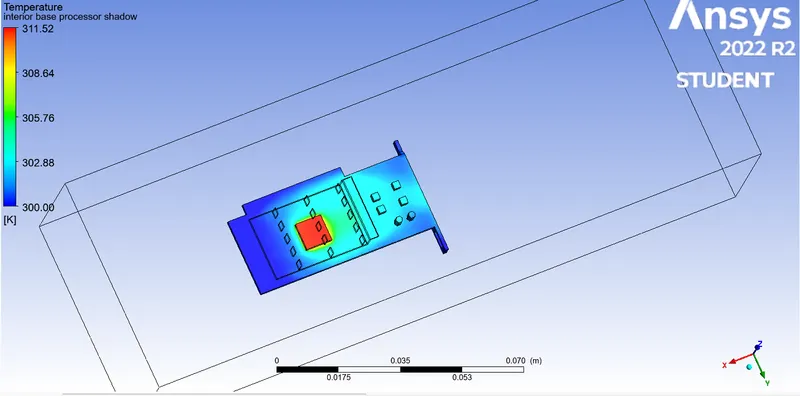
A converged solution for the given sets of input was observed on the basis of repetitive plots in the Residual plot. The processor acted as a source of heat input and thus one of the hotspots for such study
With an increase in velocity, we saw a considerable drop in temperature and a substantial rise in heat transfer coefficient which shows that high-velocity air can be an effective mode of heat dissipation in graphics card
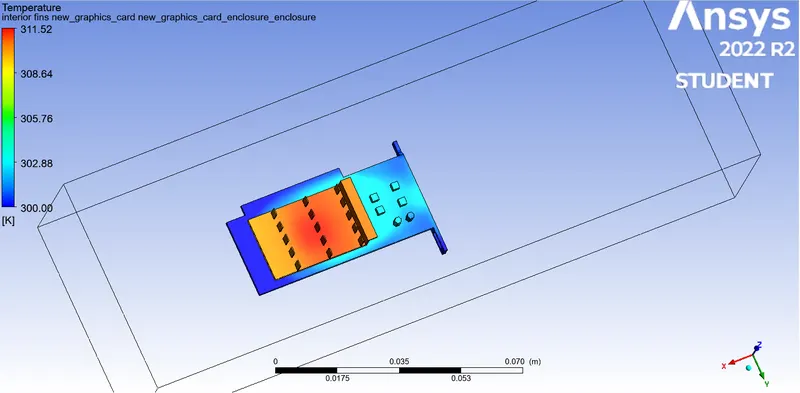
From the temperature distribution, we can see hotspots in the fin and base near the surface that is in contact with the processor. Based on the thermal conductivity of the material this temperature is distributed accordingly amongst the component. We see a few high-temperature zones on fin away from processor depicting their high susceptibility to heat due to their geometry.
Also, the difference in baseline and refined mesh is considerable and thus we can conclude that more refined mesh provides a better solution and can be used in optimizing the design for such applications.From the residual plot, the change in the gradients is very small with which we can conclude that the solution has converged.
From the temperature plot of the coarse mesh, the high-temperature points are found at fins, processor, and base area near the processor. As the wall heat transfer coefficient is a wall phenomenon and fins dissipate a large amount of heat which results in higher heat transfer co-efficient but the coarse mesh heat transfer for fins and other components in the graphics card has the same values. Hence refinement of mesh is done for fins and base of the fin and base of the graphic card in order to calculate the wall heat transfer coefficient at the fins and base.
The high-temperature regions are found at the center of the fins, base, and the processor walls. With further iterations, the temperature is distributed to other regions in the graphics card in the direction of the inlet airflow. Conduction occurs where there is a contact region between the solids in this case it is between processor and fins and processor and base. Convection occurs when the heat generated in the components of the graphic card is removed by the inlet airflow. The maximum temperature in the components is inversely proportional to the inlet airflow velocity. With the increase in the airflow velocity, the heat removal process by convection is faster. And also recirculation of air (vortex) at appropriate places will increase the heat transfer efficiencies hence greater amount of heat is removed by convection.