Week 6 - CHT Analysis on a Graphics card
Aim: To perform CHT Analysis on a Graphics card.
Objectives:
- Run the simulation by varying the velocity for at least 3 velocities and discuss the results.
- Find out the maximum temperature and heat transfer coefficient attained by the processor.
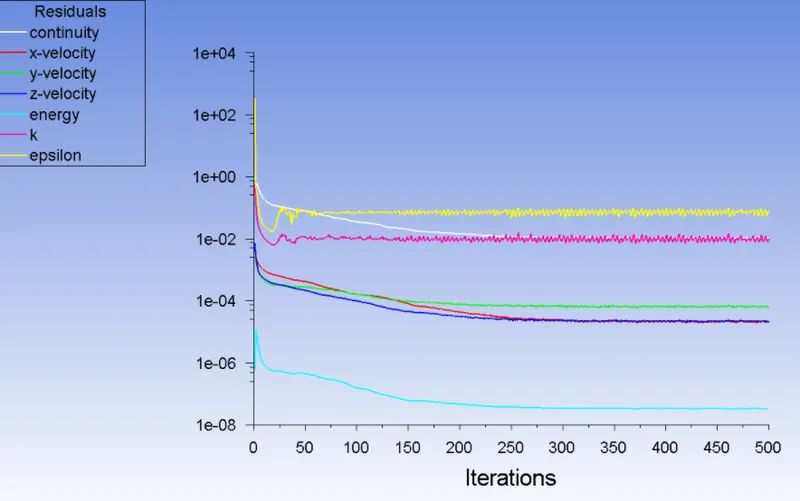
- Prove that the simulation has achieved convergence with appropriate images and plots.
- Identify potential hotspots on the model.
Introduction:
Conjugate heat transfer (CHT) analysis can accurately predict heat transfer by simultaneously solving all the relevant solid and flow field heat transfer processes, for example, conduction through solids, free and forced convection in the gases/fluids, and thermal radiation.
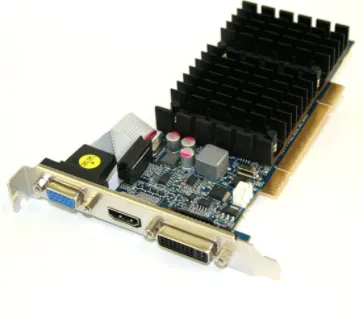
Graphics card is inside computer systems which are used to run heavy software and graphical tasks on the computer. As day by day, the machines are getting faster the load on the graphics card is more resulting in more heat generation. More heat generation results in the failure of a product system and slows down the processing. So to ensure proper electronics cooling we use fans and different materials to increase the heat transfer rate.
Cooling fins of suitable materials are placed over a processor to increase the heat transfer rate through forced convection through the fan.
Geometry:
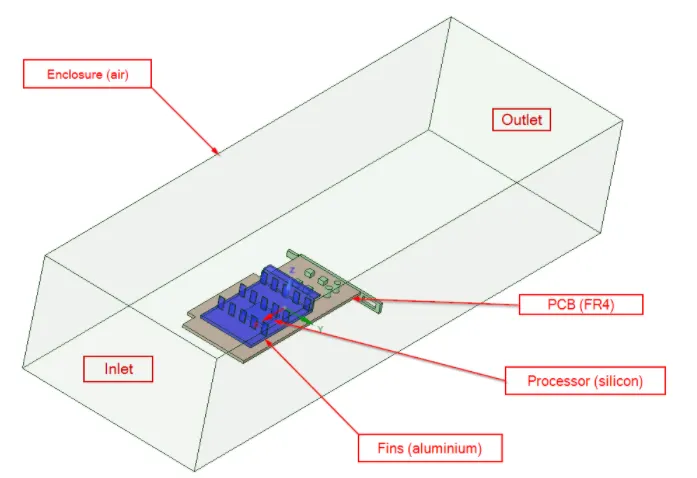
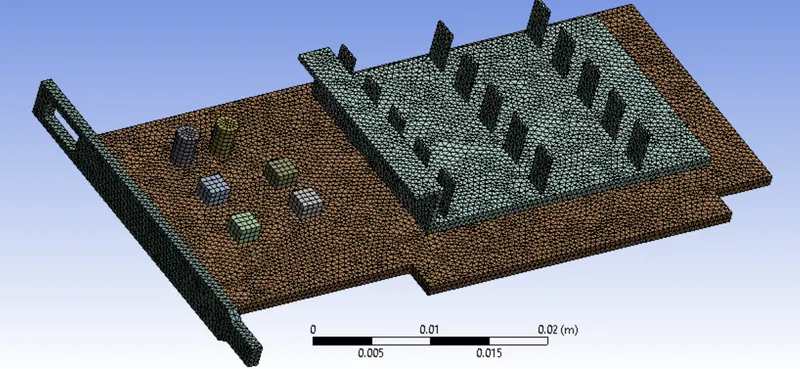
The geometry made in design modeller for the cfd analysis is shown below
Materials:
Fins - aluminum
Processor - silicon (density=2000 kg/m3, heat capacity = 710 j/kgK, thermal conductivity = 150 W/mK)
PCB - FR4 (density=1850 kg/m3, heat capacity = 950 j/kgK, thermal conductivity = 0.29 W/mK)
Fluid - air
Mesh settings:
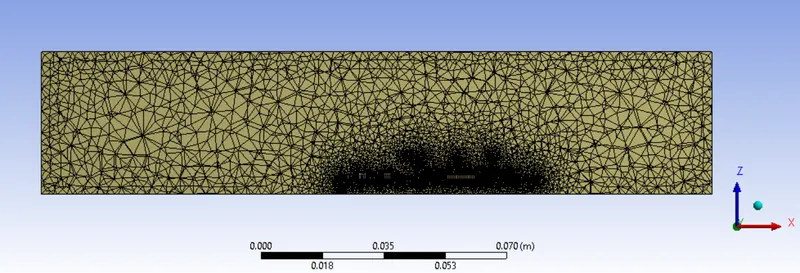
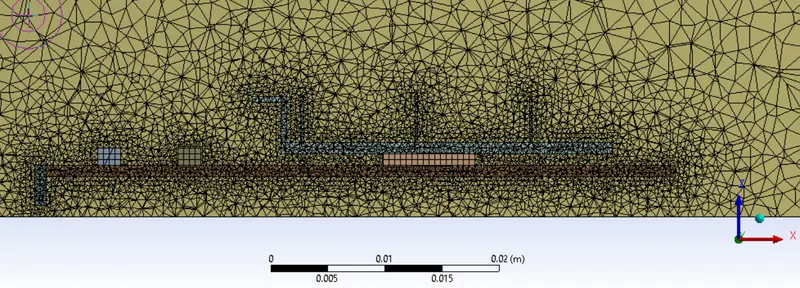
Element size for all parts = 0.0005 m
Number of elements = 787636 (FINE mesh for all cases)
The conformal mesh is made for proper CHT analysis.
Fluent setup:
Steady state analysis
pressure-based solver
K-epsilon realizable model
inlet velocity = 2 m/s, 4 m/s, 6 m/s
Heat generation rate of processor = 2.34 W/m3
Solutions:
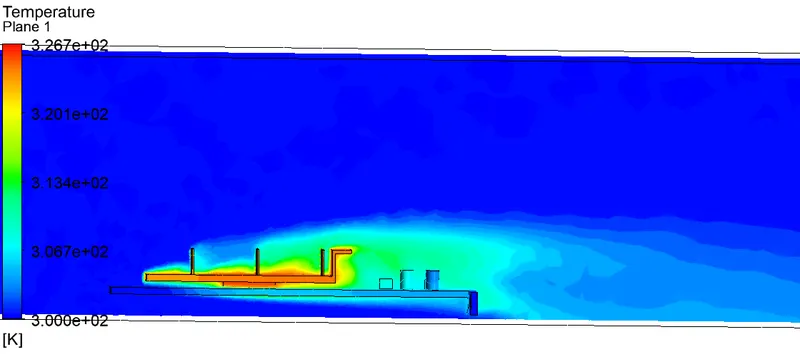
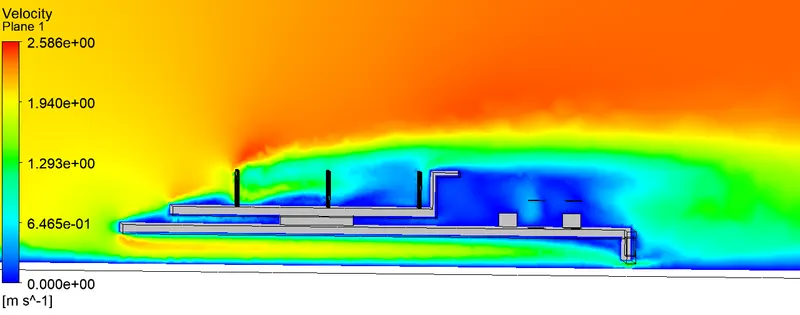
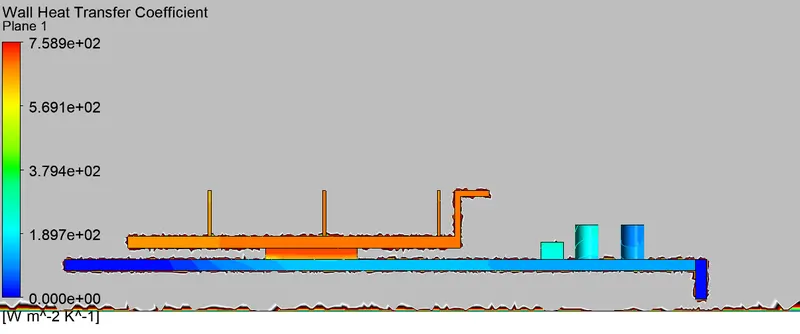
Case 1 - 2m/s
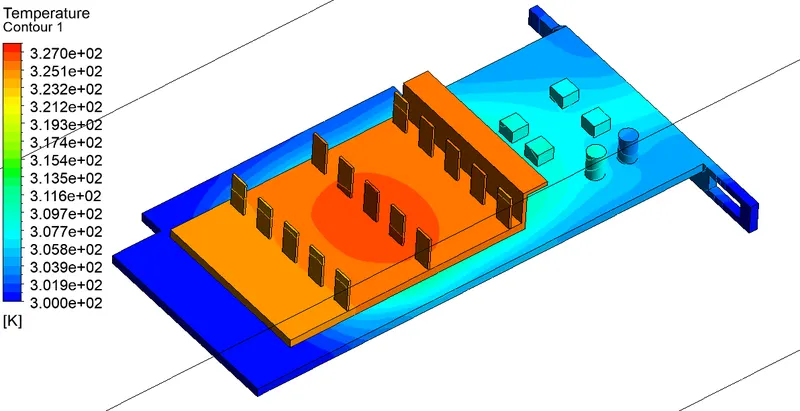
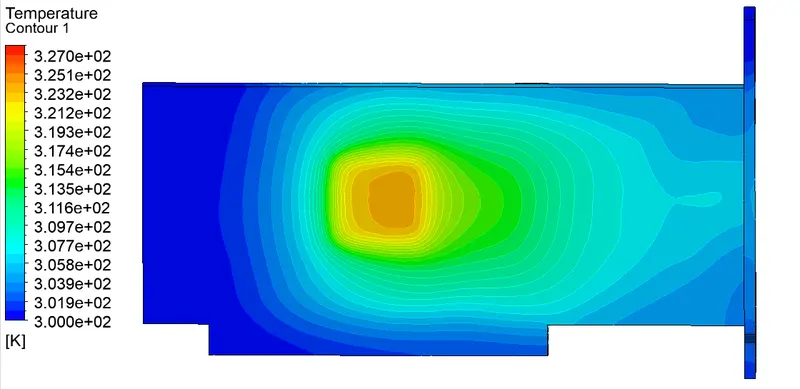
The converged solutiuon, temperature, velocity and heat transfer coefficient variation along the graphics card is shown for the particular inlet velocity:
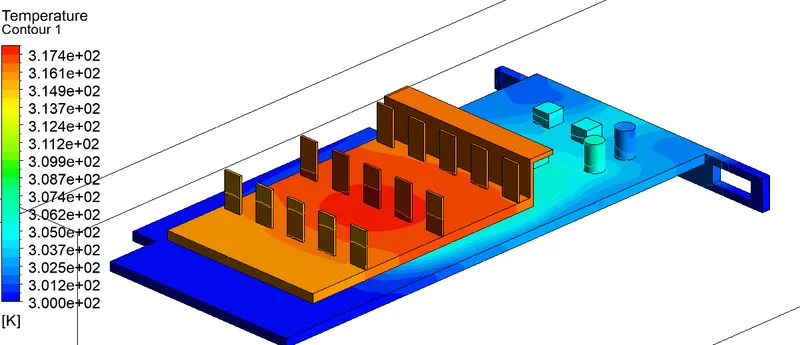
Case 2 - 4 m/s
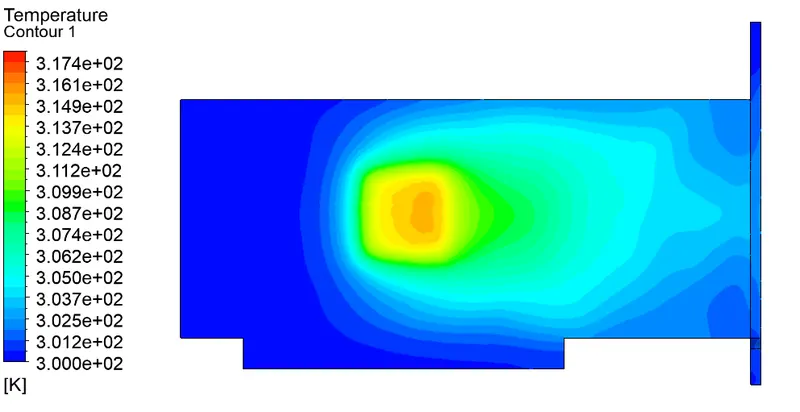
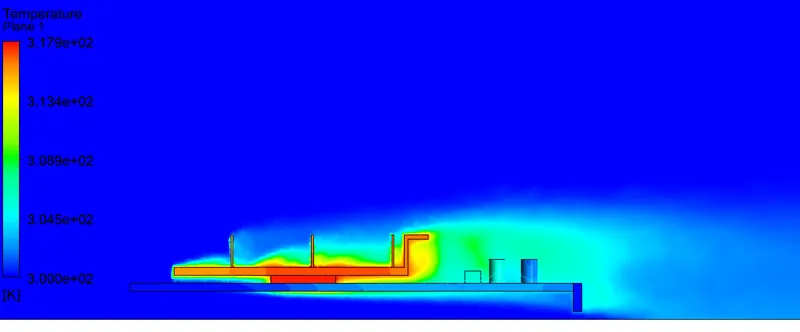
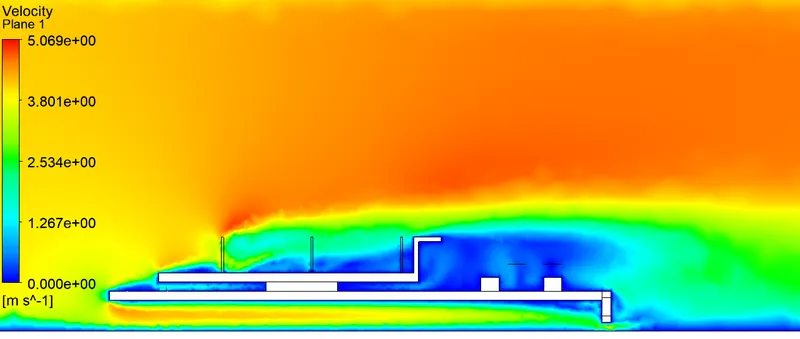
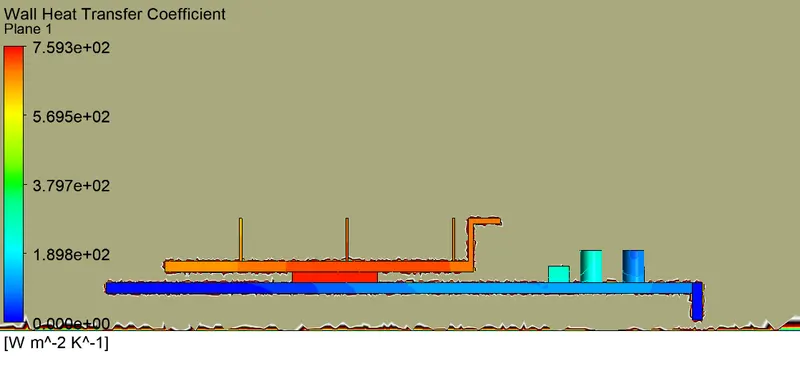
The converged solutiuon, temperature, velocity and heat transfer coefficient variation along the graphics card is shown for the particular inlet velocity:
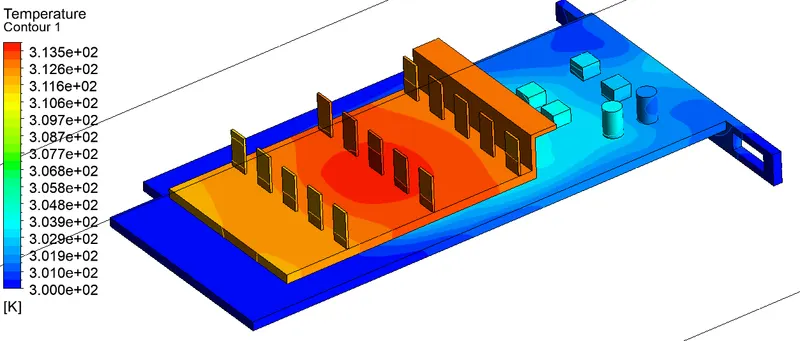
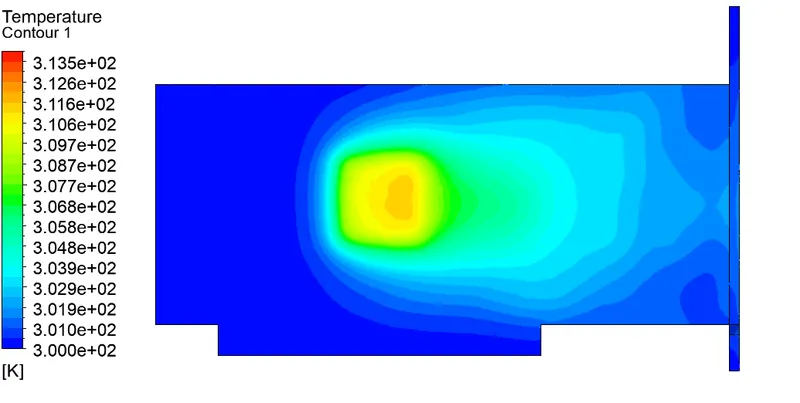
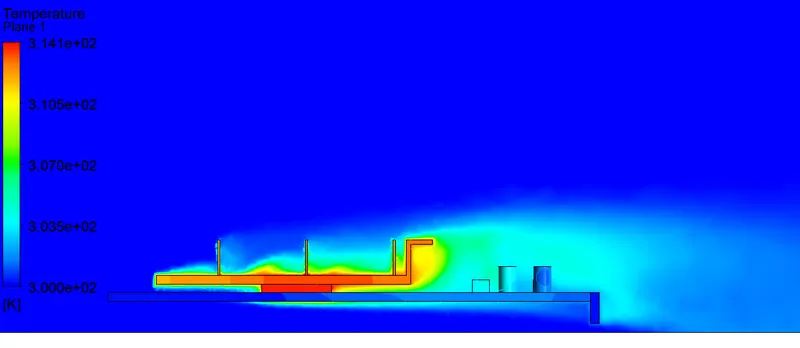
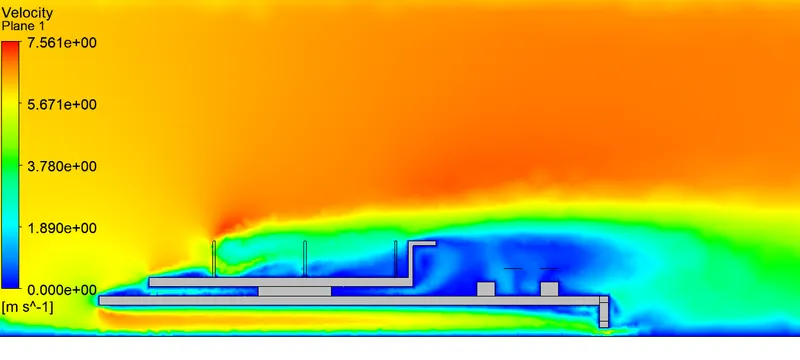
Case 2 - 6 m/s
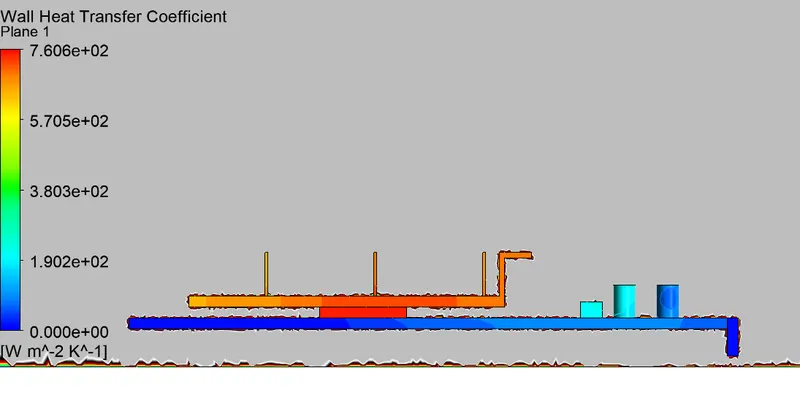
The converged solutiuon, temperature, velocity and heat transfer coefficient variation along the graphics card is shown for the particular inlet velocity:
Results and conclusion :
| Velocity (m/s) | Highest Temperature (K) | Wall heat transfer coeff. (W/m2.K) |
| 2 | 327 | 758.9 |
| 4 | 317.4 | 759.3 |
| 6 | 313.5 | 760.6 |
Based on the numerical analysis we observed that with the increase in inlet flow velocity the forced convection increases resulting in more heat transfer, so reduces the processor's heat. This can also be seen from the velocity and temperature contours in the plane. But we can not keep on increasing the fan speed as it will take more power and will result in more noise and even vibration, so there should be a proper balance according to the need. The hotspot region is the processor and the fins for all cases form where the heat is generated and transferred mostly.
Also, we can see the wall heat transfer coefficient increases with the increase in flow velocity due to more heat transfer.
FILE LINK:
https://drive.google.com/file/d/1AQ1Lzpps_SZR3_kBbvYzIz1E9nukSTLI/view?usp=sharing