Week 6 - CHT Analysis on a Graphics card
Aim: To run the steady state conjugate heat transfer analysis on the graphics card with varying fluid velocity and ensuring the mesh independency.
Objective:
- Import the gemoetry.
- Clean the geometry of any error.
- Mesh the geometry with the appropriate size and type.
- Run the simulation for different velocities.
- Explain the effect of the variations on the study.
Content of the body:
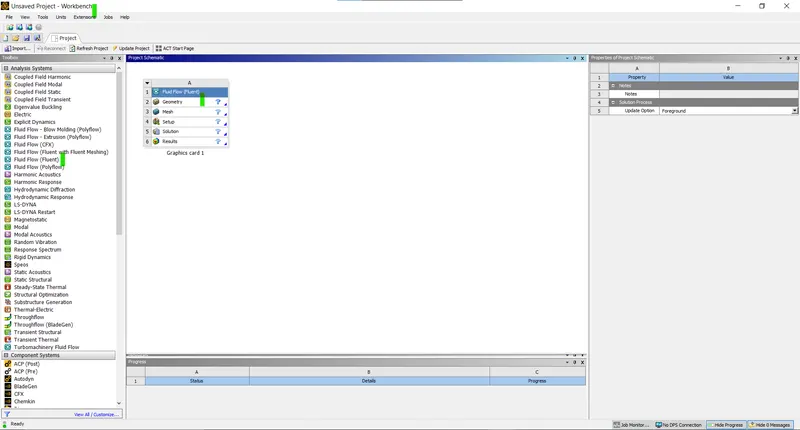
- Open the Ansys Fluent in the workbench and import the geometry:
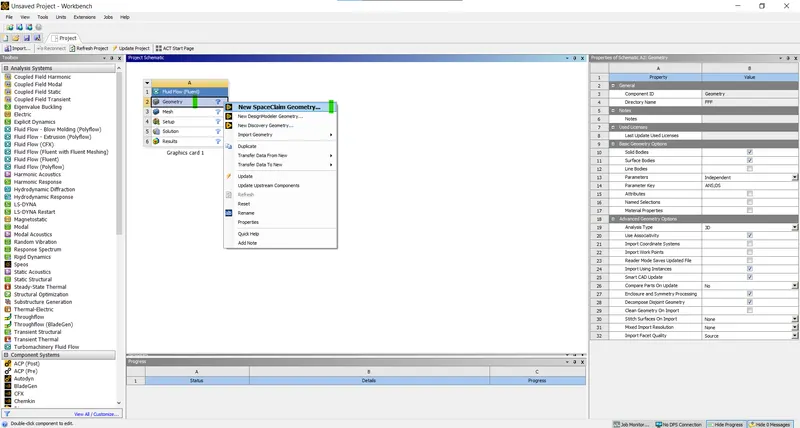
- Open the spaceclaim:
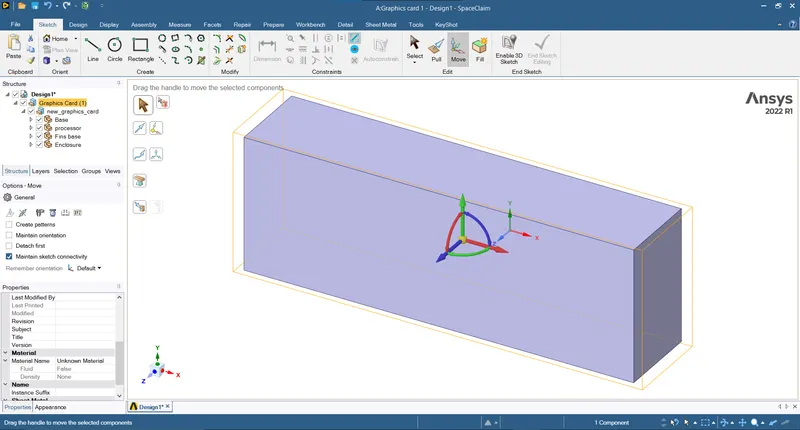
- Import the geometry (Drag and drop or open the file):
- Now to find any errors or anomalies (Repair > Extra Edges > Ok):
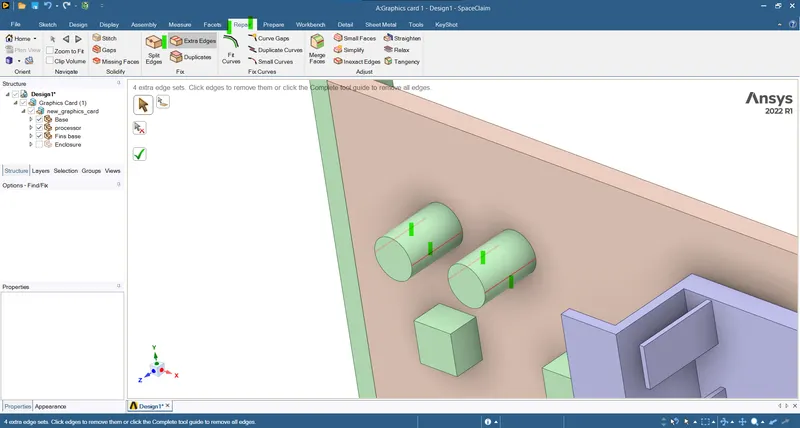
- Four extra edges are foound and repaired.
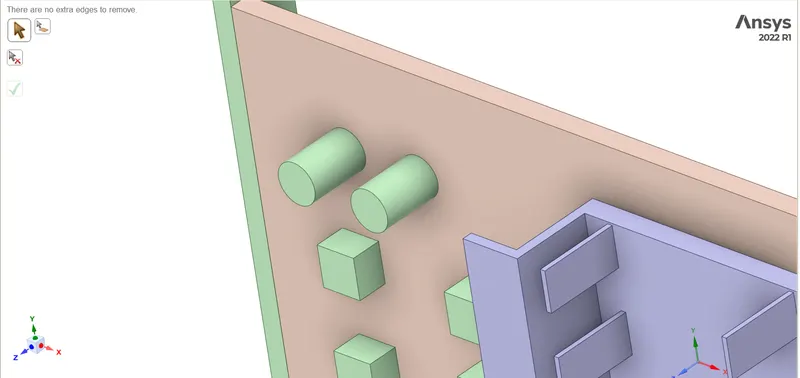
- Now to ensure the geometry topology is shared (Workbench > Share > Ok):
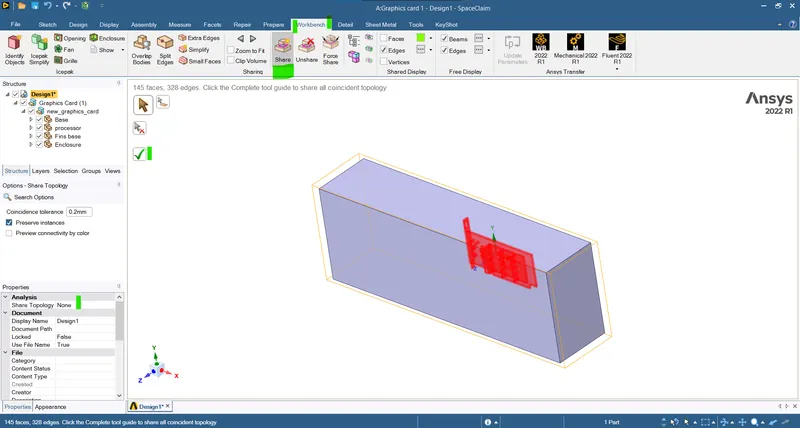
- Since the topology is not shared we need to share the topology:
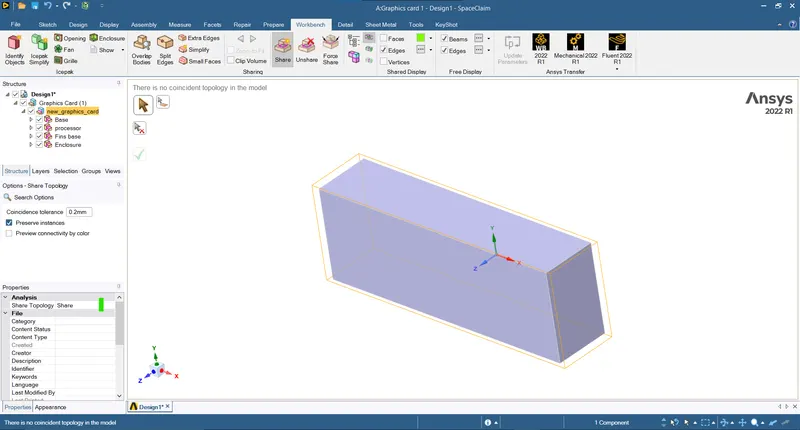
- Now the geometry topology is shared we can proceed to the Meshing.
- Meshing:
- We are going to create a mesh which is finer near the processor and the fins as the majority of the interaction and the analyses are based on it.
- We will refine the processor, fins and the volumes incontact or near it.
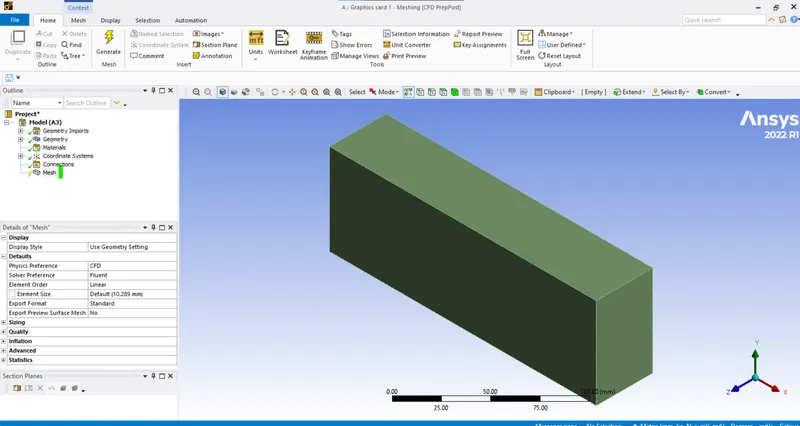
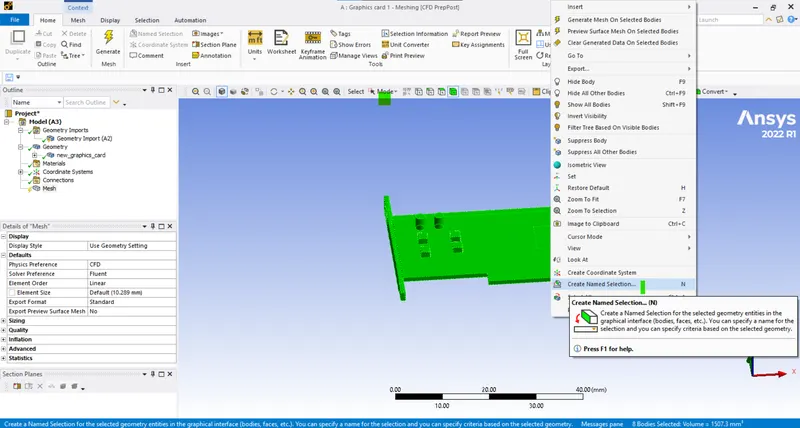
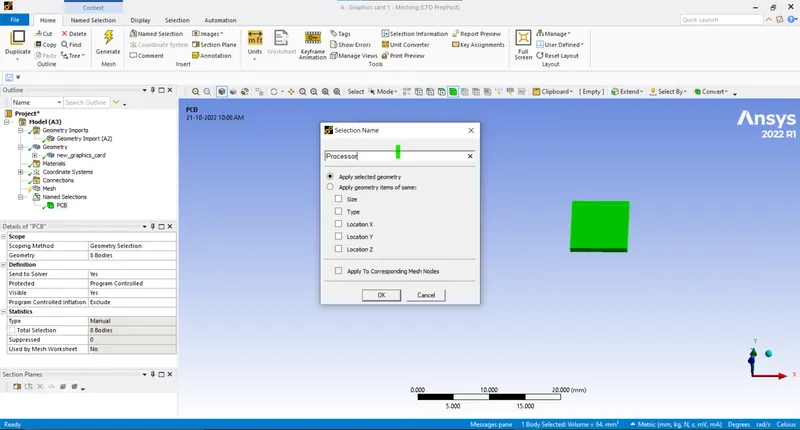
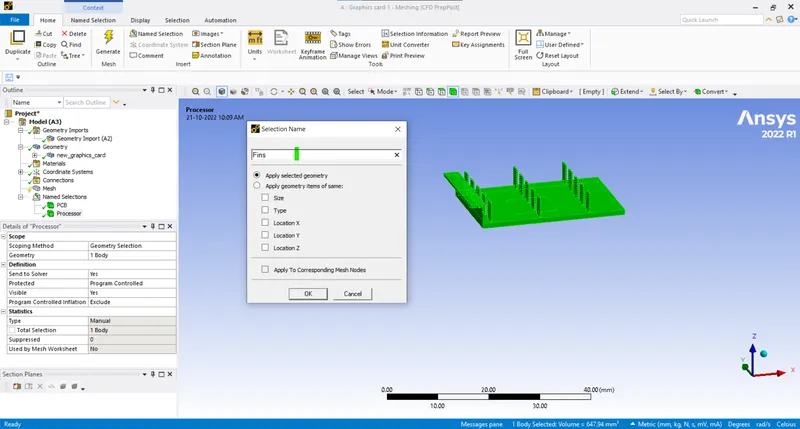
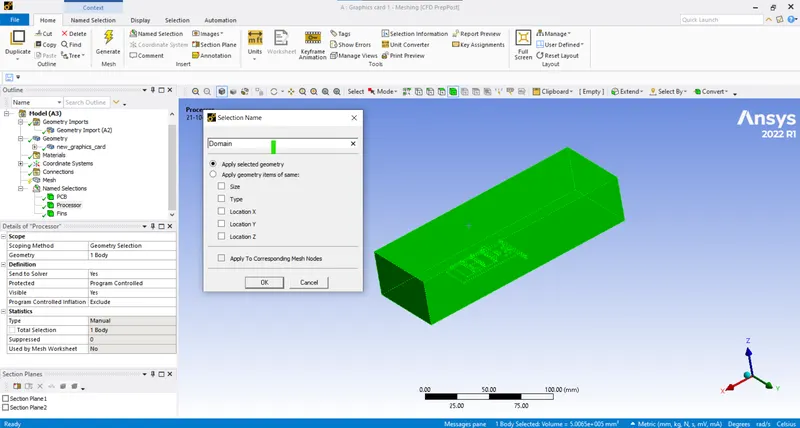
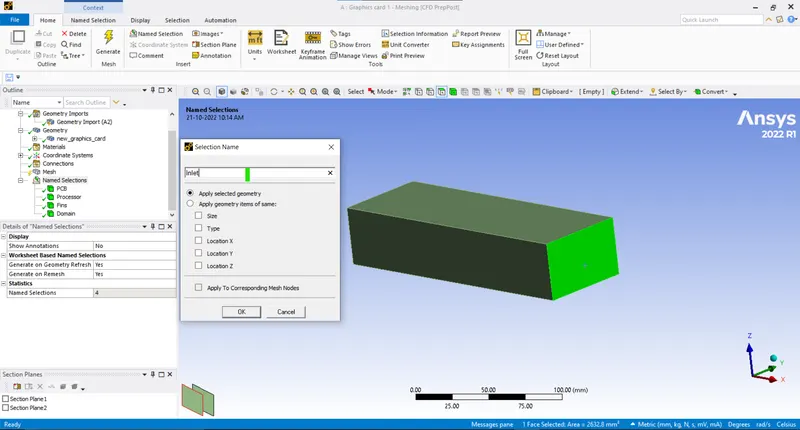
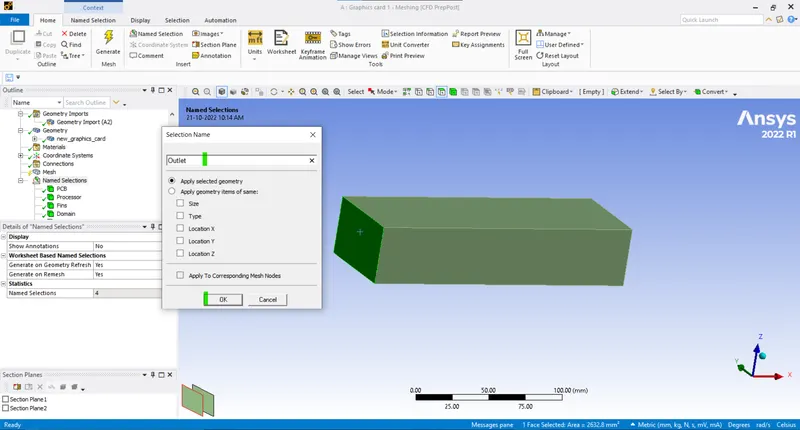
- Creating the named selection (Select the volume > Right click > Name > Ok):
- PCB:
- Processor:
- Fins:
- Enclosure/Domain:
- Inlet:
- Outlet:
- Creating the basic mesh (Mesh > Generate mesh > Update):
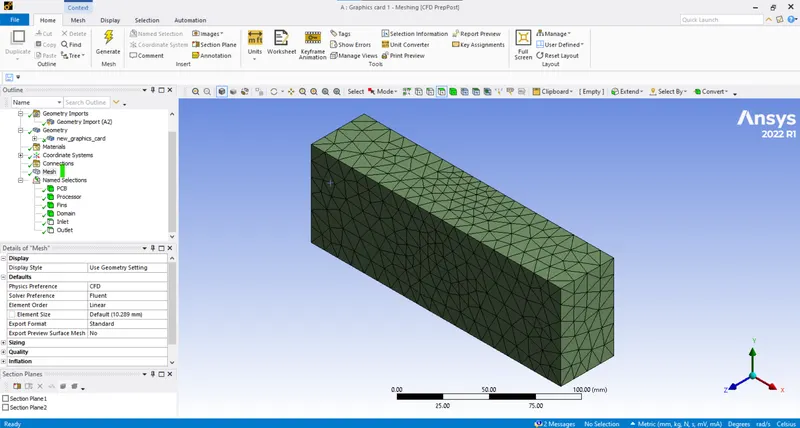
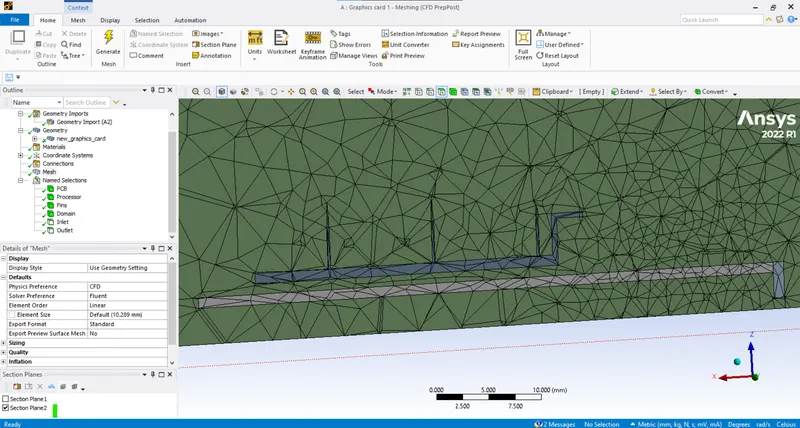
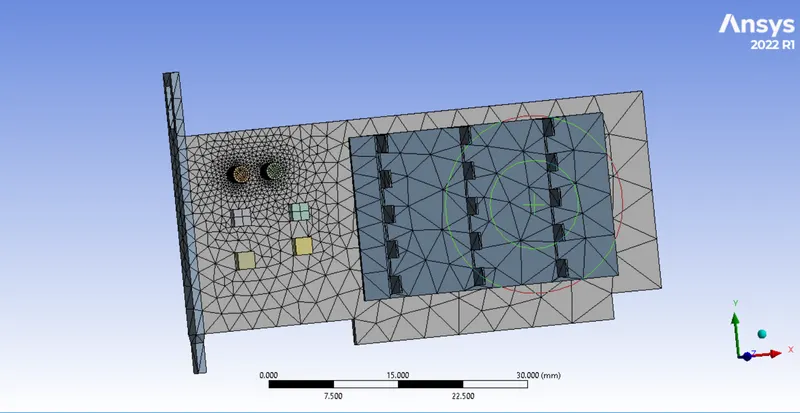
- Since we can see the topology is shared and the mesh is concealed we can proceed for refinement of the mesh near the processor:
- Processor edge sizing:
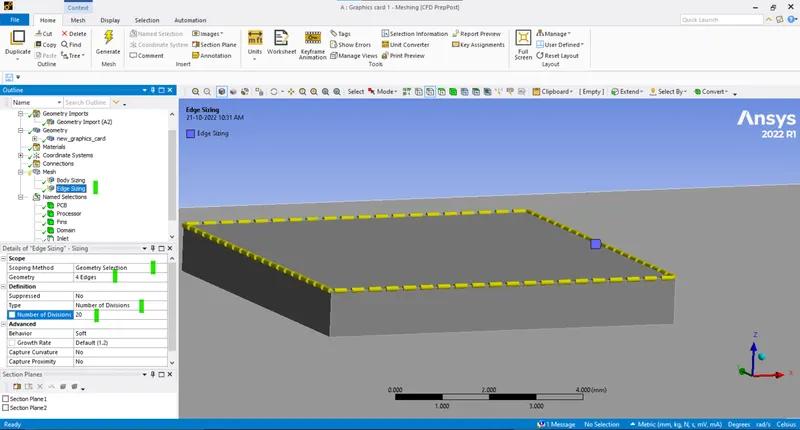
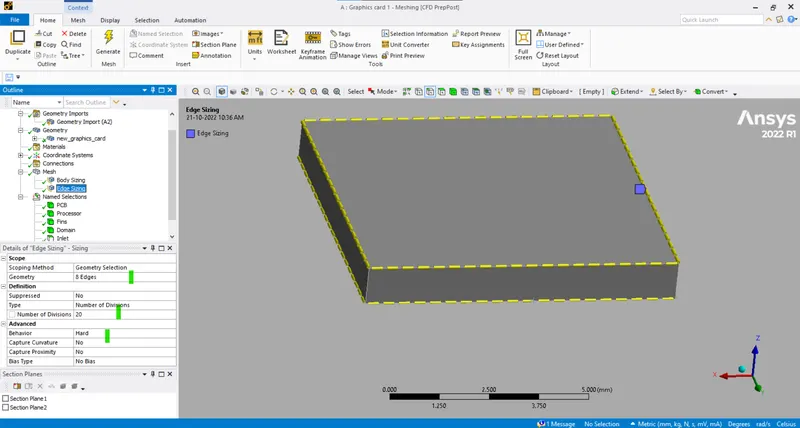
- Body sizing (Fins):
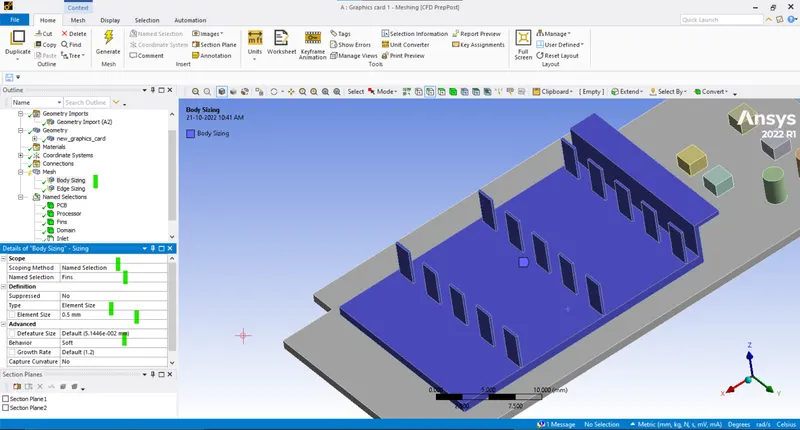
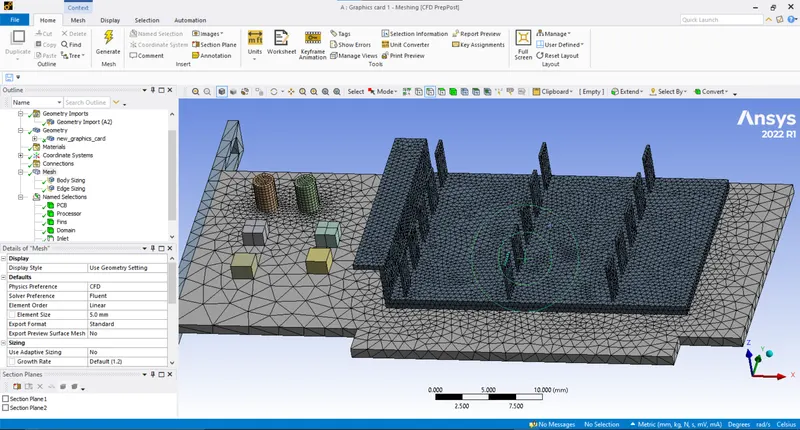
- Total mesh count (Base line mesh - 5mm):
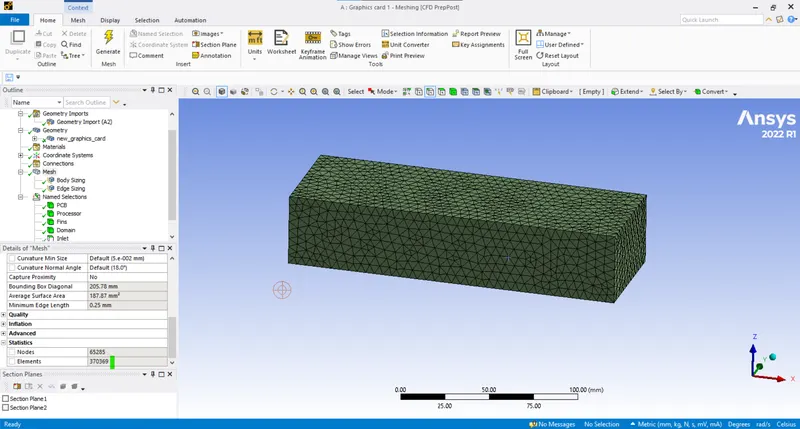
- Now as the meshing is complete we can proceed to the pre-processing.
- Total cell count/mesh count is 370369.
- Setup:
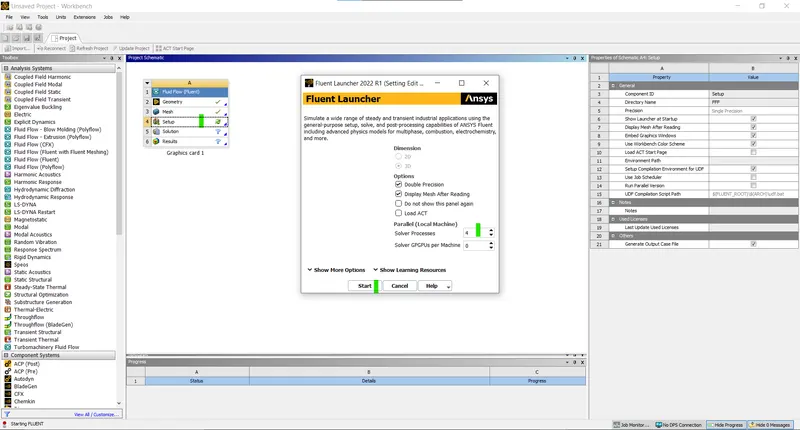
- As we are dealing with the temperature also we need to activate the Energy equations:
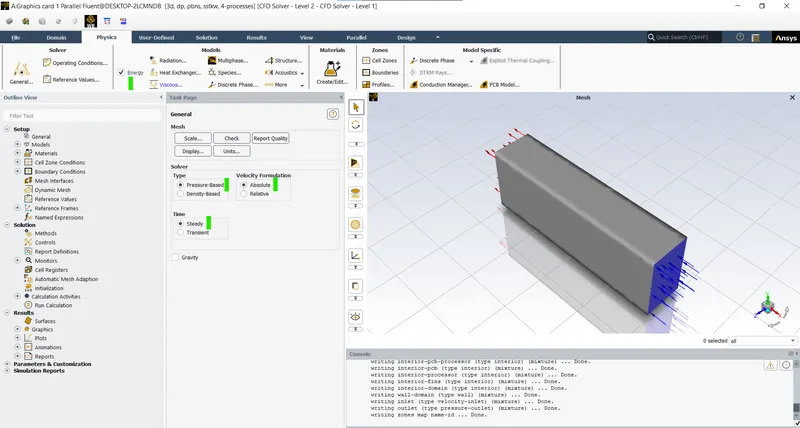
- The solver is pressure based and steady state solver.
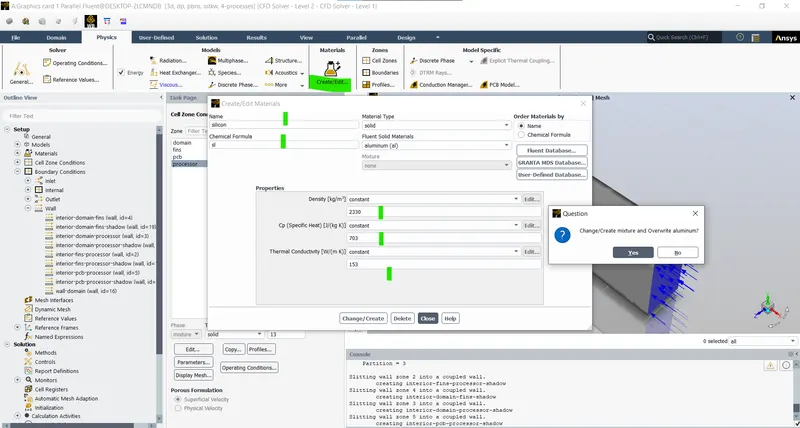
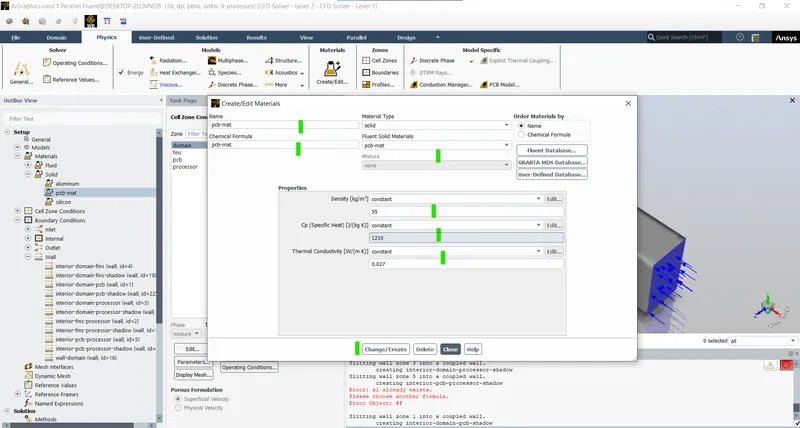
- Now create the materials which are no available in the directory (Create/Edit > name > Properties > Create.change):
- Silicon:
- PCB - Polystyrene:
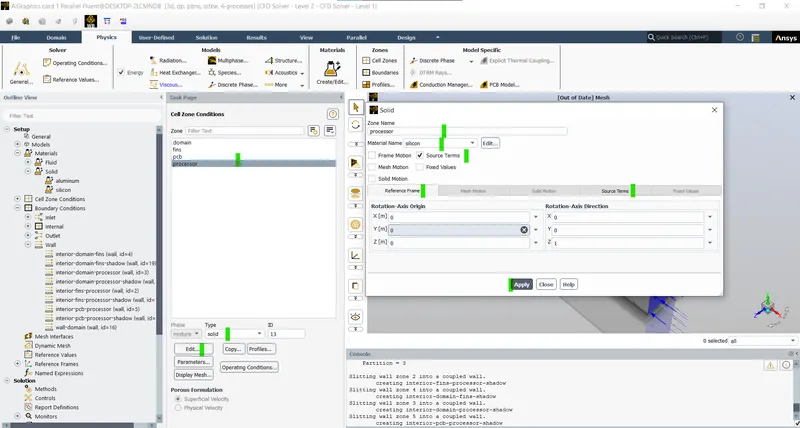
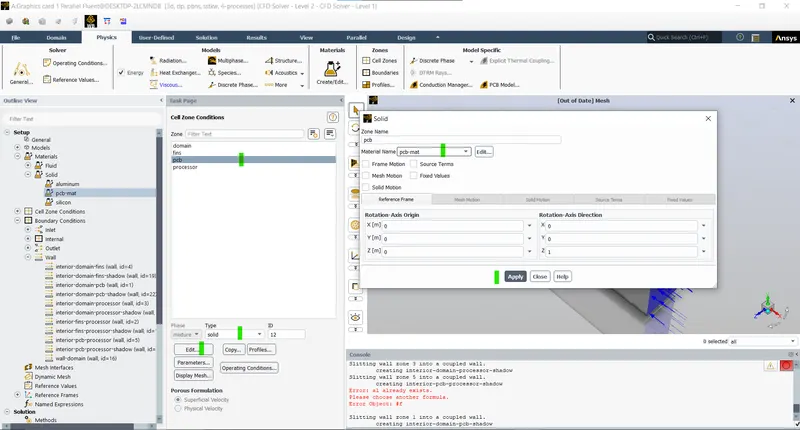
- Assining the materials:
- Processor - Silicon:
- PCB:
- Fins:
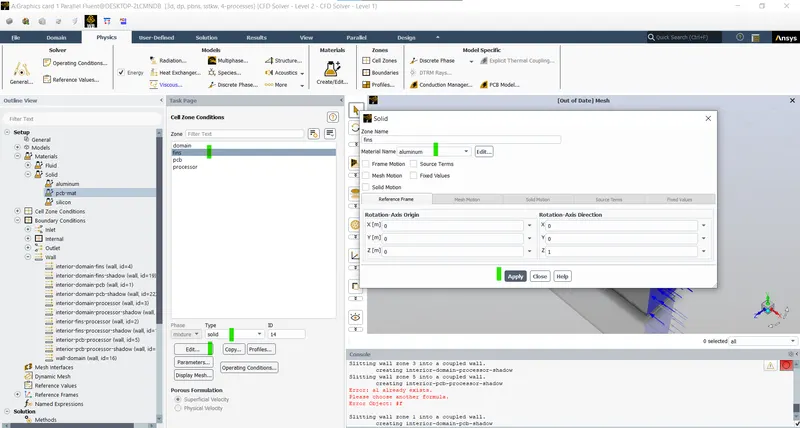
- The material choosen for the fin is aluminum as this is one of the most used material for the fins.
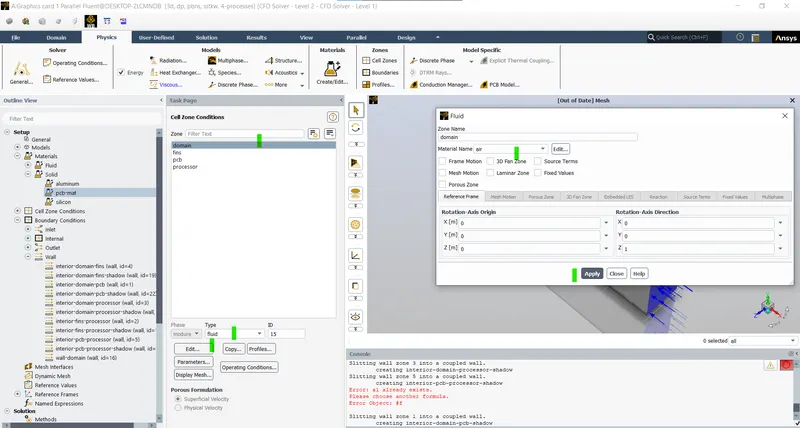
- Domain:
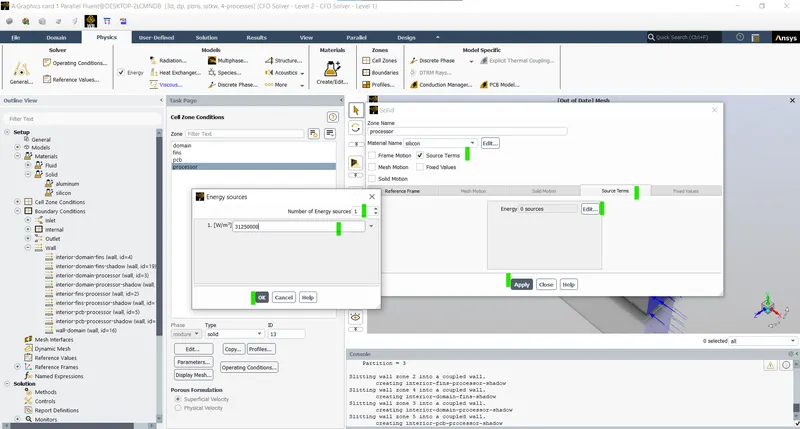
- Heat geneeration in the processor:
- We assume the heat generates from the processor is 2 Watts so, volumetrically we have the processor:
- Now Volume of the processor is l *b *h = 8*8*1 = 64`mm^3` = 64 `10^-9m`
- q = 2 W.
- Now the energy from the processor is = q/volume = `(2/(64*10^-9))`= 31250000 `(W)/m^3`.
- This is the amount of energy produced by the processors in the form of heat.
- Inlet conditions:
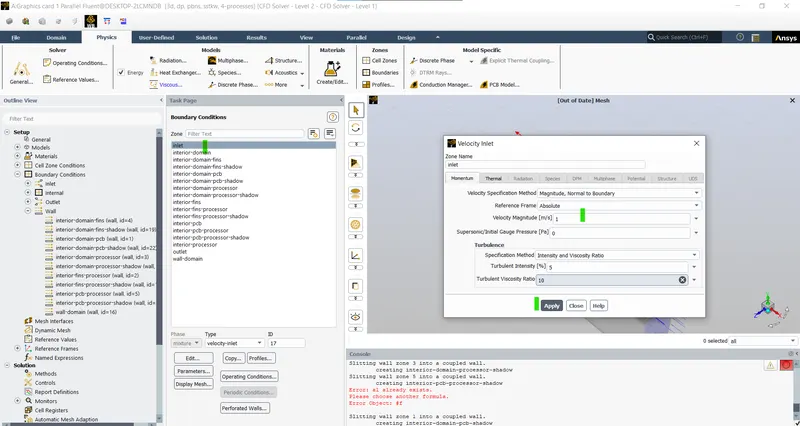
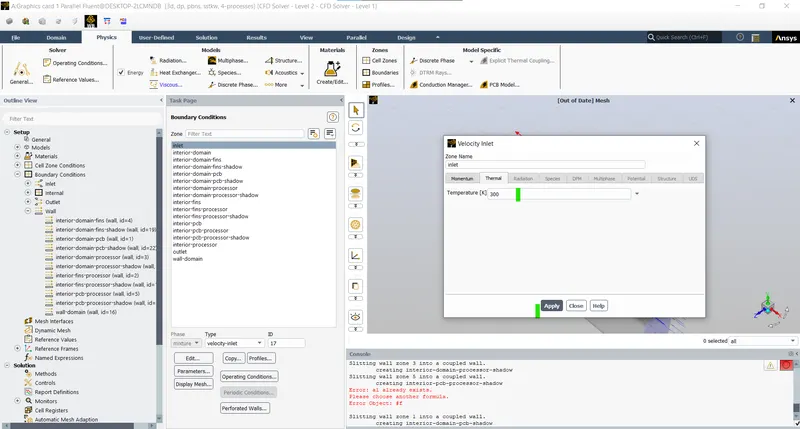
- Inlet is selected as velocity inlet with a velocity of 1m/s and temeperture of 300k.
- Outlet:
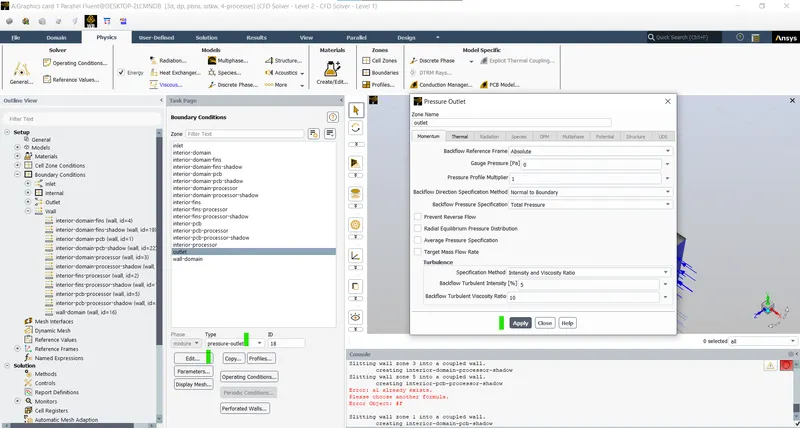
- Outlet is the pressure outlet.
- Creating the animation file from the contours:
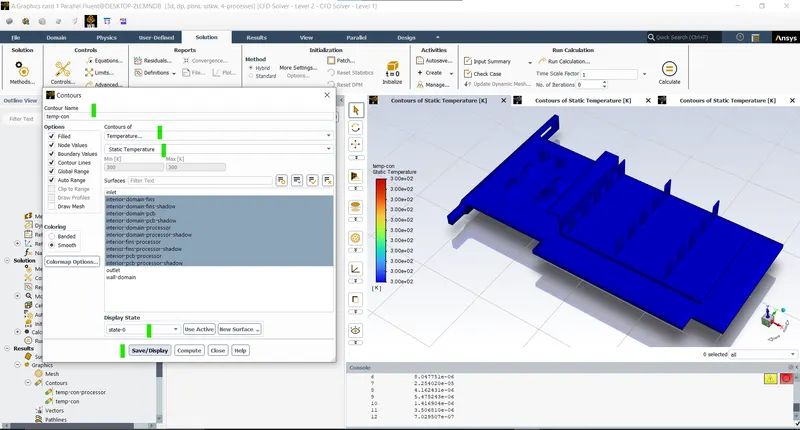
- Creating the contours.
- Here we are interested in the temperrature contours of the fin and the processor so hiding all the other parts like domain, inlet and outlet and creating the contours (Results > Contours > Name > Select the area > Select the criteria > Ok):
- Here we are going to create the temperatture animation from the contours created earlier (Solution > Create > Solution animation > Select the contours > Ok):
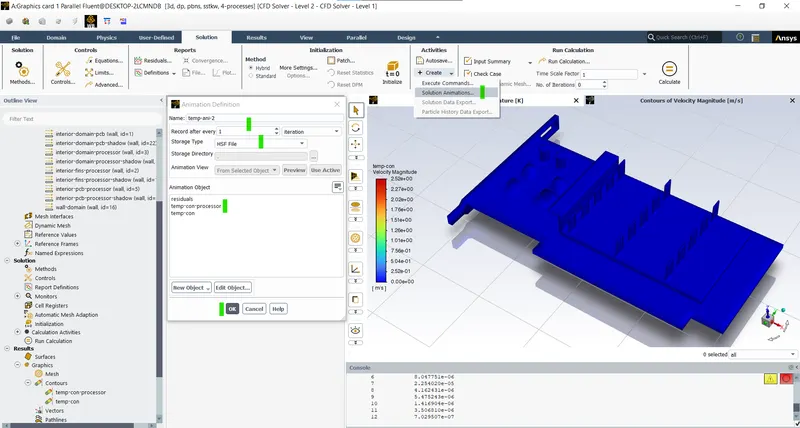
- This animation will be helpful in understanding the temperature distribution as the simulation proceeds.
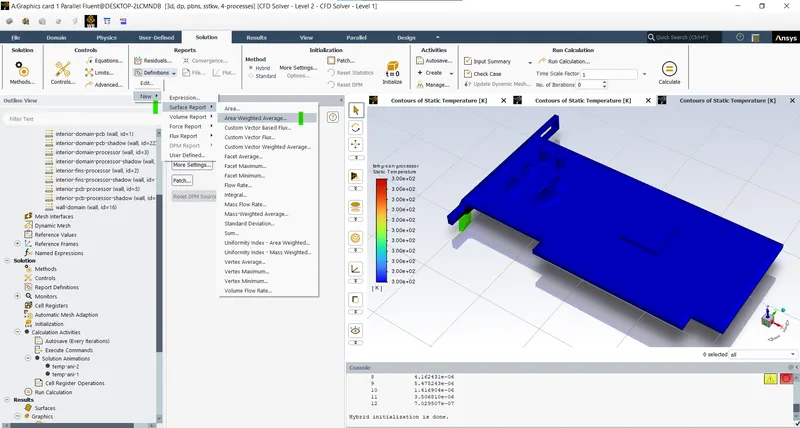
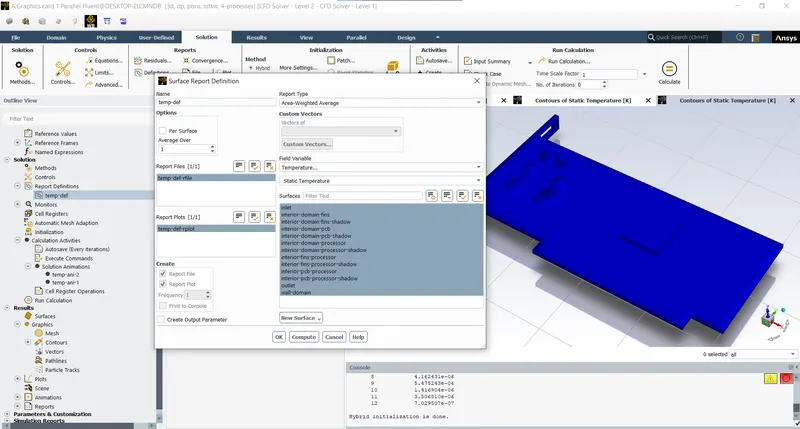
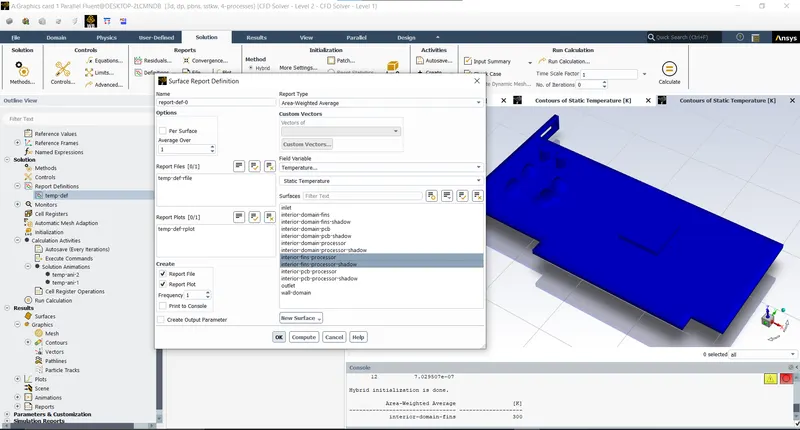
- Create the report definitions (Definitions > New > Surface reports > Area weighted average > Temperature > Select the aera > Ok):
- Now initialize the setup (Solutions > Iniatialize > Hybrid initialization > Set the number of iterations > Ok) :
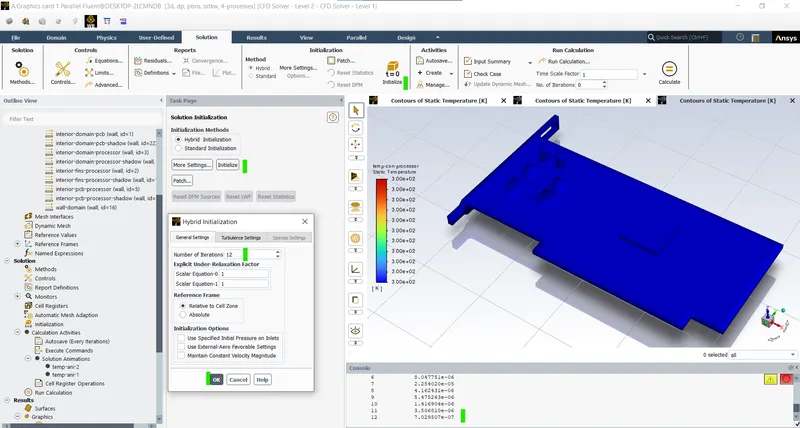
- The initialization used for the setup is the hybrid initialization.
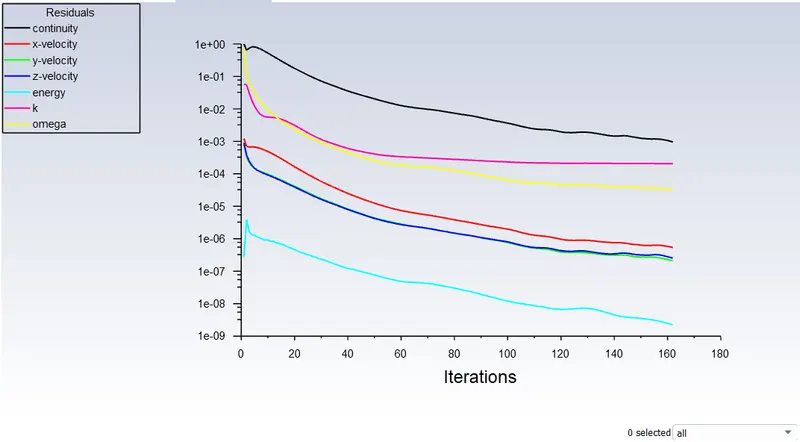
- Run the simulation for 500 iterations or till it converges:
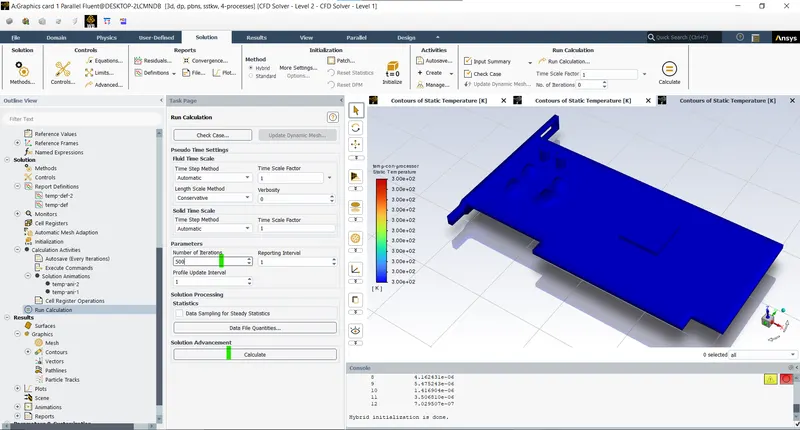
- Now as the solution is run and converged we can proceed to the post processing to analyze the results in detail.
- Post-processing:
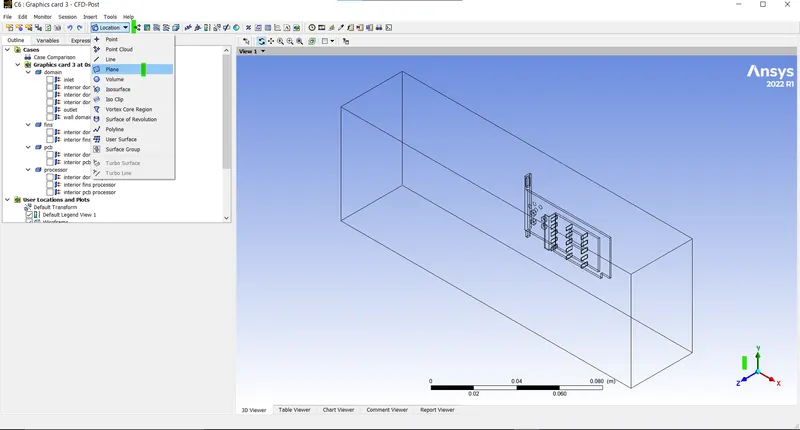
- First create a plane in the xz plane for the visulaization of the temperature, velocity and respective animations (Location > Plane > xz plane > Apply):
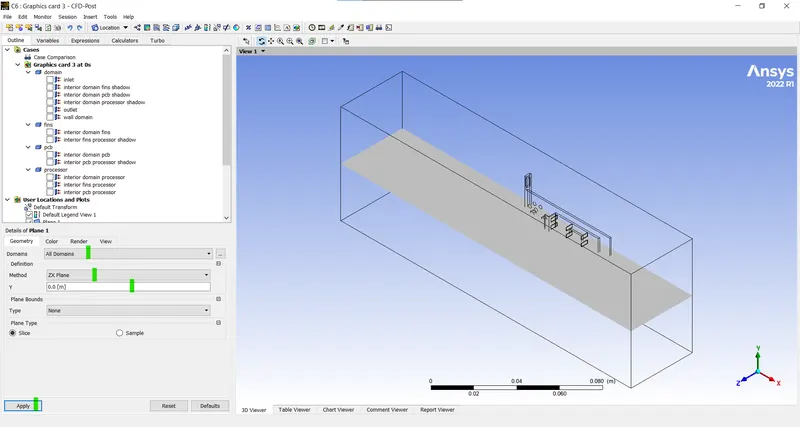
- Now to visualize the temperature contours (Variable > Temperature > Apply):
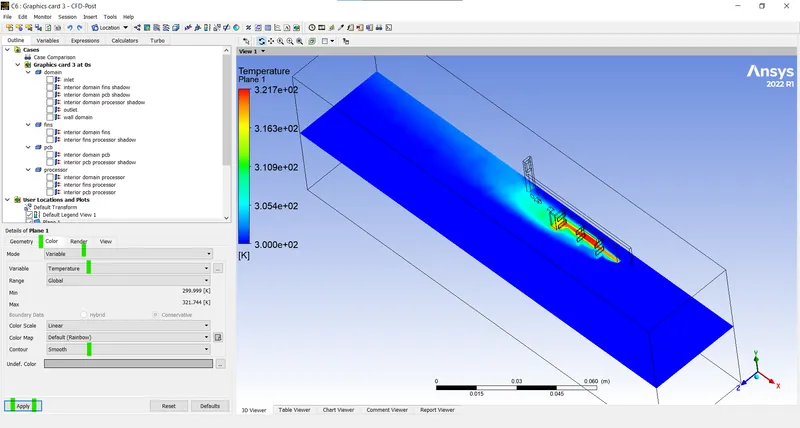
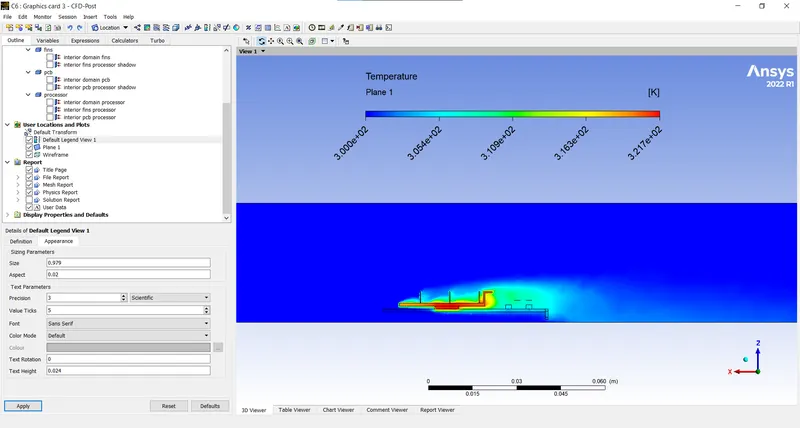
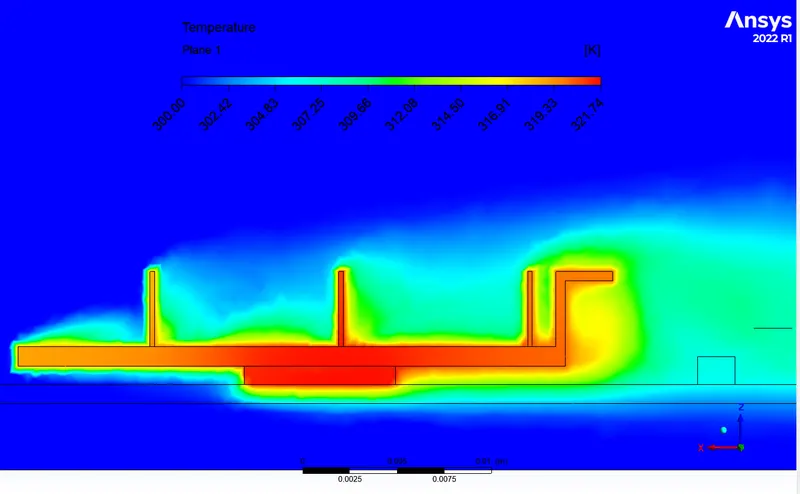
- The above contour displays the temperature across the plane mention.
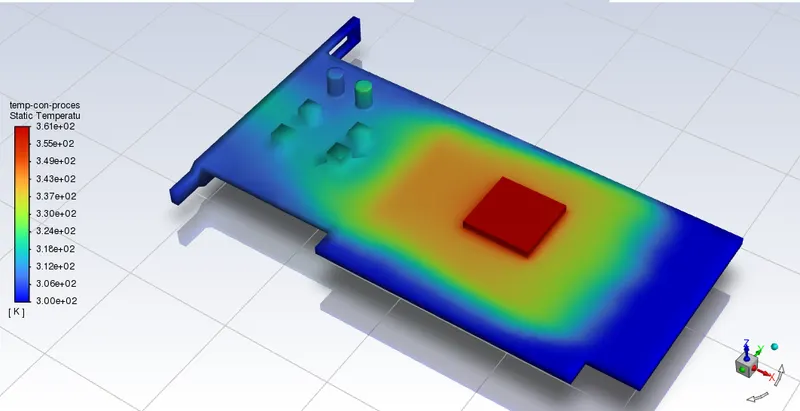
- As we can see that the processor has the highest temperature followed by the fins which have the major role in increasing the surface area and intern increasing the heat transfer rate as it has more contact surface for the heat transfer.
- Now to view the velocity flow (Color > Variable > Velocity):
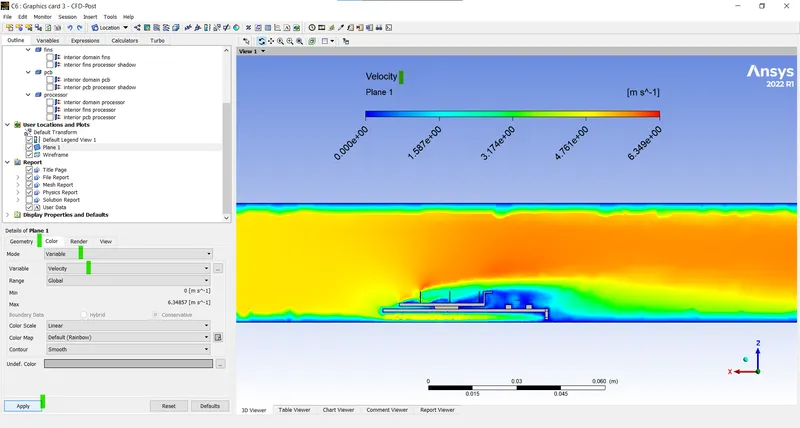
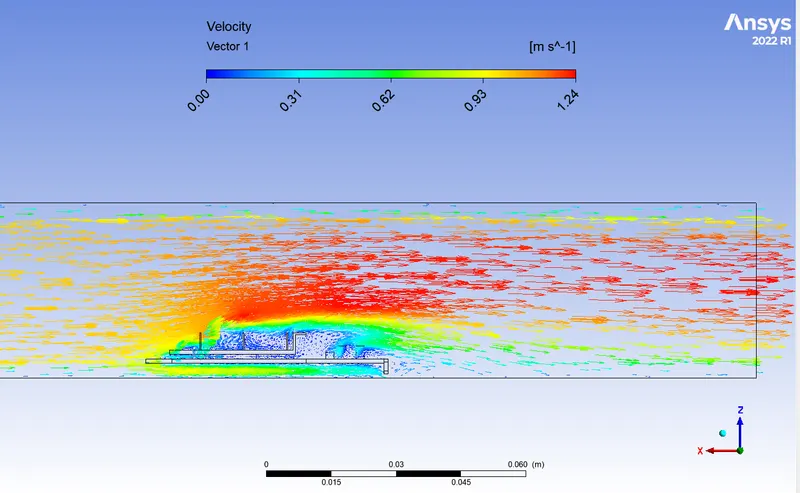
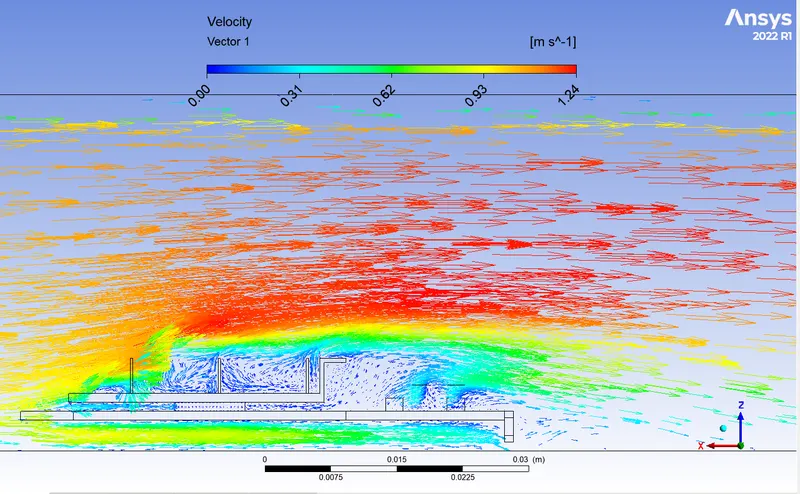
- The about contours show the variation of the vvelocity acroos the surface of the plane of the body, as we can see that there is no slip region near the walls.
- We can see due to the contraction in the volume due to the pressence of the graphics card the velocity is higher than the inlet velocity across the graphics card.
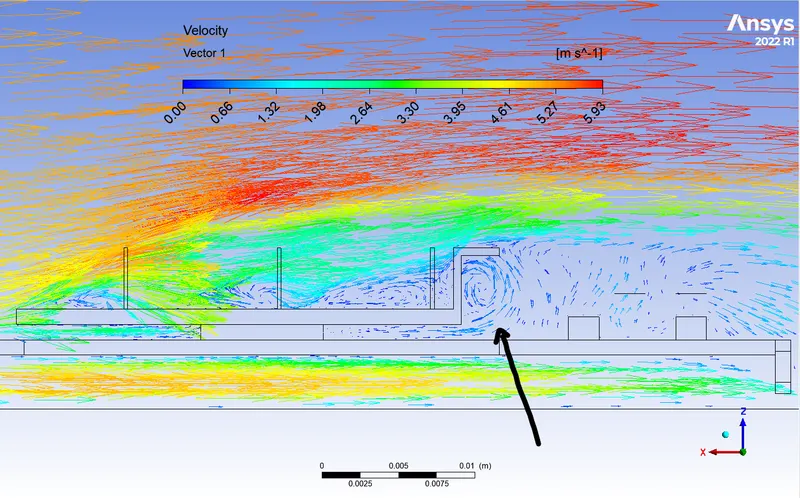
- We can observe that there are some low velocity flow region behind the first set of the extrusion of the fins due to the sudden changes geometry the vortex are formed.
- Creating the velocity vectors (Vectors > variable as velocity):
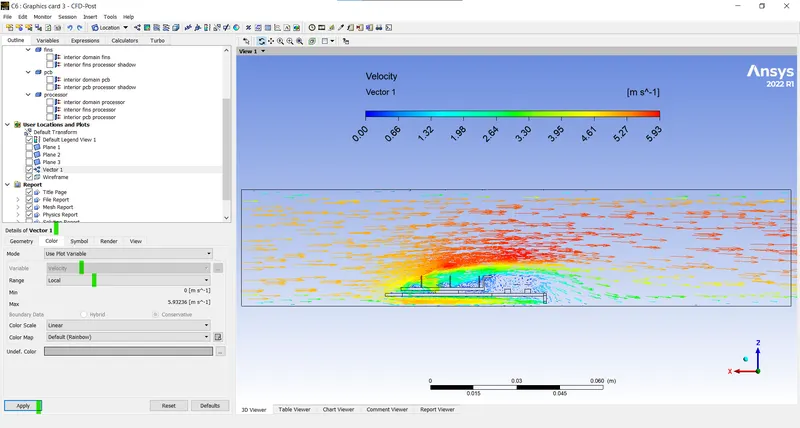
- This plot shows the directiion vector of the fluid motion.
Results:
- Case-1:
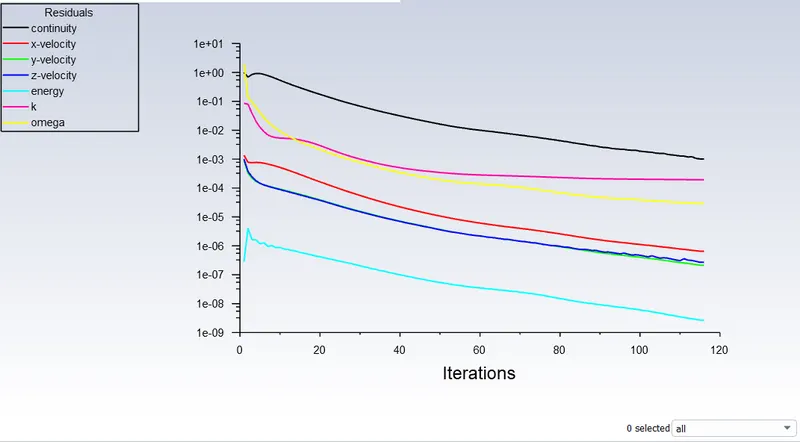
- Residuals:
- Report plots:
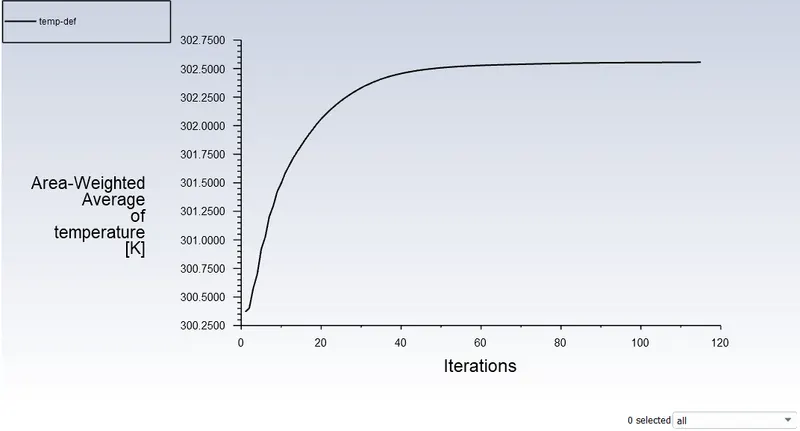
- Temperature:
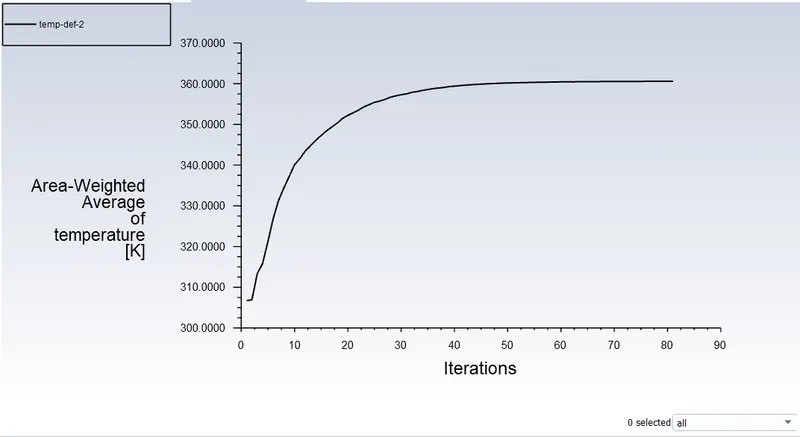
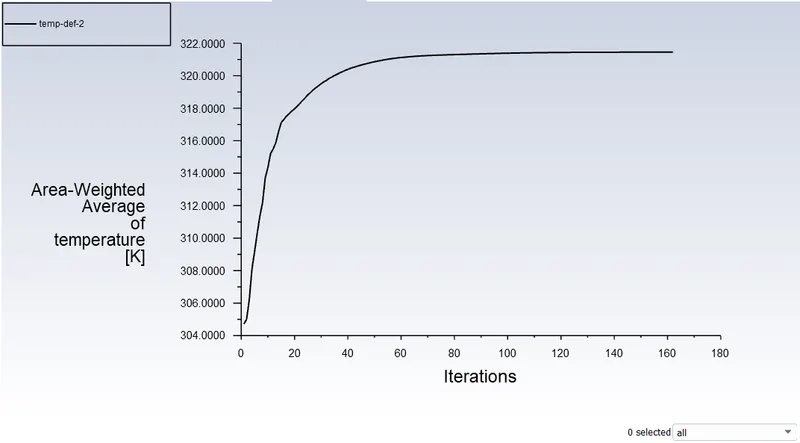
- The above report plot shows the average temperature of the fins as it varies throughout the iterations.
- Temperature contours:
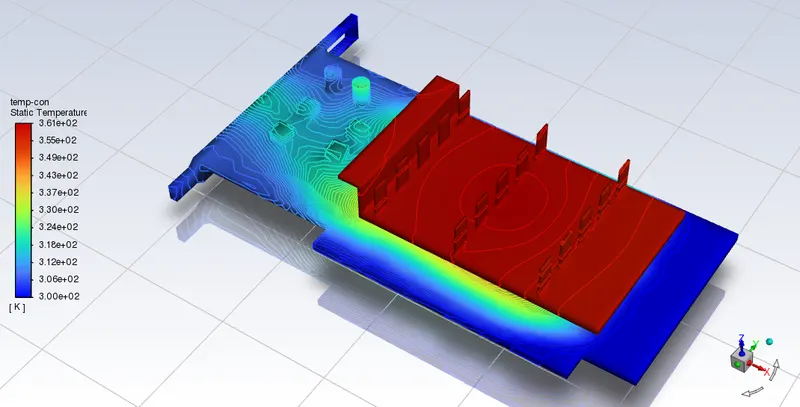
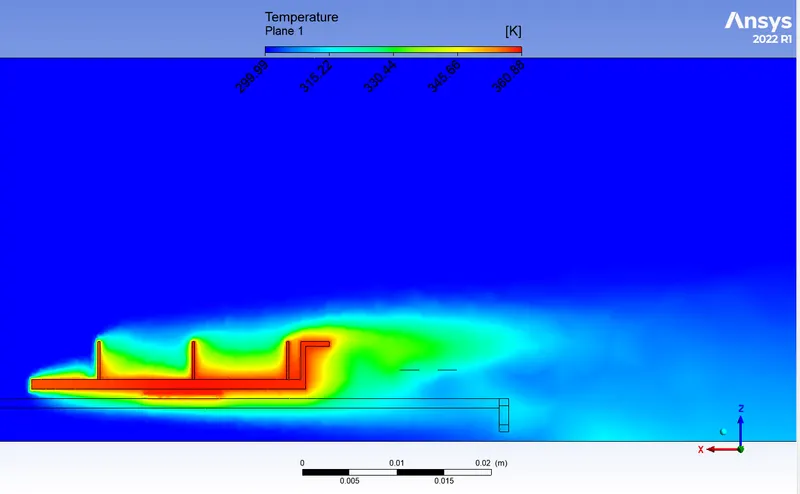
- The contour plot represents the temperature variation of all parts of the graphics card, as it can be observed that the temperature of the fin at the interaface of the fin and processors is high as the heat from the processors gets transfered more easily from processor to fin as it has higher heat transfer rate compared to other parts of the cards.
- The fluid moving carries the heat along with it as a result the parts behind the fins in the direction of the fluid flow heats up.
- As the fluid flow is very low (1m/s) compared to other cases the tremperature of the fins is higher comnpared to the other cases were the fluid flow velocity is comparitively high.
- The area
- Velocity vectors:
- Residuals:
- Case-2:
- Residuals:
- Report plots:
- Temperature contours:
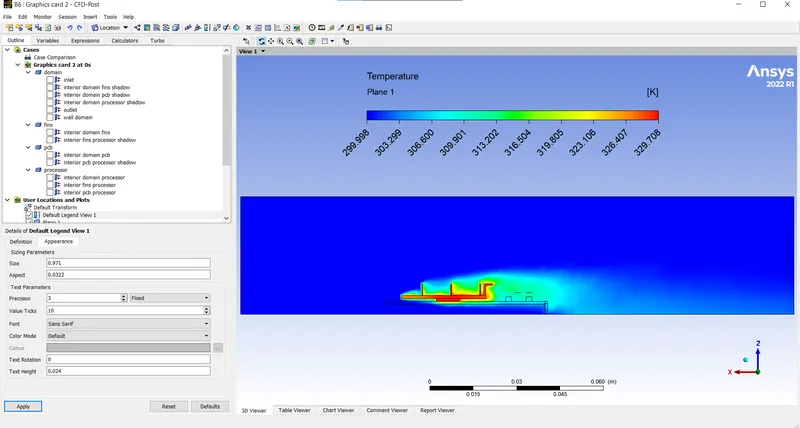
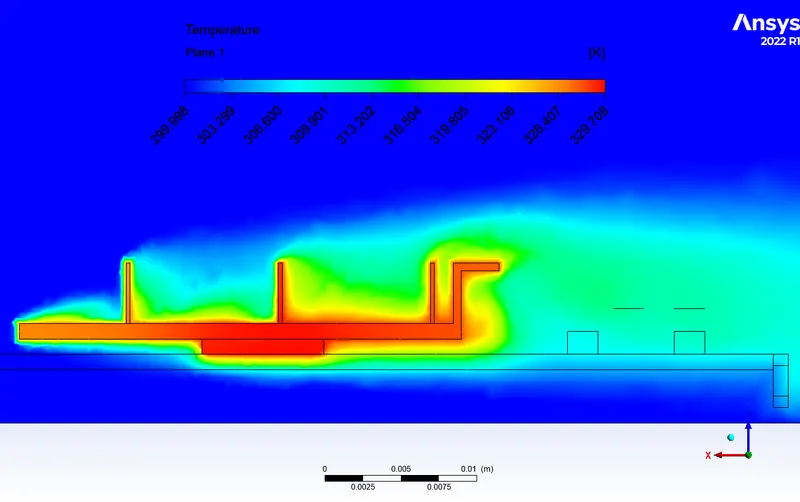
- Here it can be seen that the fluid near the fins and the processor side walls is at very high temperature as it is in direct contact with the fins and the processor.
- Velocity contours and vectors:
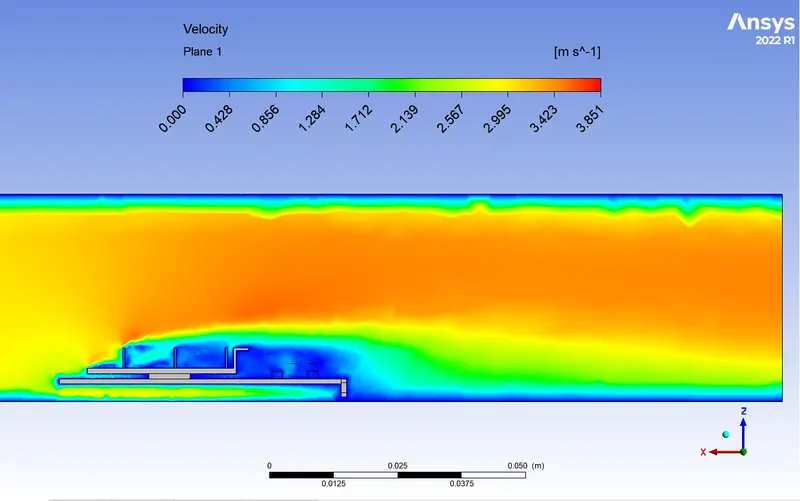
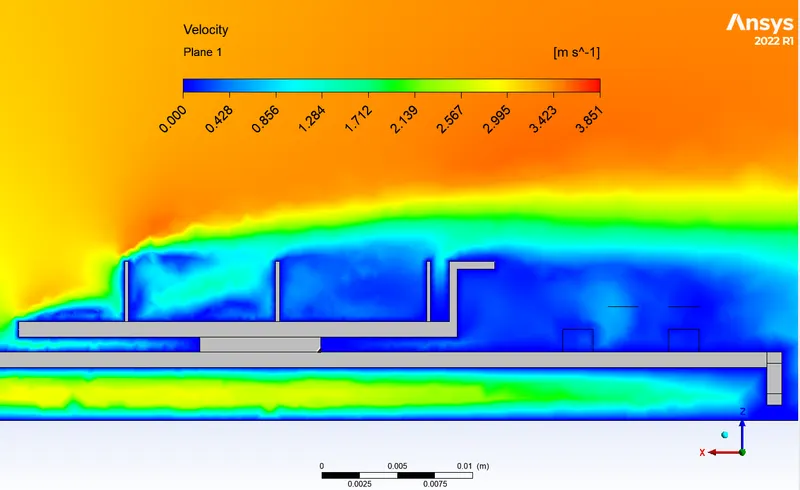
- Here it can seen that the near the cross sectional area were the graphics card is present the flow area is less so the velocity of the fluid increases to maintain the flow rate, the flow is not able reach the back parts of the graphics card due to the obstructions present.
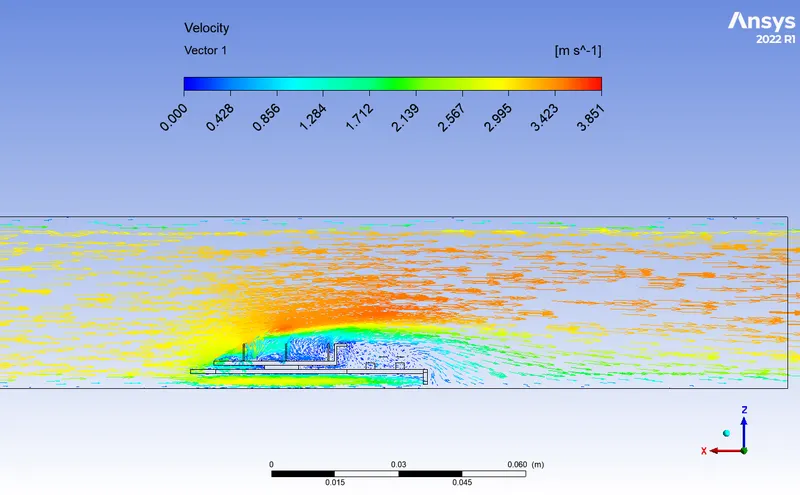
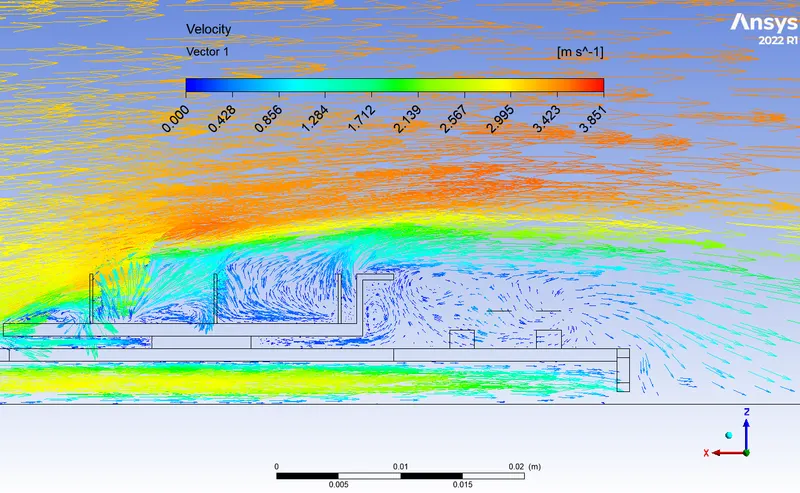
- Here we can observe the eddies forming in the areas were there is sudden change in the geometry causing sudden increase in cross-sectional area, this may be helpful to some extent as the flow circulates it comes in contact with the surfaces which cannot be reached by the direct flow so here it enhances the heat transfer.
- Residuals:
- Case-3:
- Residuals:
- Report plots:
- Temperature contours:
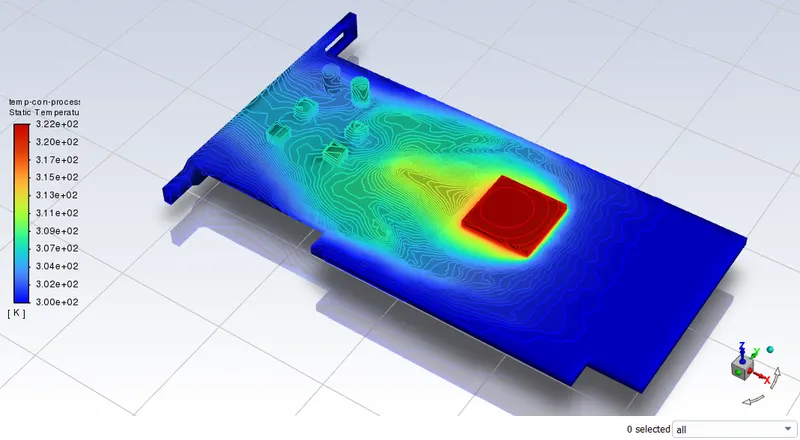
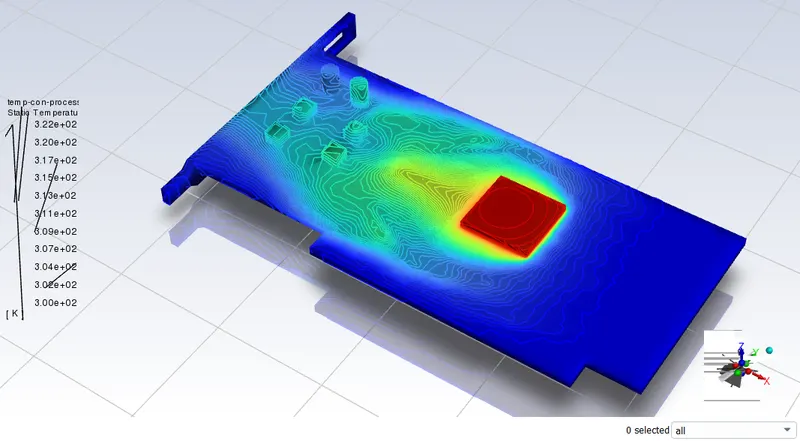
- The above contour represents the variation of temperature across the crossection of the geometry.
- As we can see the as the processor is heat generation source the fin is used for the dessipation of heat due to the higher thermal conductivity of the aluminum and then this heat is picked from the fins by air which has comparitively low heat transfer co-efficient than the aluminum material due to which we can see the Fins having more temperature as it absorbs more heat than air which appears in the above contours also.
- And there are swirls forming which will help in the heat dessipation but less than other flow region as the flow rate is less due obstructions.
- Velocity contours and vectors:
- The above figure represents the velocity of flow across the geometry at the plane, as we can see the no slip conditions at the boundariesand the velocity has increased near the area of graphics card reason being the crossectional area reduction due to the presence of the graphics card as compared to the inlet and the outlet.
- There are swirls forming at the sharp edges, sudden constriction and expansion in the geometry of the graphics card.
- Here it can seen that the eddies are more developed compared to the previous case were the velocity was comparetively less.
- Residuals:
- Table contents:
-
Cases Velocity (m/s) Converged Temprerature (k) (Volume-max) Velocity (m/s) (max) Pressure differnce (Pa) Processor Fins PCB Fluid (Air) 1 1 81 360.87960 360.80759 358.93783 360.52417 1.3681349 0.342 2 3 116 329.71068 329.63790 328.36331 329.40928 4.4367643 1.9262452 3 5 162 321.74685 321.67317 320.64928 321.46073 7.3490450 4.5907051 -
Cases Velocity (m/s) Surface Heat Transfer co-efficcient (`W/(m^2k)`) Processor Fins PCB Fluid (Air) 1 1 687.07951 1288.9472 24.341282 176.80567 2 3 1200.6028 2248.0338 32.420759 204.2841 3 5 1483.7315 2771.3498 34.598493 210.6093 - Grid Independency:
-
Case Velocity (m/s) iter to con Baseline Fins Processor Mesh count Temp vi max (k) Temp si avg (k) 1 5 384 8 mm 0.8 mm 20 203209 322.26682 322.04072 2 5 369 6 mm 0.6 mm 20 281271 321.64564 321.42498 3 5 358 5 mm 0.5 mm 20 369911 321.6151 321.39542
-
- Variation of temperature and surface heat transfer co-efficient with fluid velocity.
- Temperature vs Fluid velocity.
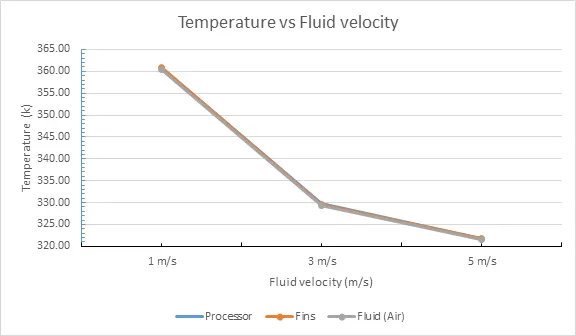
- It can be clearly seen that the temperature of the components decreases as the fluid velocity increases.
- Surface heat transfer co-efficient vs Fluid velocity.
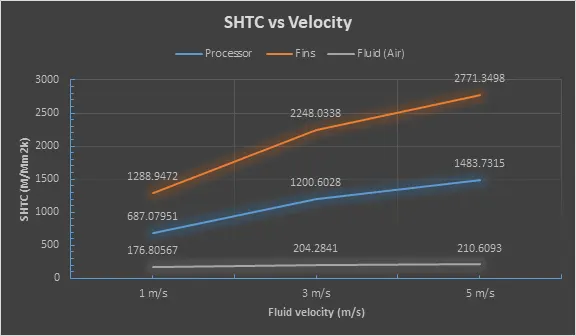
- The surface heat transfer co-efficient increases as the velocity of the fluid increases, this is due to the increase mass flow rate which results in more heat energy requried to raise the temperature of the unit crossection area of fluid passing the area.
- Temperature vs Fluid velocity.
Conclusions:
- The simulation is run successfully for the given geometry.
- The geometry is cleaned and mesh appropriatly as for the given study.
- The study is run for 3 cases by varying the velocity of the fluid at the inlet from 1m/s to 5m/s.
- The mesh independency test is run for three number of cases and the grid independency is confirmed.
- The mesh is refined near the processor and the fin area (incluing the parts near to them) as we are more concerned about the changes and the process taking place.
- The indepency is achieved wit one digit after the decimal.
- From the study is clear that as the velocity of the fluid increases the components temperature decreases, this is attributed to the high mass flow rate which carries away more heat from the components compared to lower flow rate of the fluids (i.e. low velocity).
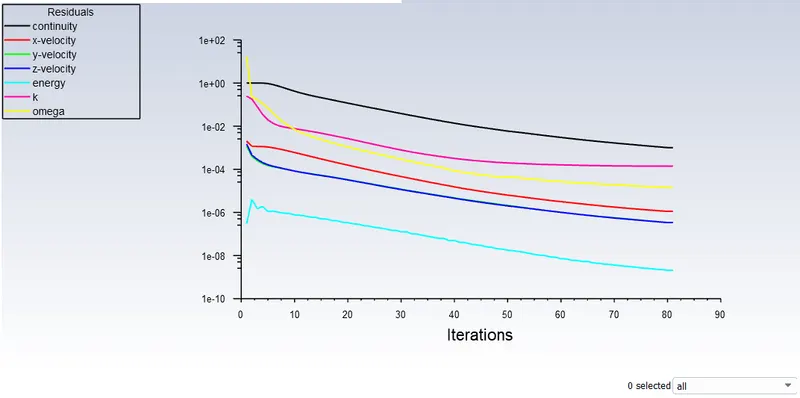
- The convergence is checked using the temperature of the interior fin and processor along the iterations and also the residuals are kept under observation but it can also be done using other parameters like surface heat tranfer coefficient etc.
- The hot spots on the graphics card are:
- Processor.
- It is the heat source so this part will heat up comparitively high to the other components.
- Fins.
- This component is used to conduct the heat from the processor and due to it's direct fine contact at the processor the heat transfers more compared to other.
- Area close to to processor in the direction of the fluid flow.
- When the fluid flow it carrires heat from the components and this fluid comes in contact with the components in the flow direction and the heat is transfered to them cause the areas of high temperature.
- PCB area the processor.
- As this part of the PCB is in contact with the processor it conducts the heat from the processor to te PCB, even though the thermal conductivity is low for the PCB material it gets heated as temperature of the processor is very high at the contact.
- Fluid in contact with fins and processors.
- Even thought the specific heat of the fluids is less compared to the metals used for the fins, the fluid in contact with the fins and processor gets heated up and heat up the component in the direction of the flow.
- Processor.