Project 1 - Parsing NASA thermodynamic data
Aim:
- Write a program to extract the 14 co-efficients and solve the polynomials and use them to the thermodynamic properties such as Specific heat, Entropy and Enthalpy for all the species of molecules given.
- Save the graphs of thermodynamic properties against local temperature in seperate folder named as the species.
Governing equations:
- `Cp = (R .* (a1 + (a2*T) + (a3 * ((T).^2)) + (a4 * ((T).^3)) + (a5 * ((T).^4))))`
- `S1 = R .* ((a1*(log(T))) + (a2 * T) + ((a3 * (T).^2)/2) + ((a4 * (T).^3)/3) + ((a5 * (T).^4)/4) + a7)`
- `H1 = ((R.*T) .* ((a1) + ((a2* (T))./2) + ((a3* (T).^2)./3) + ((a4* (T).^3)./4) + ((a5* (T).^4)./5) + (a6./((T)))))`
Objective of the project:
- Opening and reading the THERMO.dat file.
- Extracting the 14 co-efficients.
- Extracting the local temperatures and making as the array with 1000 divisions.
- Calculating the thermodynamic parameters (i.e. specific heat, entropy, enthalpy) for each species over the local temperature range.
- Calculating the molecular wieght of the given species.
- Ploting the specific heat, entropy and enthalpy against the local temperature.
- Saving them in a direcory with species as the name of the folder.
- Closing the THERMO.dat file.
Body of the content:
- Software used - MATLAB (all the temperatures are in kelvin).
- Language - C/C++
-
clear all close all clc P1 = fopen('THERMO.dat', 'r') % Openig the THERMO.dat file in the read only mode for i = 1:5 % extracting the global temp values and skipping the 5 lines if i == 2 h = fgetl(P1) A = strsplit(h, ' ') global_low_temp = str2num(A{2}) % Extracting the global temp values global_mid_temp = str2num(A{3}) global_high_temp = str2num(A{4}) else fgetl(P1) end end elements = [ 'C' 'H' 'O' 'A' 'N']; % defining the elements present atomic_weight = [ 12.01 1.00784 15.999 39.948 14.0067]; % defining the atomic weight of the respective elements count =0; % keeping the count of the species to tabulate prompt = input('Input the species name: ', 's') % inputspecies = (input(prompt)) for i = 1:53 % i to the length of the doc or exhaust the if condition s = fgetl(P1) % get the first row containing the species name and the local temp values S = strsplit(s, ' ') % spliting the str Species = S{1} % taking the species as a str from null by {} local_low_temp = str2num(S{end-3}) local_mid_temp = str2num(S{end-1}) local_high_temp = str2num(S{end-2}) if strcmpi(prompt, Species) R =8.3145; % Univeral gas constant T = linspace(local_low_temp, local_high_temp, 1000) % as a vector array with 1000 divisions from local low temp to local high temp a = fgetl(P1) % first five coefficients A = findstr(a, 'E' ) % Taking the reference index values for extraction use a1 = str2num(a((1:A(1)+3))) % extracting the coefficients by the indexes of the E in A a2 = str2num(a((A(1)+4:A(2)+3))) a3 = str2num(a((A(2)+4:A(3)+3))) a4 = str2num(a((A(3)+4:A(4)+3))) a5 = str2num(a((A(4)+4:A(5)+3))) a = fgetl(P1) A = findstr(a, 'E' ) a6 = str2num(a((1:A(1)+3))) a7 = str2num(a((A(1)+4:A(2)+3))) a8 = str2num(a((A(2)+4:A(3)+3))) a9 = str2num(a((A(3)+4:A(4)+3))) a10 = str2num(a((A(4)+4:A(5)+3))) a = fgetl(P1) A = findstr(a, 'E' ) a11 = str2num(a((1:A(1)+3))) a12 = str2num(a((A(1)+4:A(2)+3))) a13 = str2num(a((A(2)+4:A(3)+3))) a14 = str2num(a((A(3)+4:A(4)+3))) Cp = specific_heat(a1,a2,a3,a4,a5,a8,a9,a10,a11,a12,R,T,local_mid_temp); % calling the functions S1 = entropy(a1,a2,a3,a4,a5,a7,a8,a9,a10,a11,a12,a14,R,T,local_mid_temp); H1 = enthalpy1(a1,a2,a3,a4,a5,a6,a8,a9,a10,a11,a12,a13,R,T,local_mid_temp); mw = 0 ; % for calculating and displaying the molecular weight of each species for i = 1:length(Species) % to run till length of the species for j = 1: length(elements) % to run till length of the elements array to check if strcmp(Species(i),elements(j)) % strcmp compares the individual indexed component with the atoms in the elements array in a sequance mw = mw + atomic_weight(j); pre = j ; else n = str2double(Species(i)); % if its a char, output is null and if its a numeric in a str then its converted to num if n>1 mw = mw+(atomic_weight(pre)*(n-1)) % for the species containing multiple atoms break end end end end molecular_weight = mw % assaigning to a variable called molecular weight count = count +1 % to represent the sl.no cd('C:\Users\SAQIB SHAIK\Desktop\NASA9') % changing the present working directory mkdir(Species); % Making new directory by name of species cd(Species); % Making the species named directory as current directory figure(1) % Plotting the specific heat values with respect to the local temperature plot(T,Cp,'linewidth',2,'color','r') xlabel('Temp') ylabel('Specific heat (kJ/kg K)') grid on title(sprintf('Specific Heat for %s (%f)', Species, molecular_weight )) saveas(figure(1), 'Specific Heat.png'); figure(2) plot(T,S1, 'linewidth',2,'color','g') xlabel('Temp') ylabel('Entropy (J/K)') grid on title(sprintf('Entropy for %s (%f)', Species, molecular_weight)) saveas(figure(2), 'Entropy.png'); figure(3) plot(T,H1,'linewidth',2,'color','b') xlabel('Temp') ylabel('Enthalpy (J)') grid on title(sprintf('Enthalpy for %s (%f)', Species, molecular_weight)) saveas(figure(3), 'Enthalpy.png') cd('C:\Users\SAQIB SHAIK\Desktop\HYBRID VEHICLES\MATLAB') % Changing the current working directory from saving directory to the main program direcory else fgetl(P1); fgetl(P1); fgetl(P1); end end fclose(P1); - clearing and closing all the previously stored values/garbage values by using clear all,close all and clc command
- Opening the THERMO.dat file in read mode by fopenf comand with 'r' as to read only mode.
- Extracting the Global temperatures for documentation by using 'for loop' with 5 iterations.
- The elements present in the species and there atomic weight is defined in the form of the array.
- Count varaible is defined to keep track of the species and sl.no.
- Now by using a 'for loop' and looping it for 53 times so to scan all the species data.
- Now the first line of the data containing the species name and the local temperatures are read by fgetl command.
- Its split by using 'space' as a delimiter resulting in a null data type.
- Now the data like species name(stored in a variable 'Species') and local termperature values(converted num) are read.
- An array is formed 'T' by using linspace command with 1000 values starting from local low temperature to local high temperature.
- The next line read and stored in the variable 'a' and by using 'findstr' command the indexes of the 'E' is found.
- By using the indexes one by one the co-efficients can be found by repeating the above two steps twice again.
- Now the pre-defined functions are called to calculate Specific heat(Cp), Entropy(S1), Enthalpy(H1) for the current species for all local temperaure values.
- Then molecular wieght is calculated as:
- A varaible is defined 'mw' with initial value set to 0.
- Then by using the 'for loop' for the length of the species.
- Every indexed character is checked with the elements array by using a 'for loop'.
- If the indexed character matches with the elements array.
- Then variable 'mw' is added with the corresponding indexed value in the atomic weight array.
- Position of the second 'for loop' is assigned to variable 'pos' used in the further steps.
- Else it is checked with str2double command for the numeric in the species.
- If the output is null it means its a str
- Else the 'mw' is multiplied with the (n-1) times the pos index atomic weight.
- loop continous and stores the 'mw' value in variable 'molecular weight'.
- Plotting:
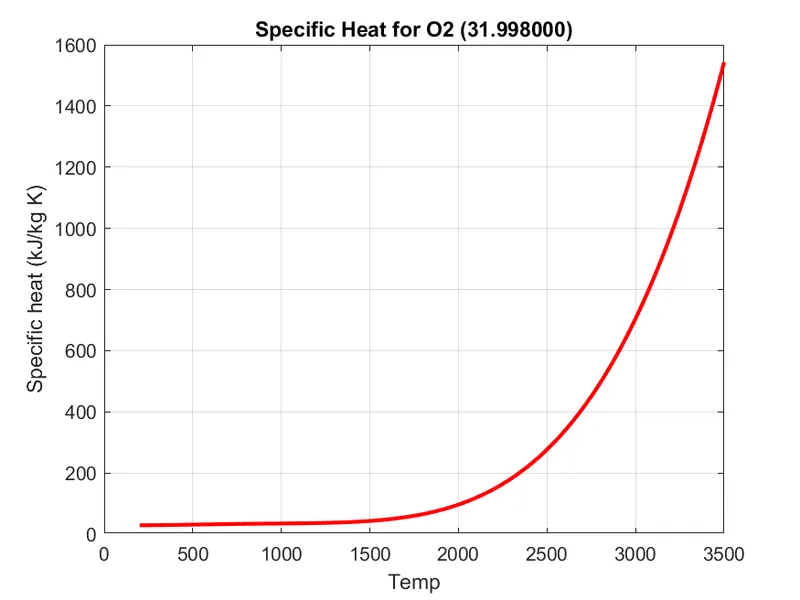
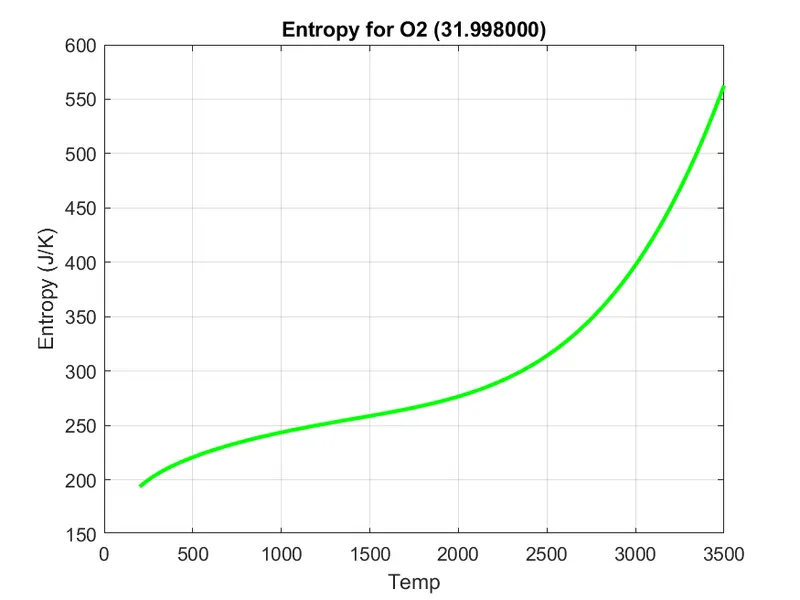
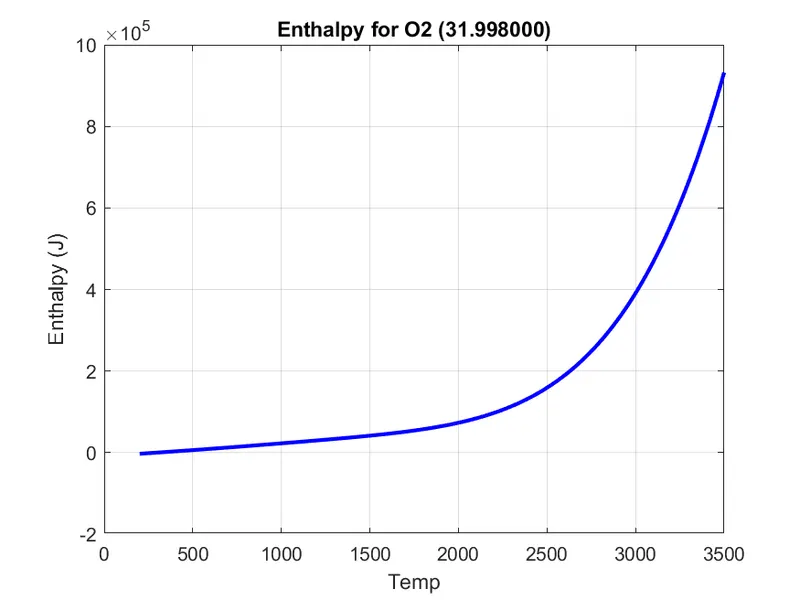
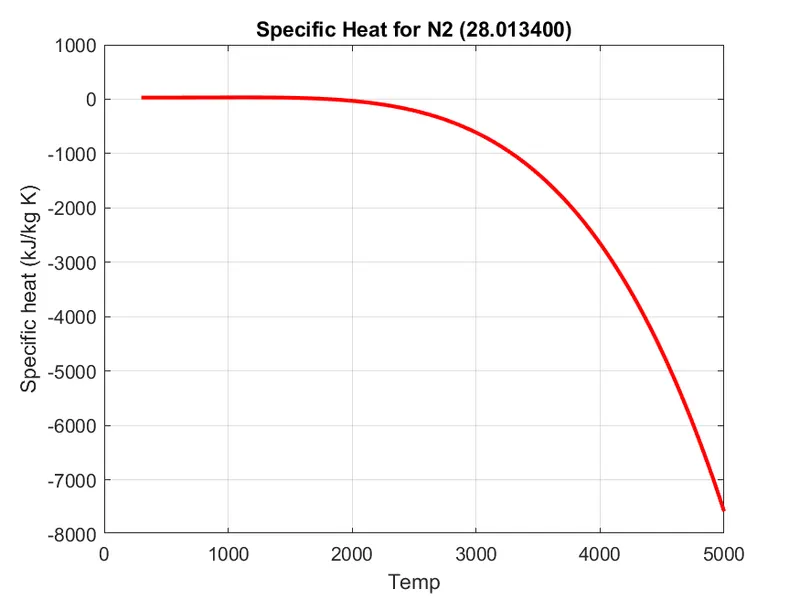
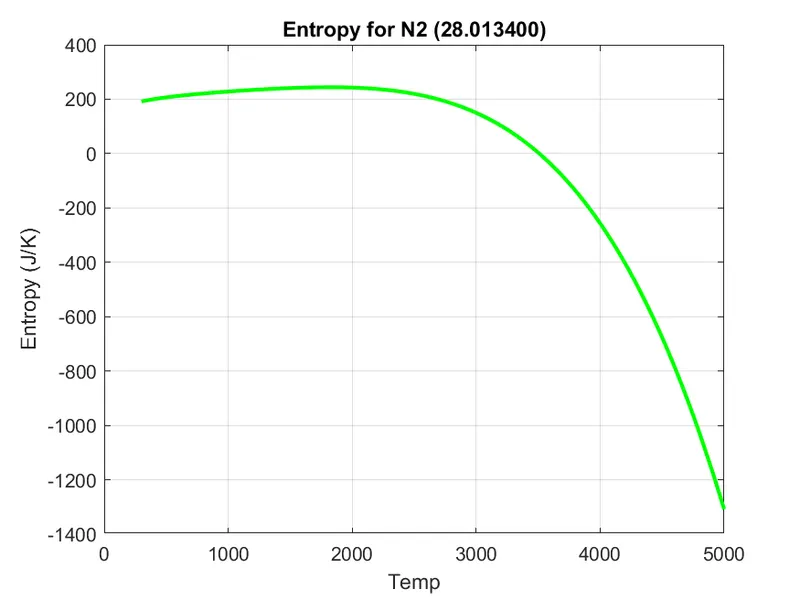
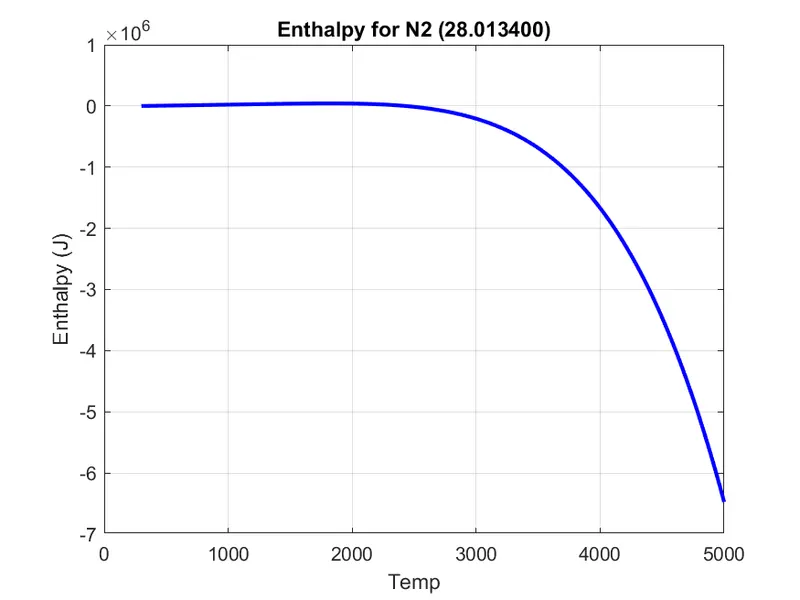
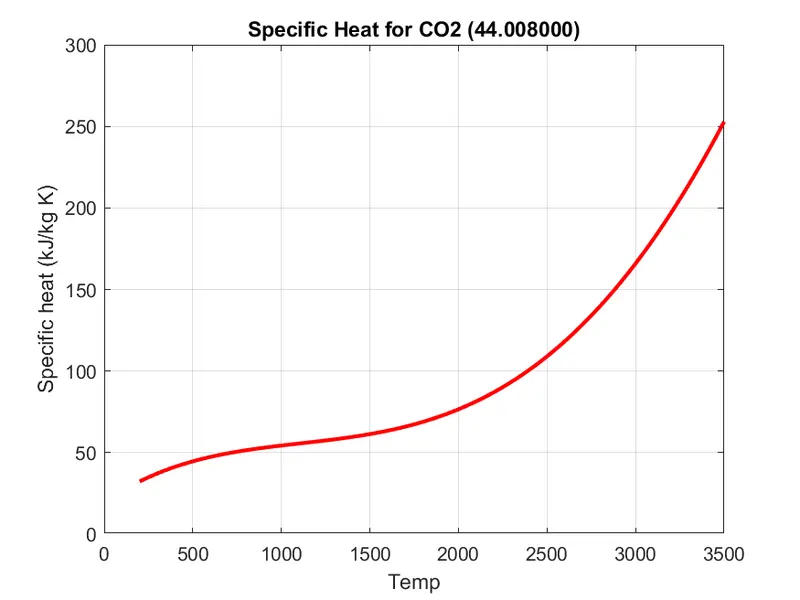
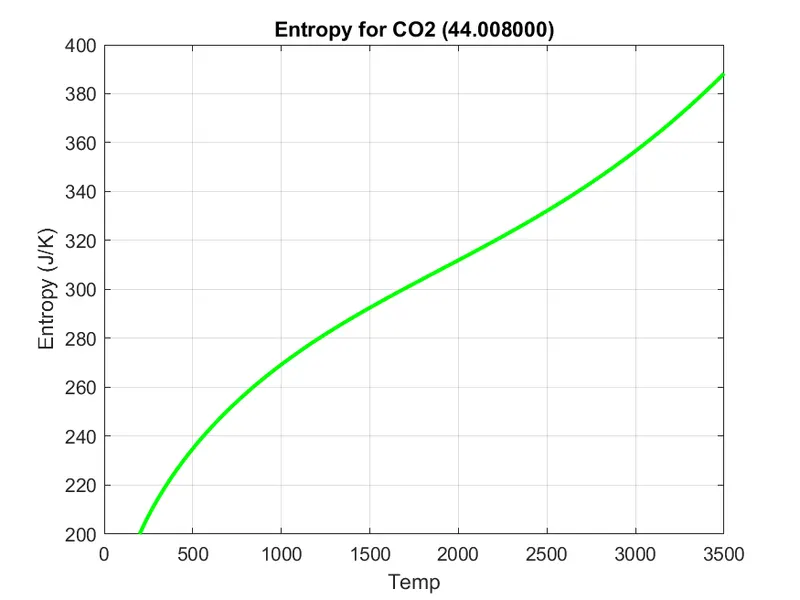
- Here the Cp,S1,H1 are plotted against the local temperature array for each species given.
- Now the new directory is created here 'NASA9'.
- The current directory is changed to the following reported directory by using 'cd' command.
- New directories/folders are made with the corrsponding species name. (result shown below)
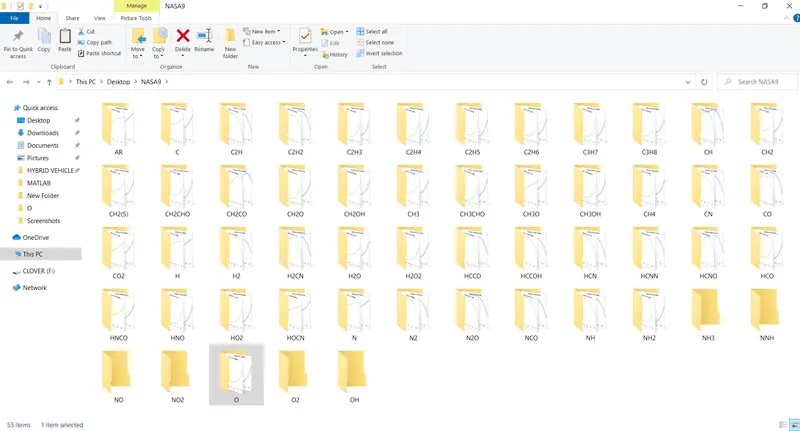
- The graphs are saved in the respective directories with the respective thermodynamic parameters by using the 'saveas' command.
- The current dirctory is changed to the previous main directory to complete the second main 'for loop'.
- The file THERMO.dat is closed by using 'fclose' command.
- The specific heat function works as follows:
-
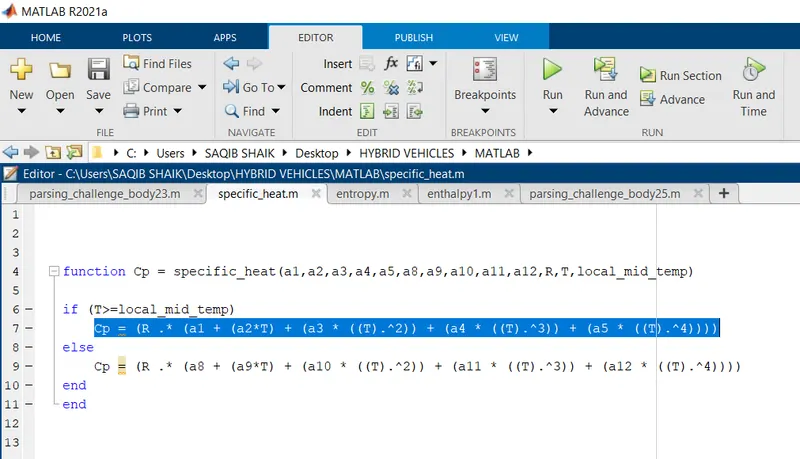
- If the temperature is more than the local_mid_temperature the first five co-efficients are used to calculate the specific heat .
- Else if the temperature is less than the local_mid_temperature the next half side five co-efficients are used for the calculation.
-
- The entropy function works as:
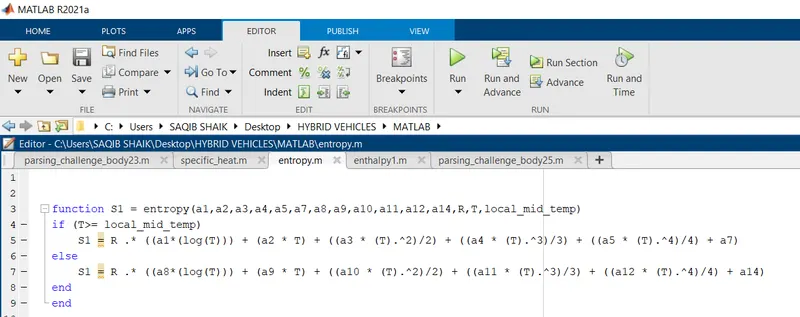
- If the temperature is more than the local_mid_temperature the first seven co-efficients are used to calculate the entropy.
- Else if the temperature is less than the local_mid_temperature the next seven co-efficients are used for the calculation.
- The enthalpy function works as:
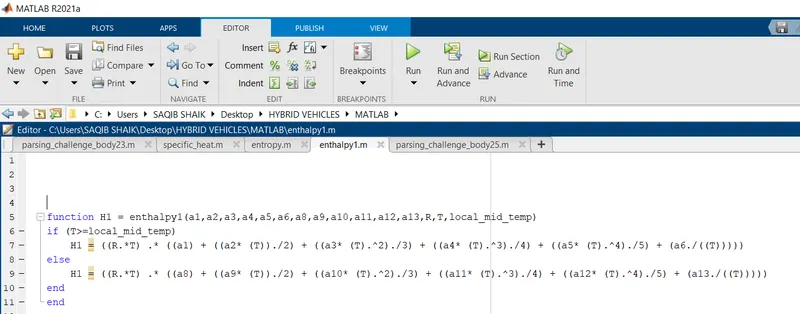
- If the temperature is more than the local_mid_temperature the first six co-efficients are used to calculate the enthalpy.
- Else if the temperature is less than the local_mid_temperature the respective next six co-efficients are used for the calculation.
Results:
- Output for oxygen molecule. (all the temperatures are in kelvin)
2. Properties of nitrogen molecule.
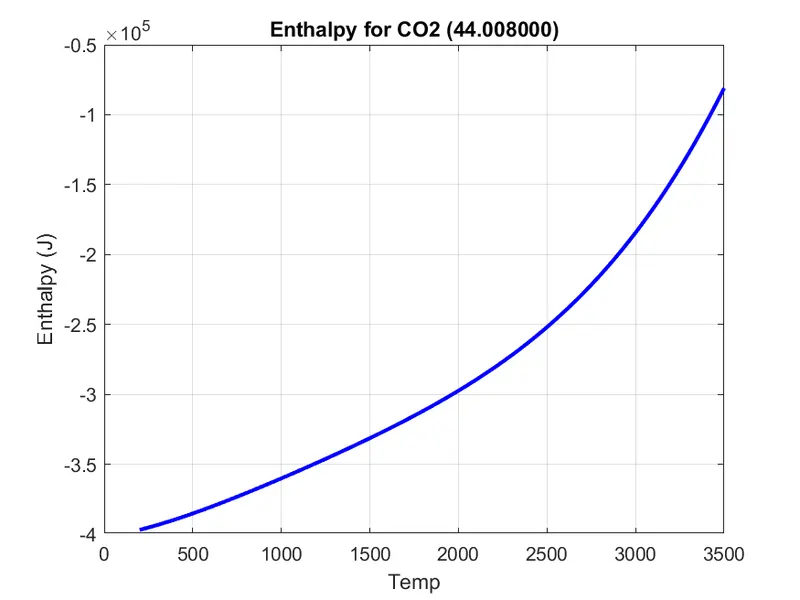
3. Properties of carbon-di-oxide.
4. Folders with specific species name:
Conclusion:
- Successfully retrived the data from the file THERMO.dat and was able to calculate the molecular wieght, specific heat, entropy and enthalpy for all species and also there behavoiur with the temperature was studied by plotting the thermodynamic parameters with the temperature.
- The data of all the species was saved in a seperate folders for further future study.