Week 6 - CHT Analysis on a Graphics card
Aim: Perform a steady-state conjugate heat transfer analysis on a model of a graphics card. Run the simulation by varying the velocity from 1m/sec to 5m/sec for at least 3 velocities and discuss the results And Run the simulation for best possible mesh with combination of coarse and refined mesh in different regions.
Theory: The graphic card is used in many application like in computer, Mobiles, Television etc., During runtime processor in graphic card exhibits the heat,This causes the graphic card materials damage to avoid this effect we simulate the air flow over the graphic card which cools the graphic card, So This case study we called as heat transfer analysis the heat transfer study interference between fluid(air) and solid material (silicon material of processor) is called conjugate heat transfer analysis. SO for this first we calculate the heat generation of graphic card by dividing the amount energy dissipated by graphic card to the total volume So this value is giving as source term to the processor material of graphic card, Then flowing the air with some velocity over the surface of graphic card and checking at what velocity of air flow the graphic card is cooling
Procedure to run the simulation:
- Open the Ansys workbench and drag drop flow fluent solver in the project schematic and open the new space claim sketch window from the geometry option, Import the graphic card model on it
- Then do share topology using share topology option, After share topology the final model is shown in image1
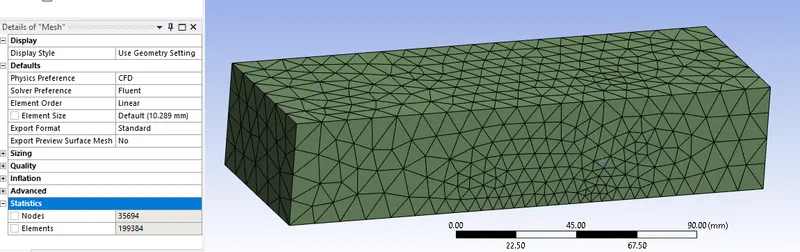
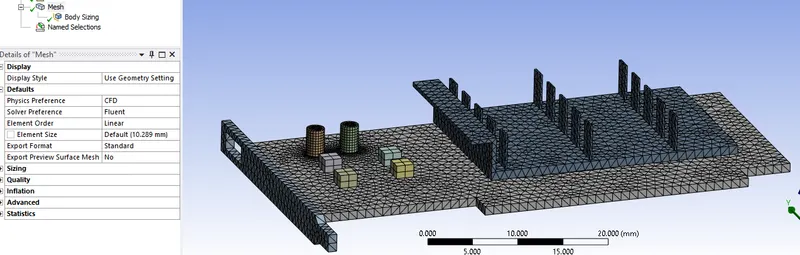
- Next close the geometry window and open the mesh window, Then generate mesh by giving the target length for the enclosure and sizing to the graphic card, This meshed is shown in image2
- Then close the mesh window and open setup window, There in physics we enabling the energy equation, selecting the k-epsilon viscous model and selecting the three solid material for three different component and one fluid material that is fluid makes to flow over graphic card this selection option is shown in image3
- The graphic card include three component fin, processor, PCB So for this component material selection is giving in cell zone condition how we select it shown in image4
- The heat generation value is assigning to the processor how we assign is shown in image5
- After giving the cell zone conditions then giving the boundary condition and intializes the simulation after giving the initialization then we take out the surface report of surface heat transfer coefficient at the processor how we taking the surface report is shown in image6
- Then we run the simulation for 300 iteration but the simulation is converged at some below iteration
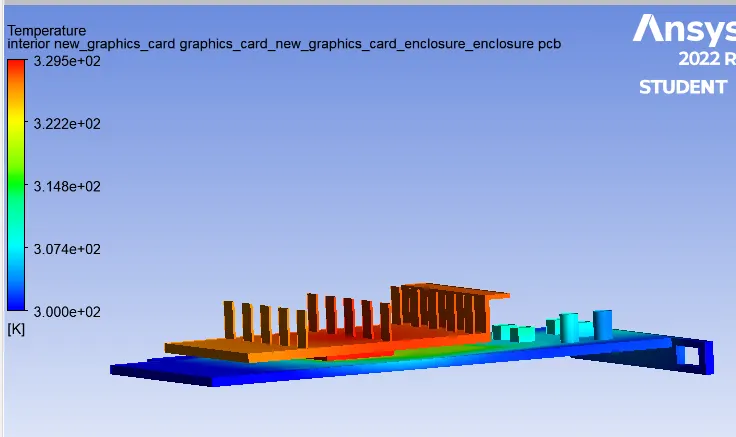
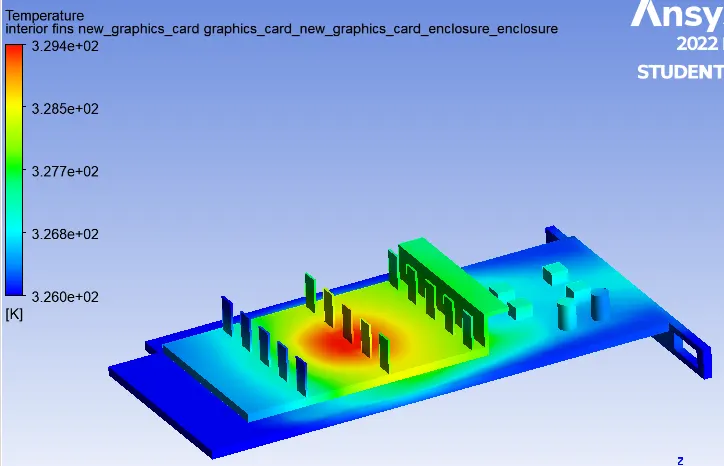
- So lastly we take out the result of the simulation this results is attached in image7, image8, image9.
- Like this we run the simulation for different cases like changing the velocity in boundary condition and mesh size.
- 1m/s, 3m/s, 5m/s for fined mesh and velocity of 1m/s, 3m/s for coarse mesh size are the cases to run the simulation
Image of final model :
Image1: Cut section view
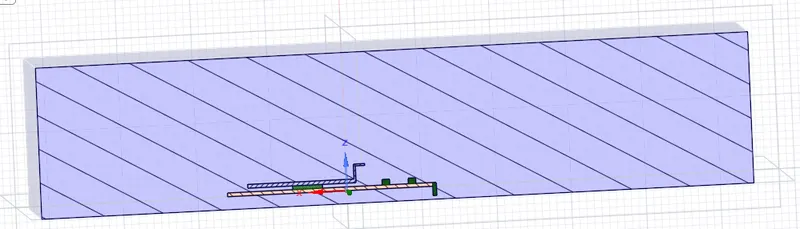
Image of meshed model
Image2
coarse mesh model image : 10.289mm target mesh to outer enclosure and 1mm target mesh to the graphic card
Fined meshed model image : 8.5mmmm target mesh to outer enclosure and 0.6mm target mesh to the graphic card
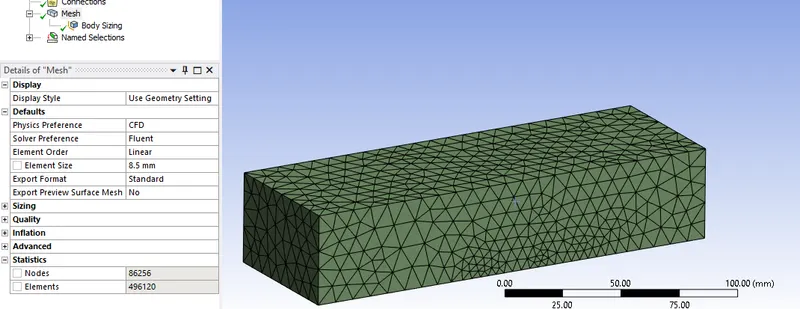
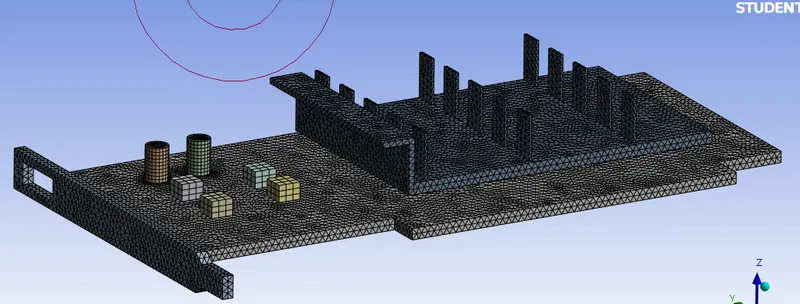
Image of setup the material selection, giving cell zone condition and taking out the surface report plot
Image3: material selection
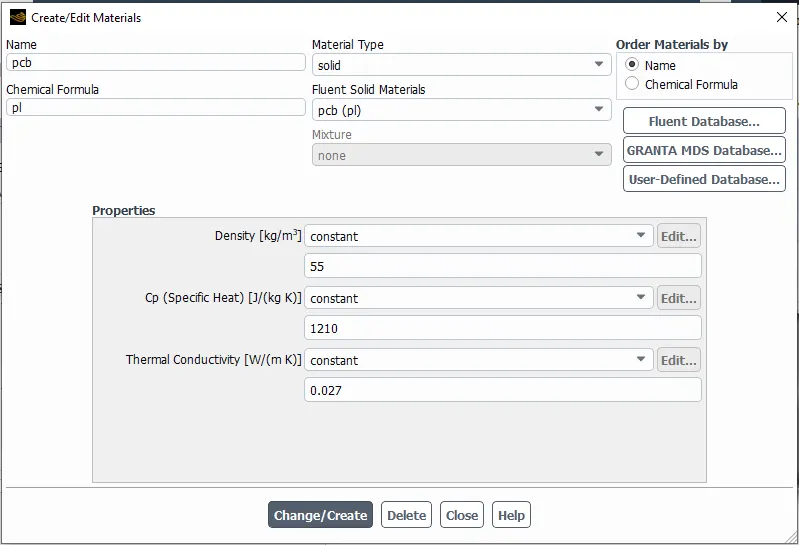
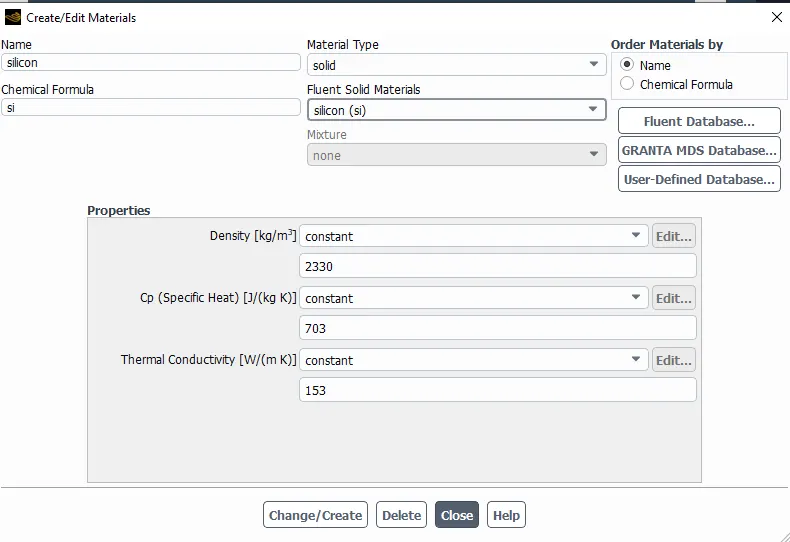
image4:giving cellzone condition
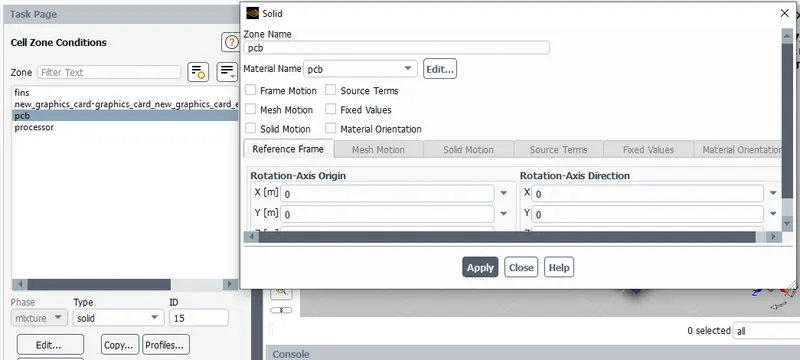
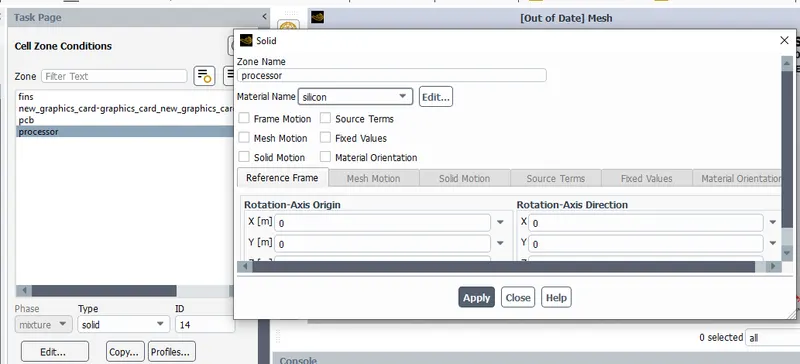
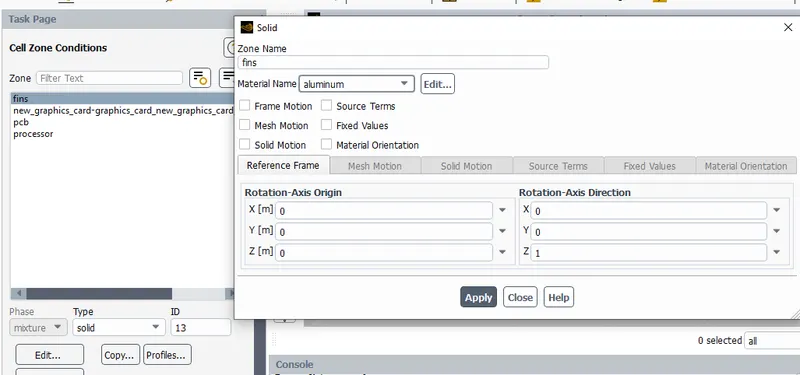
image5- giving heat generation value to the processor
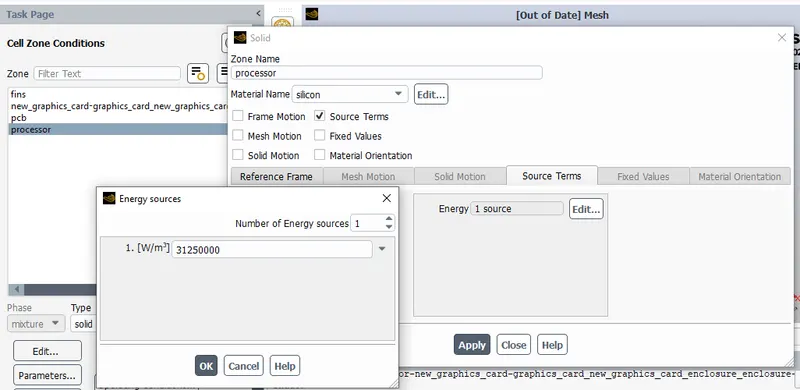
image6- Taking surface report plot of surface heat transfer coefficient
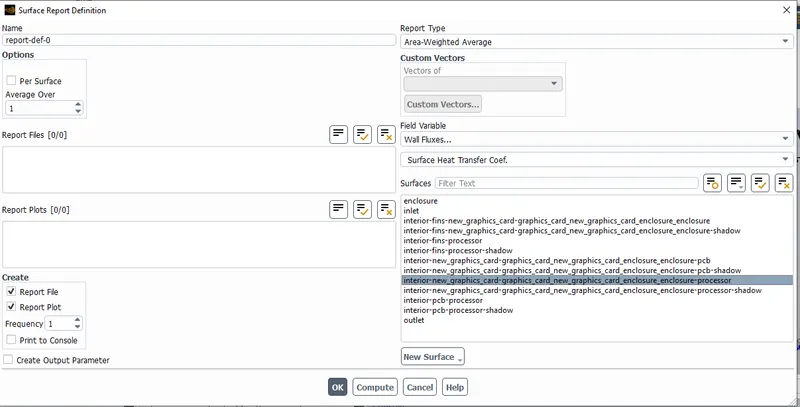
Image for the result for different cases
- Coarse mesh : 10.289mm target mesh to outer enclosure and 1mm target mesh to the graphic card
- For velocity 1m/s:
Image7 : Scaled residual plot and surface heat transfer coeeficient at processor plot
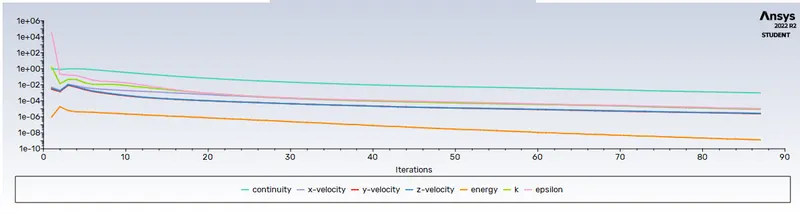
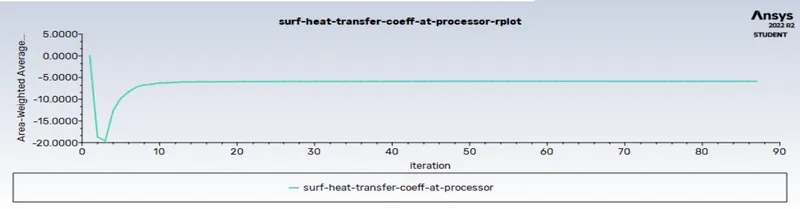
Image8 : Results at console


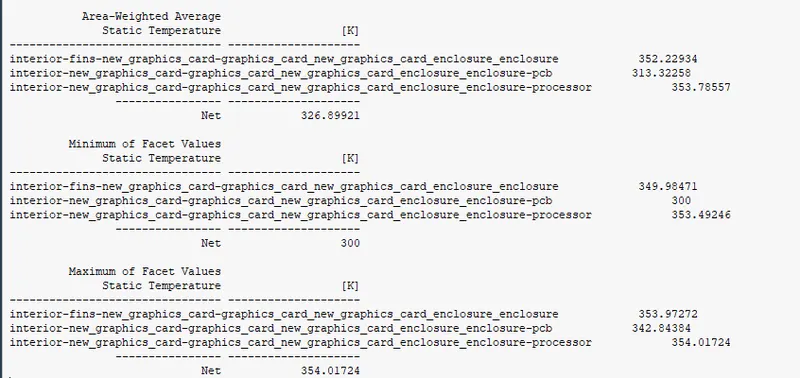
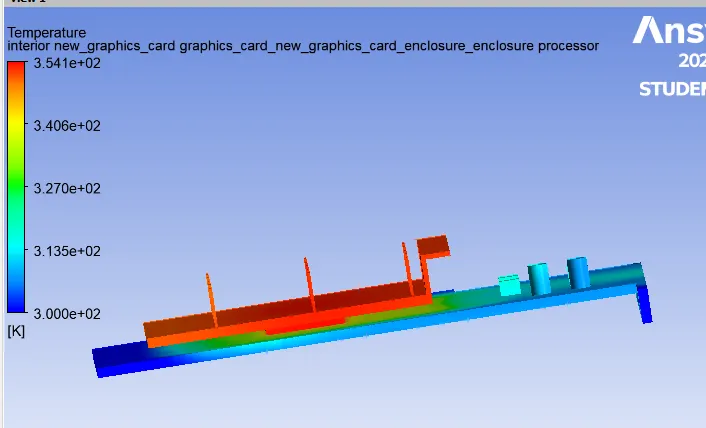
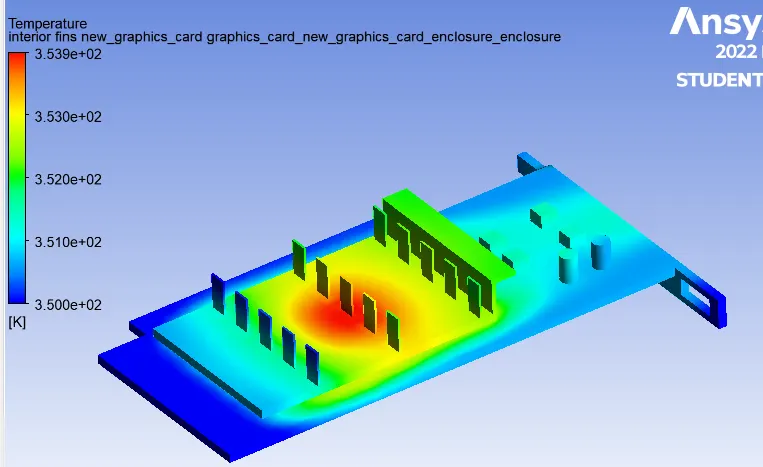
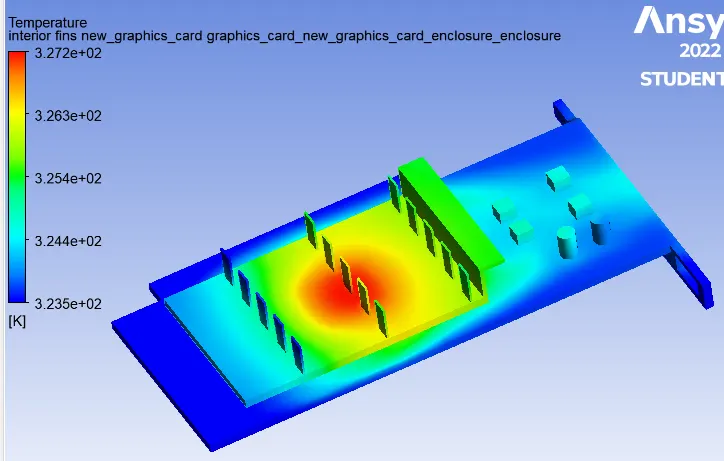
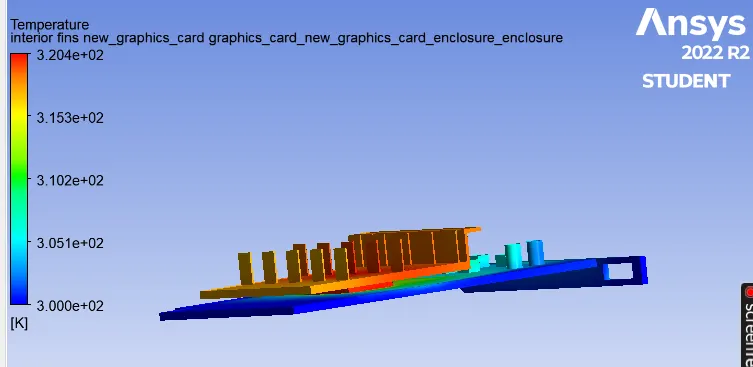
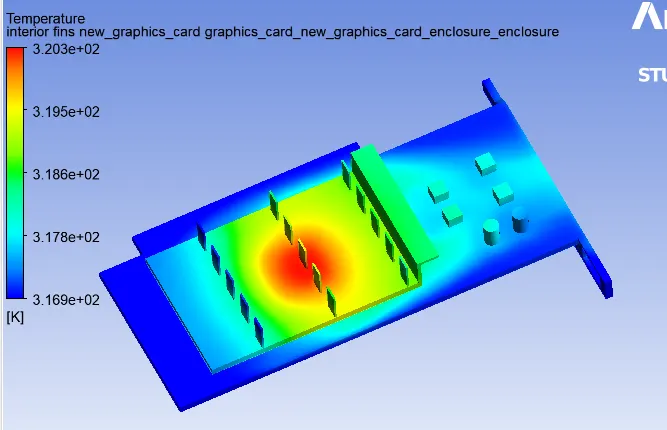
Image8 : countour plot for surface temperature of graphic card and hotspot contour plot of graphic card
- For velocity 3m/s:
Image7 : Scaled residual plot and surface heat transfer coeeficient at processor plot
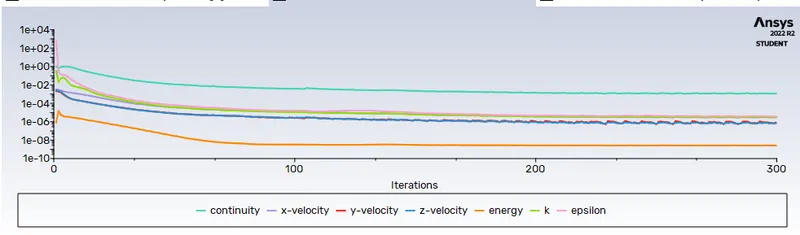
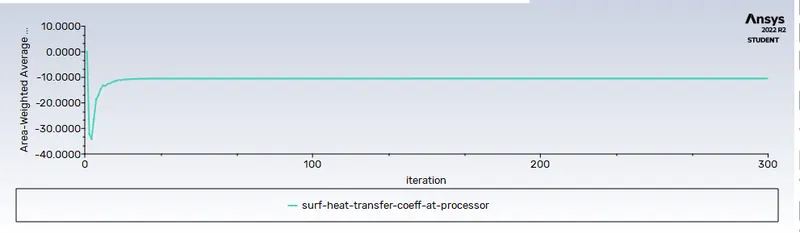
Image8 : Results at console

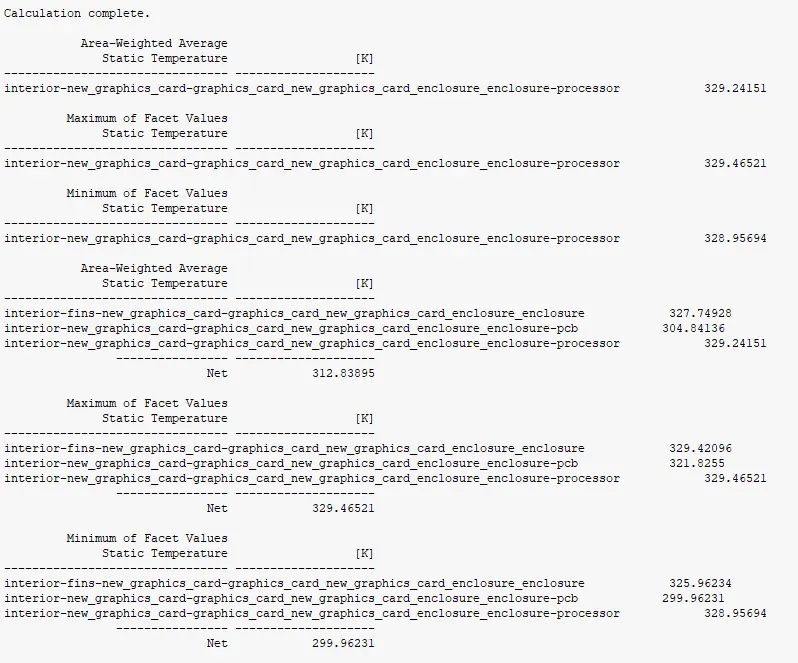
Image8 : countour plot for surface temperature of graphic card and hotspot contour plot of graphic card
2. Fine mesh : 10.289mm target mesh to outer enclosure and 1mm target mesh to the graphic card
- For velocity 1m/s:
Image7 : Scaled residual plot and surface heat transfer coeeficient at processor plot
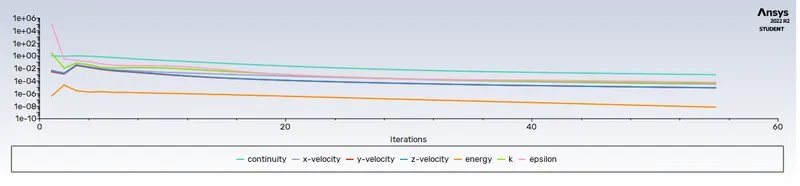
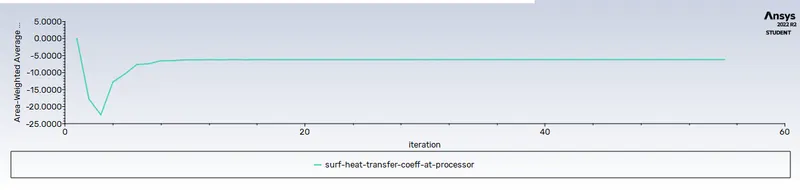
Image8 : Results at console

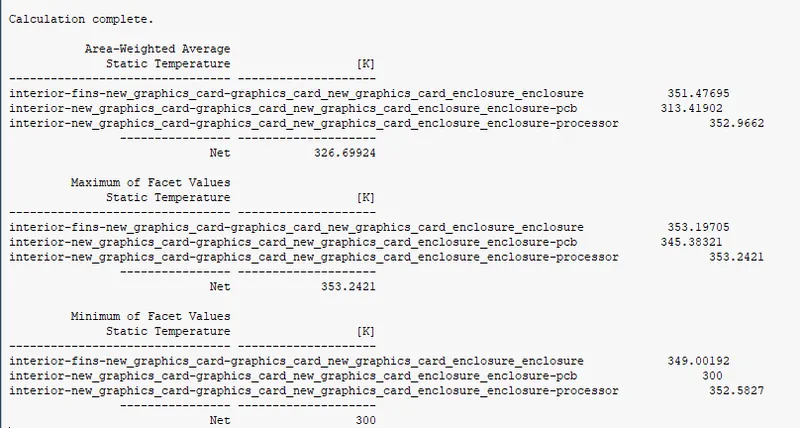
Image8 : countour plot for surface temperature of graphic card and hotspot contour plot of graphic card
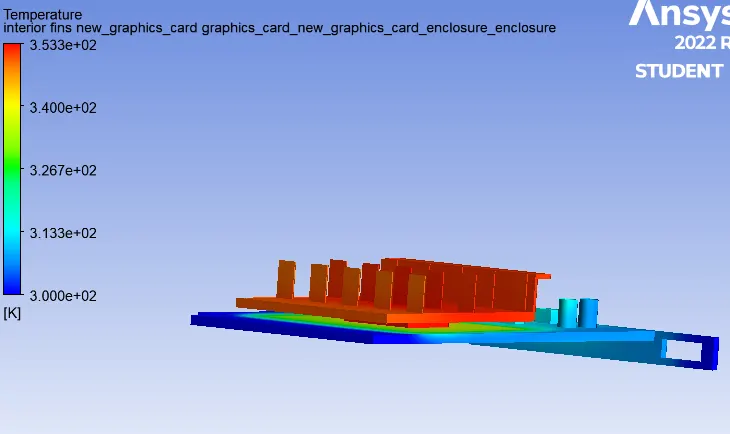
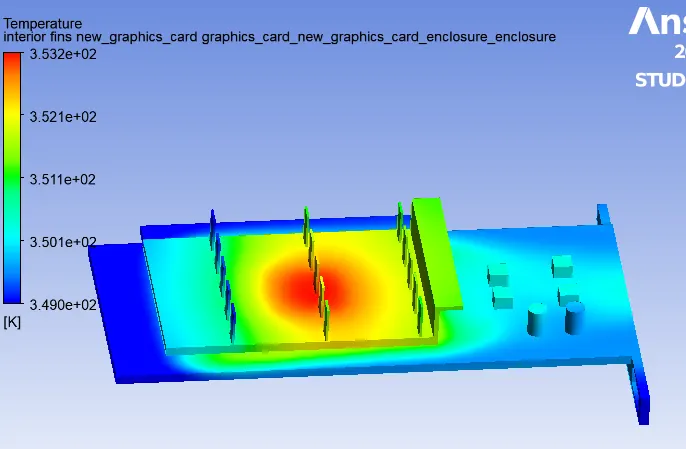
- For velocity 3m/s:
Image7 : Scaled residual plot and surface heat transfer coeeficient at processor plot
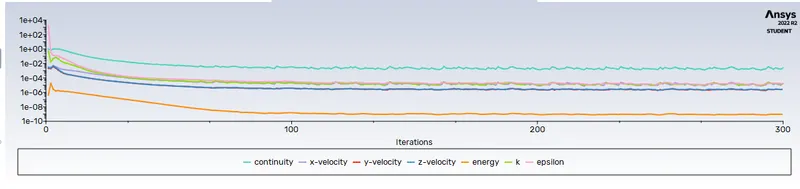
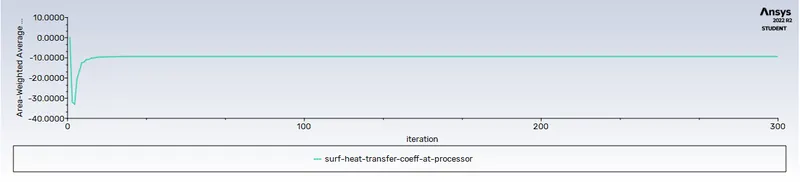
Image8 : Results at console
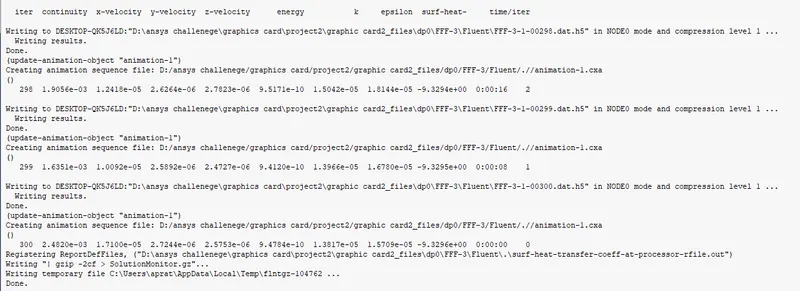
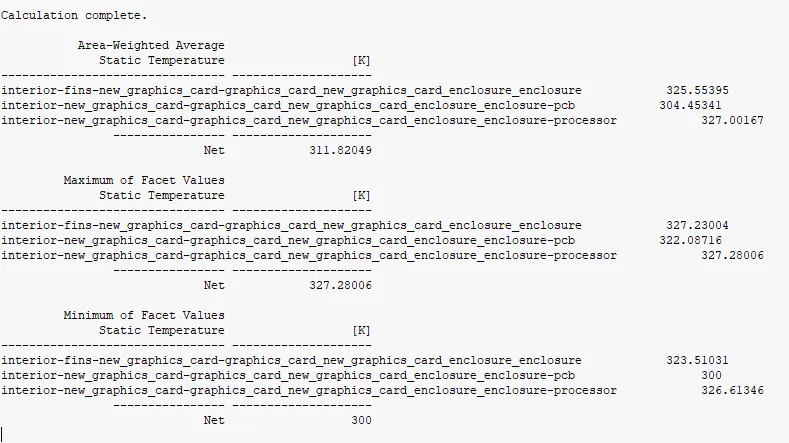
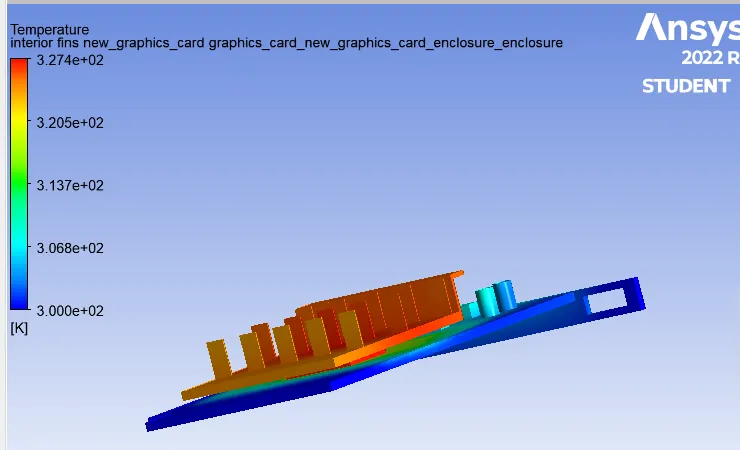
Image8 : countour plot for surface temperature of graphic card and hotspot contour plot of graphic card
- For velocity 5m/s:
Image7 : Scaled residual plot and surface heat transfer coeeficient at processor plot
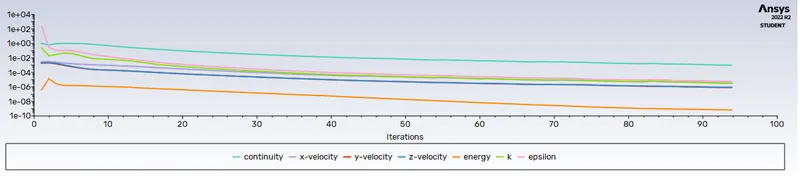
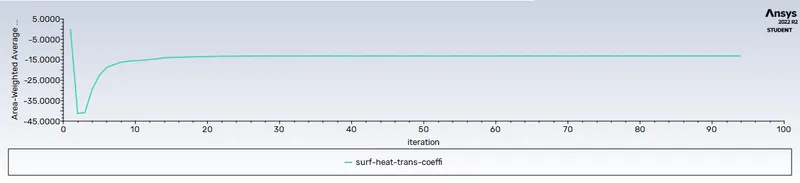
Image8 : Results at console

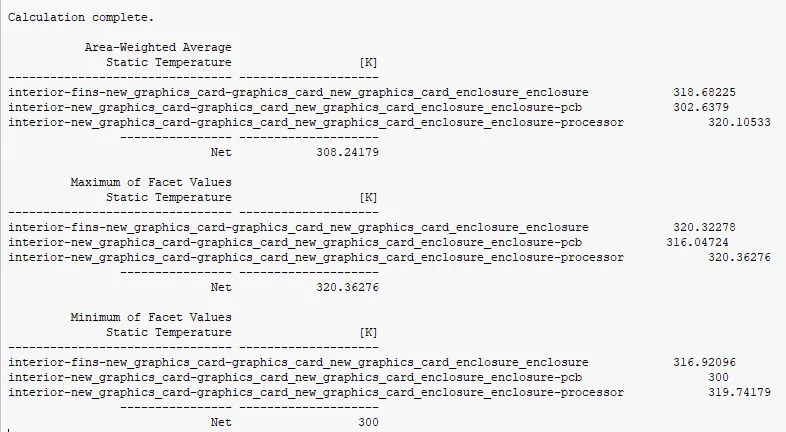
Image8 : countour plot for surface temperature of graphic card and hotspot contour plot of graphic card
Final definition :
- By validating the above result fine mesh gives accurate result than coarse mesh
- The higher velocity that is 5m/s gives better cooling to the graphic card
- The potential hotspot is identified and shown in the image8
Conclusion : By the above procedure Conjugate heat transfer analysis of graphic card simulation successfully completed