Week 6 - CHT Analysis on a Graphics card
PROJECT REPORT
AIM:
- To perform the steady state CHT simulation on a graphics card model
- To check the various difference occurs as we change the velocity of incoming air
INTRODUCTION:
In conjugated heat transfer analysis, there are multiple modes of heat transfer taking place simultaneously, like conduction and convection. There are many applications of such kind of simulation so it’s important to study such problems in detail.
CHT provides a detail analysis and predictions of temperature and hot spots so it cn help in designing the graphics card properly, if any sensitive component is placed in the hot spot region it can cause effect on the performance of the graphics card
PROBLEM STATEMENT:
- Simulate CHT analysis on a model of graphics card using proper material
- Simulate by varying the velocity from 1m/s to 5m/s, 3 cases
- Find out the max temperature and heat transfer coefficient attained by the processor
GEOMETRY:
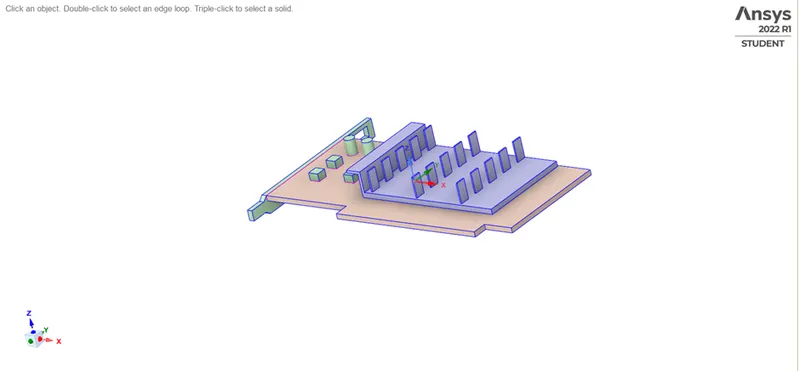
Processor is located below the fins and the heat is generated into the processor. All other parts are named under base
Heat generation calculation:
Dim. Of processor used – 8 x 8 x 1 mm
Assuming it consume 150W of energy and major of it is converted into heat, As todays graphics card uses around 110 to 170 W energy 150 can be considered safely, accordingly
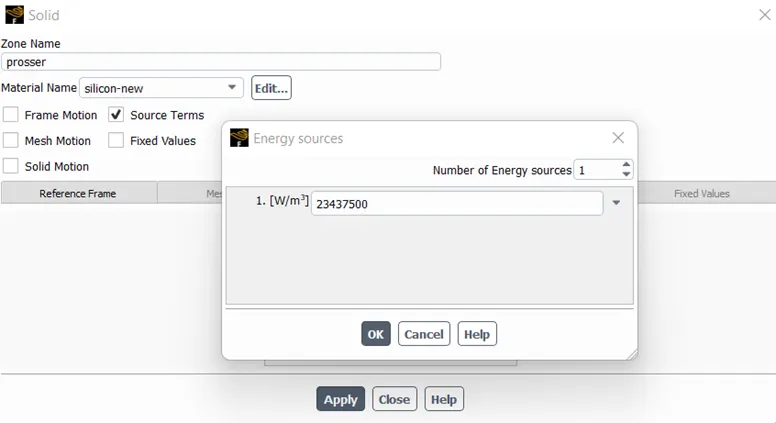
150 / (0.08*0.08*0.001) = 23437500 W/m^3
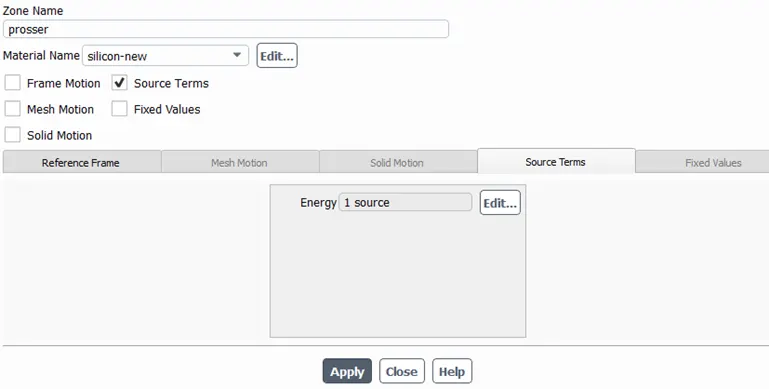
So, we can put the value as constant value in source term for processor
MATERIAL USED:
- Fins - Aluminium
Density = 2719 Kg/m^3
Heat capacity = 871 J/Kgk
Thermal conductivity = 202.4 W/mK
- Processor – Silicon
Silicon is not available in fluent database so a material is created manually
Density = 2000kg/m^3
Heat capacity = 710J/KgK
Thermal Conductivity = 150W/mK
- PCB – FR4
FR4 is widely used in Graphics Card where it has very low thermal conductivity so it is more proffered material
Density – 1850 g/m^3
Heat capacity = 950 j/KgK
Thermal conductivity – 0.29 W/mK
- Fluid – Air
Density = 1.225 kg/m^3
Heat capacity = 1006.43 j/KgK
Thermal Conductivity = 0.0242 W/mK
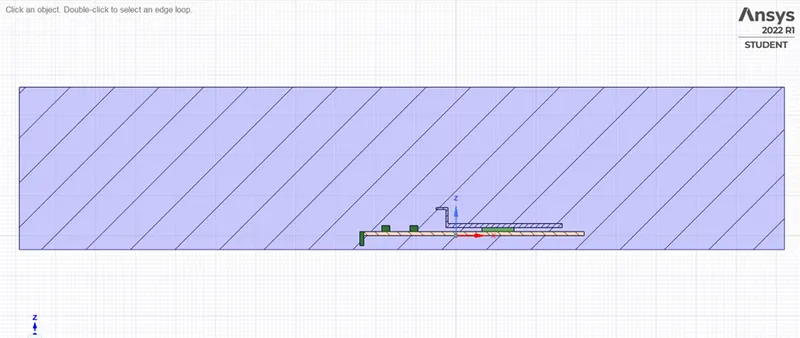
The tropology is set to Share so the CHT can be calculated precisely
Above fig. shows the entire domain, the inlet is from left and the fins ate facing to the inlet, we are going to check the behaviour oh processor heat in 3 different velocity of air inlet i.e.,
CASE 1 – 2M/S
CASE 2 – 4M/S
CASE 3 – 5M/S
MESHING:
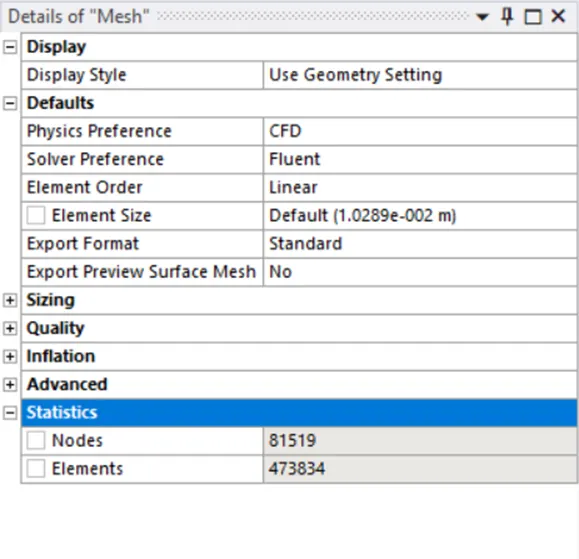
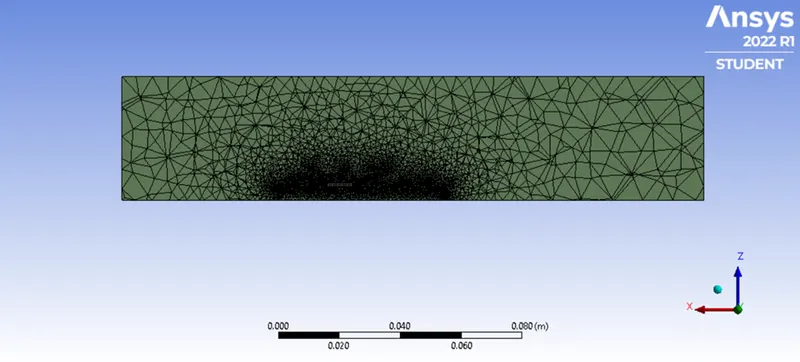
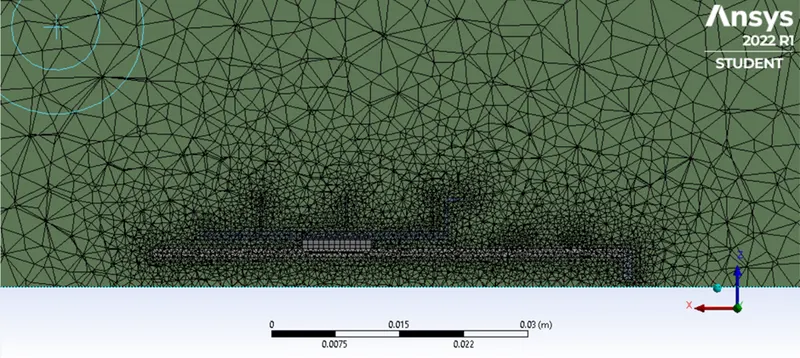
Trapezoidal mesh is used in entire domain where body sizing is used in graphics card setup to make the mesh finer in that region
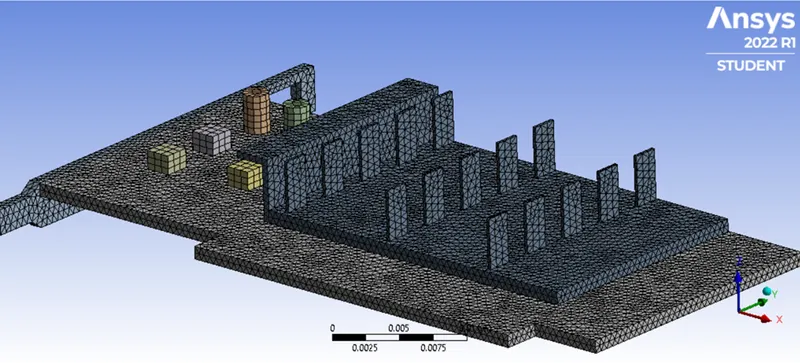
Total no. of nods in my setup are 473834
SETUP:
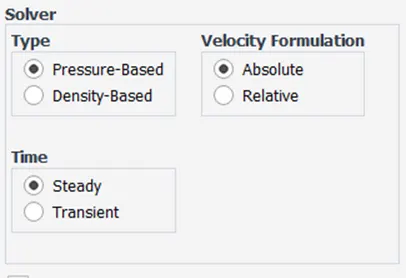
In this process we are using a steady state analysis were
Solver – pressure-based solver with energy equation activated as we have to study the temperature
Turbulence model – K-epsilon model
Heat generating term – 23437500 W/m^3
Side wall- Symmetry
Number of iterations – 300
CASE 1:
Inlet velocity = 2m/s
Residuals:
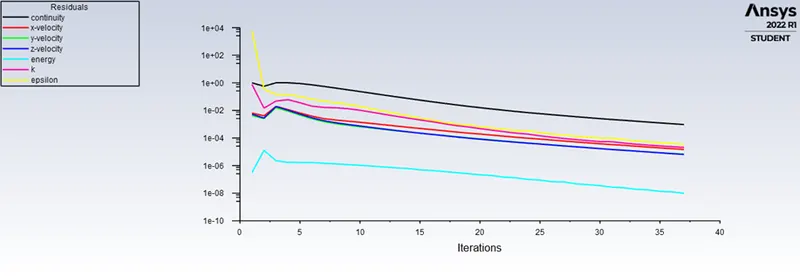
The solution converges around 70 iterations
Results:
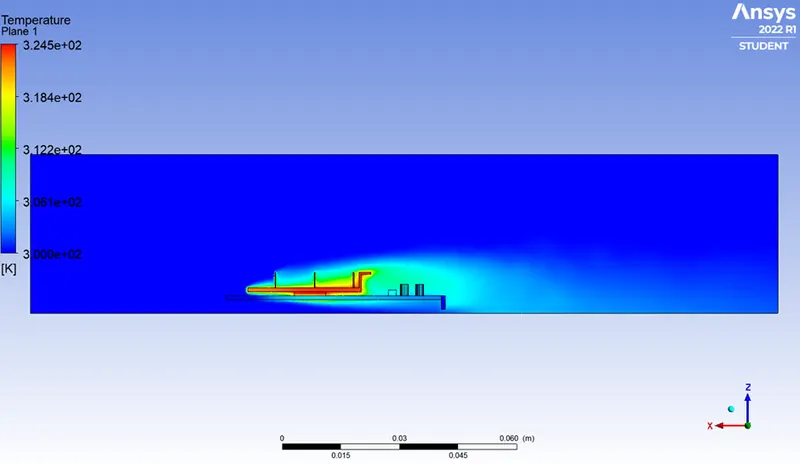
Temperature contour:
Average temperature of body
Maximum temperature:
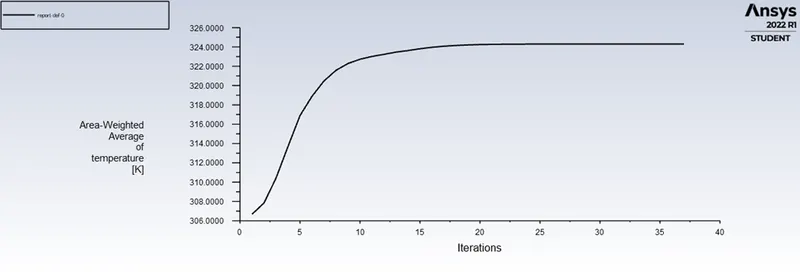
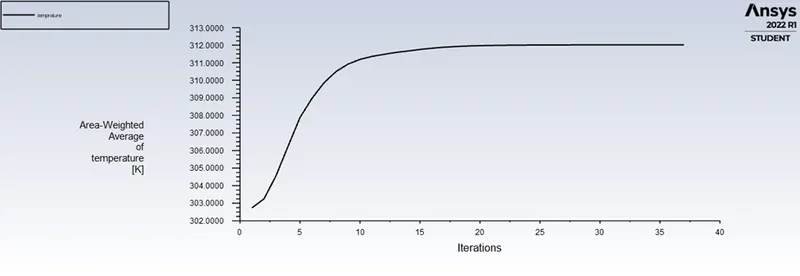
This Graph is plotted from a data at processor, so this is the maximum temperature of the body achieved
Maximum temperature = 325K = 52.85 C
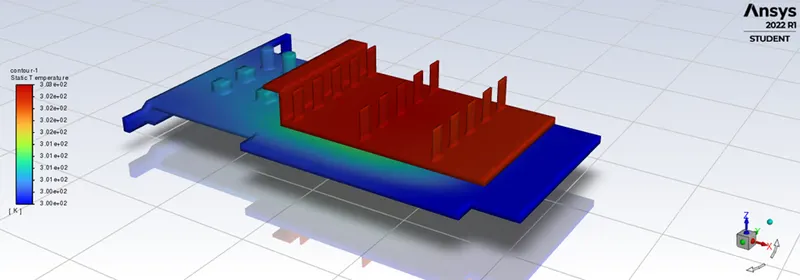
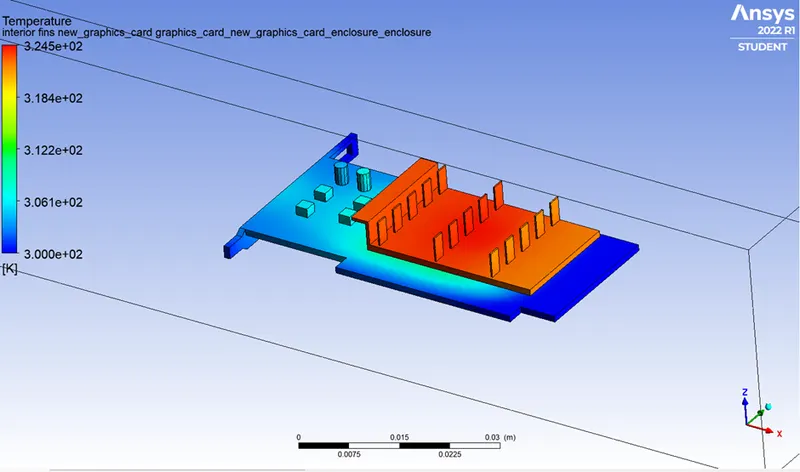
It can be seen that maximum heat is been transferred at fin area for cooling and as the cold air first touches the frontal fin area it can be seen that those fins in front are less hot then compare to the fins in the back
Temperature Distribution:
Flow of Air Around Fins:
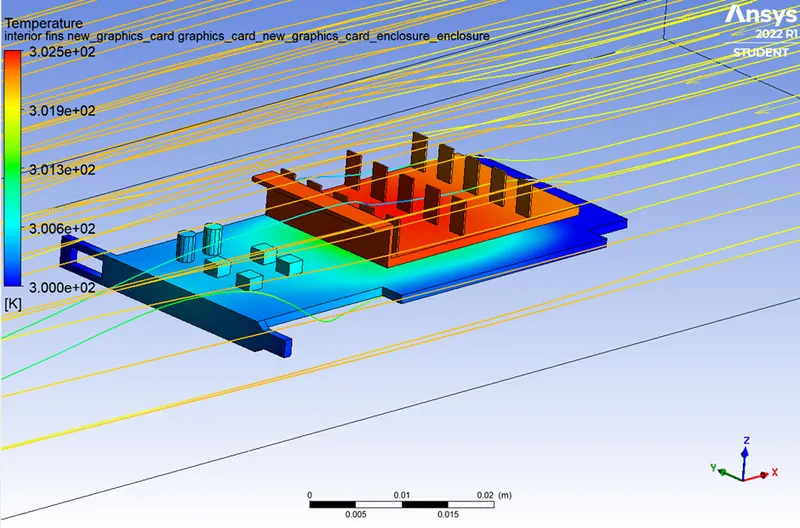
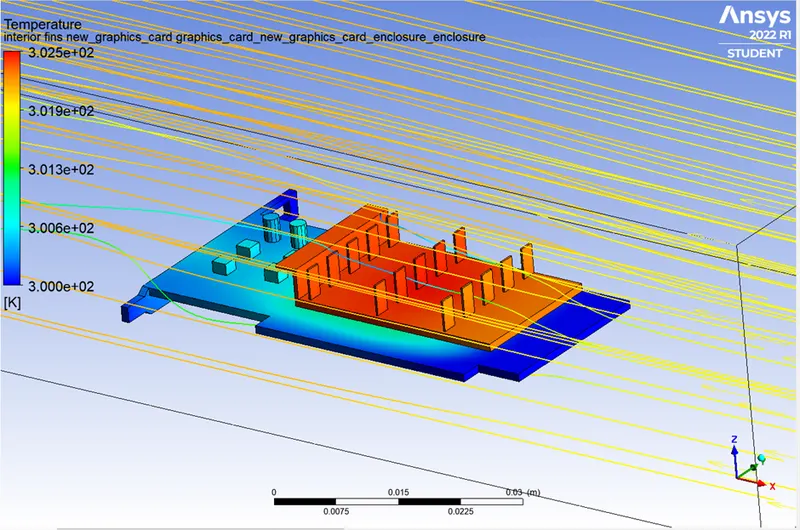
Temperature Rendering:
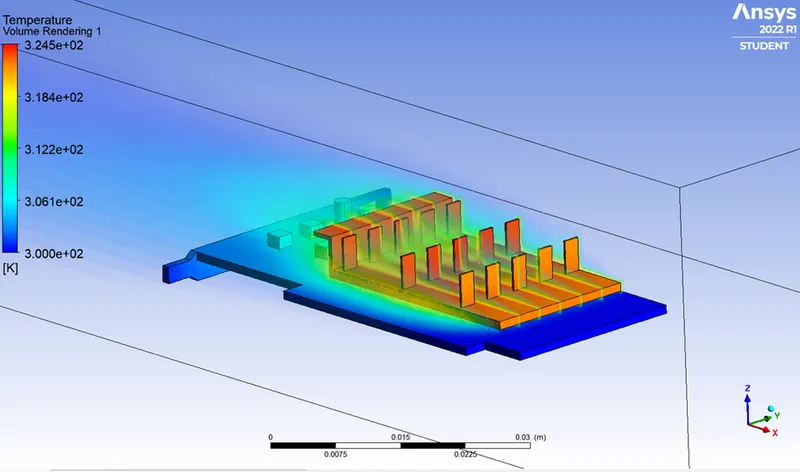
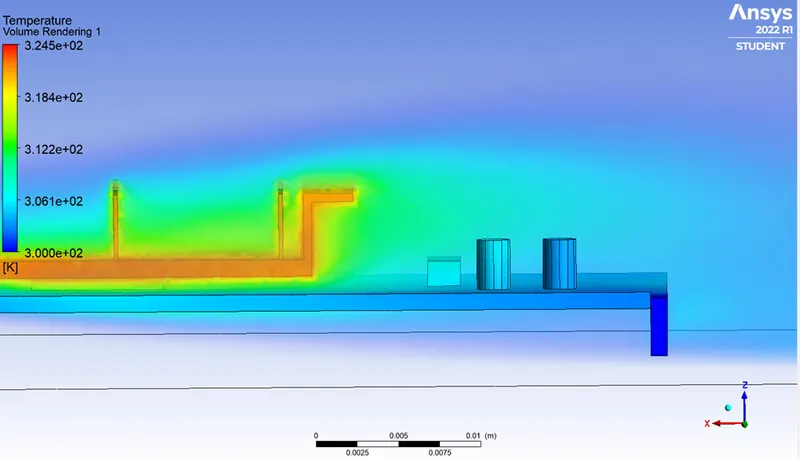
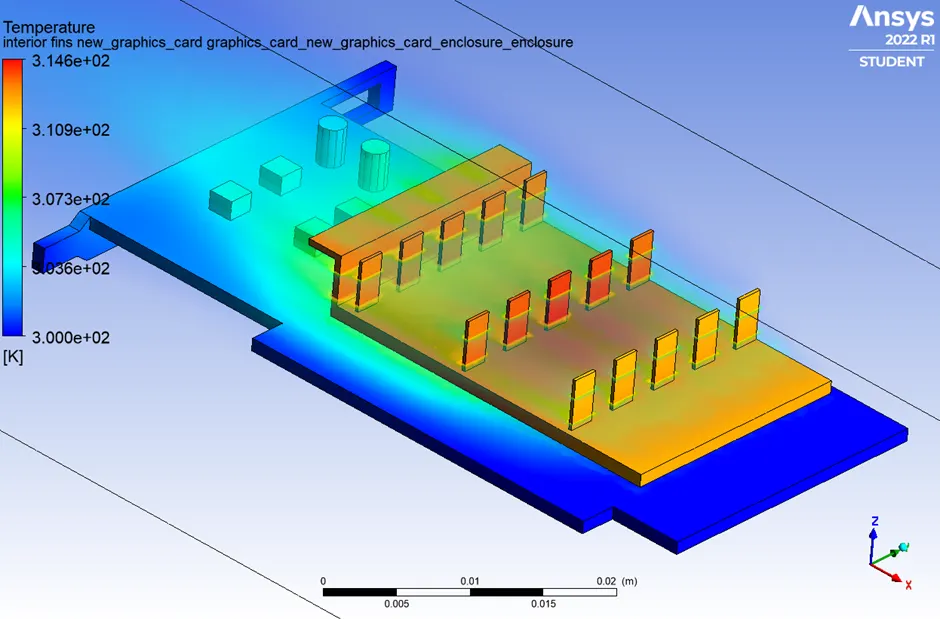
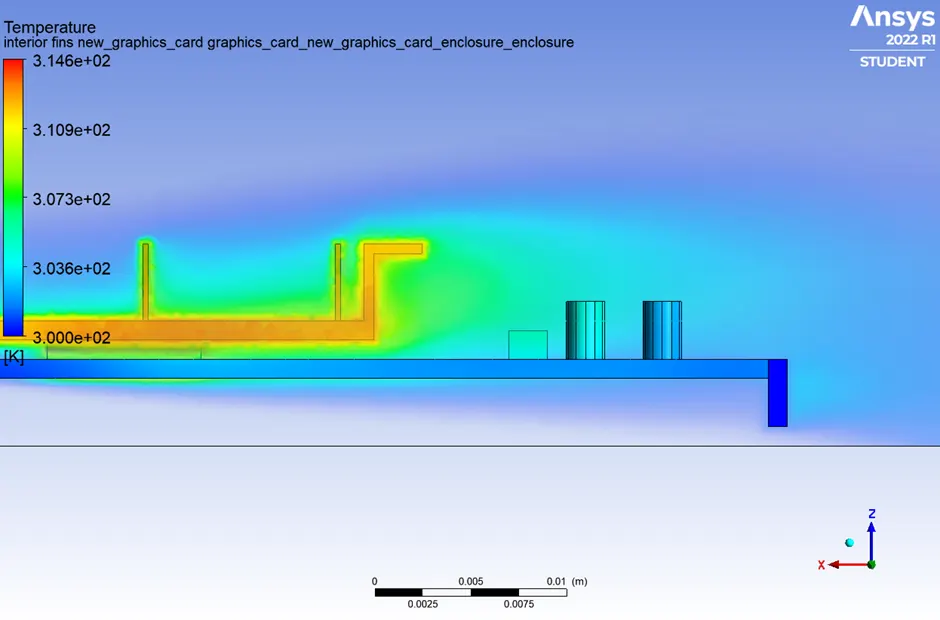
We can see in above Fig. that a green area is made just beside the fin area where the temperature is high as air is not able to reach there in cool state, so we can say that placing a component in that are can cause the damage of any electrical component
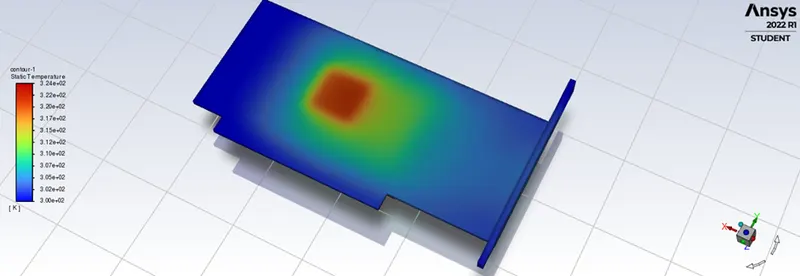
A hot spot can also be seen in the bottom of the graphics card
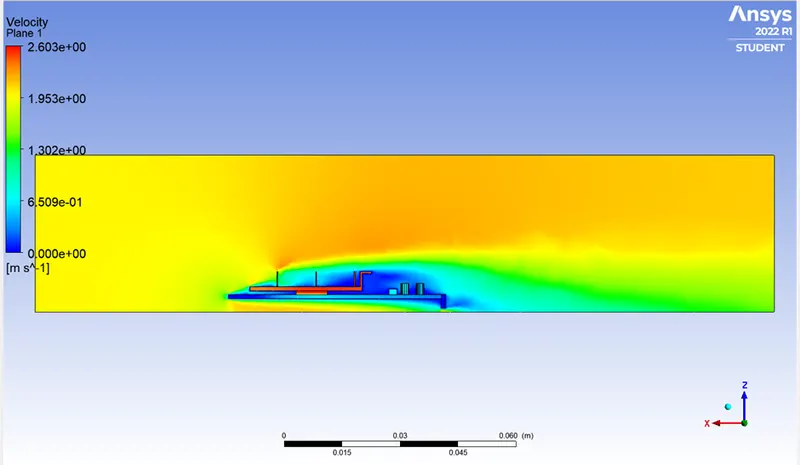
Velocity distribution
Temperature Distribution:
Wall Heat Flux
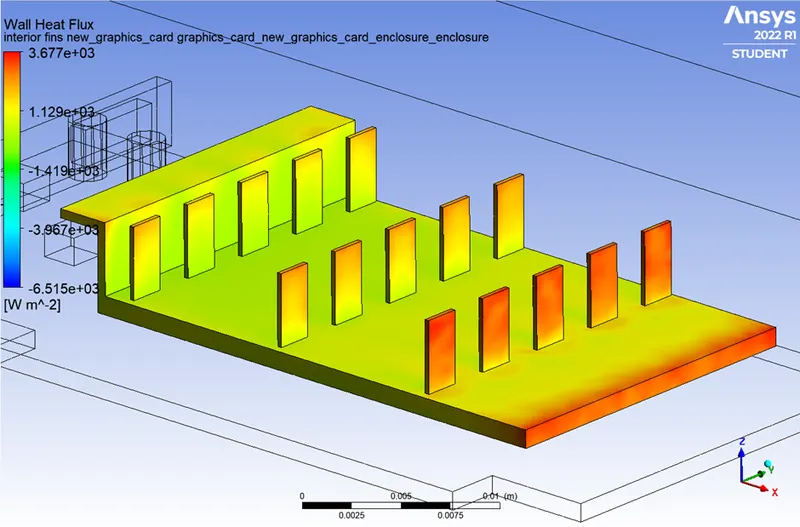
Heat flux is higher at the tips of fin as in that area a air is cooling and connecting even in the backward fins
CASE 2:
Inlet velocity = 4m/s
Residuals
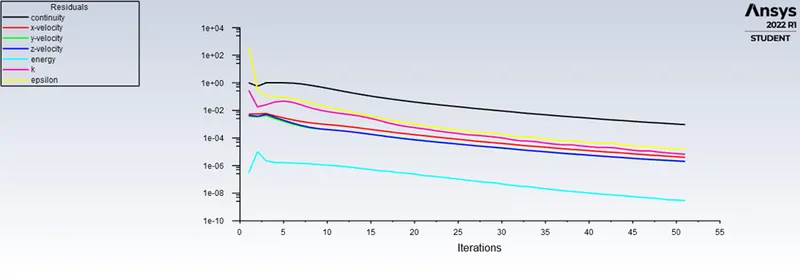
The solution was converged around 50 iterations
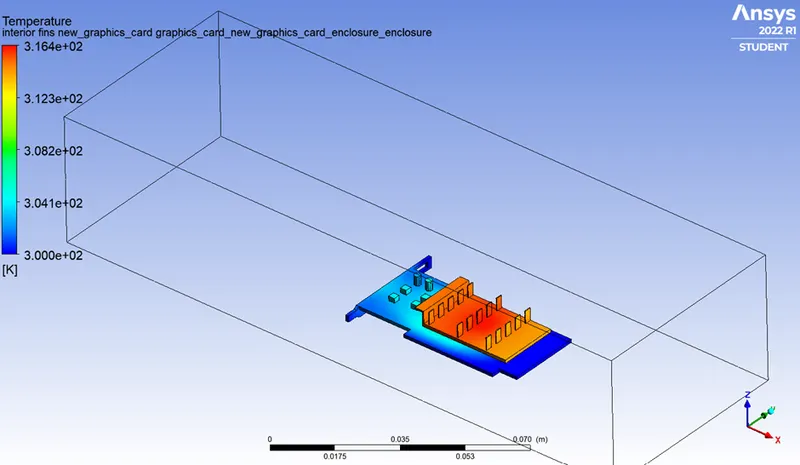
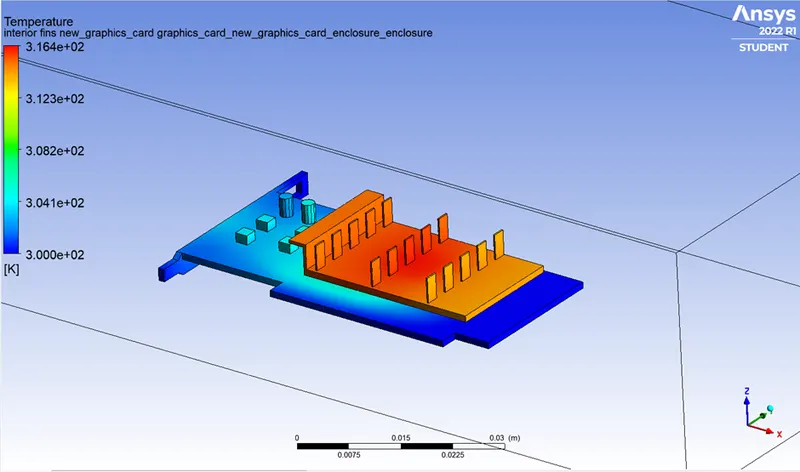
Temperature plot:
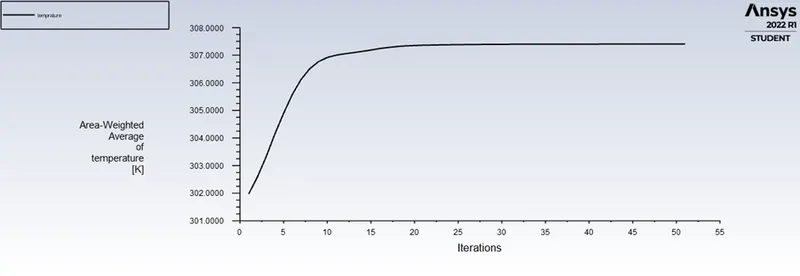
Overall temperature of graphics card is 309K i.e., 42.3 C
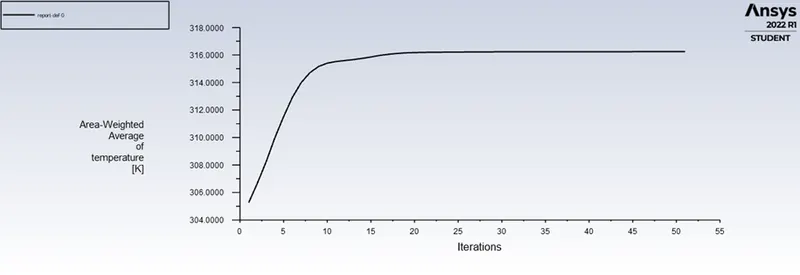
Maximum Temperature = 318K = 44.5 C
Remaining all seems to be same as the last case
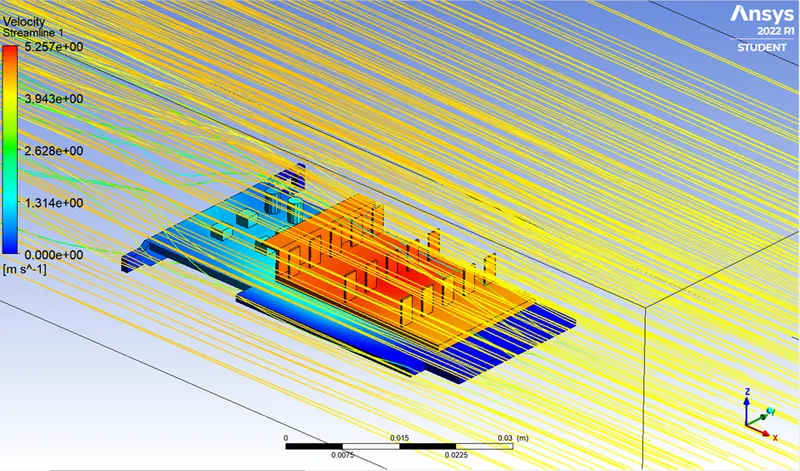
Velocity Distribution
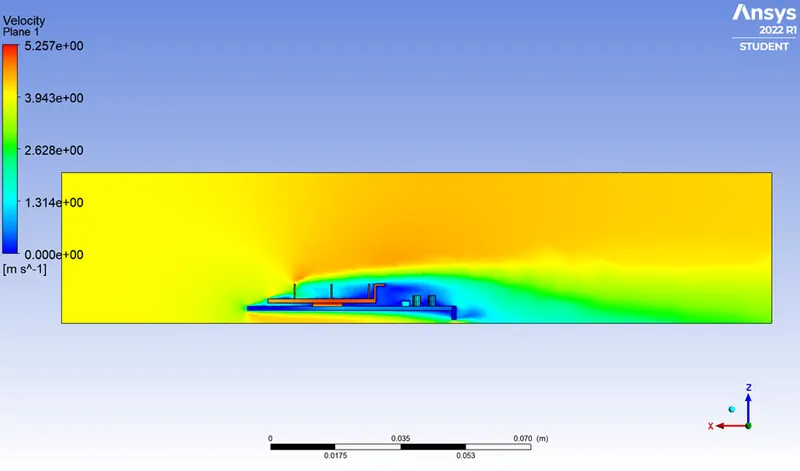
Temperature Distribution
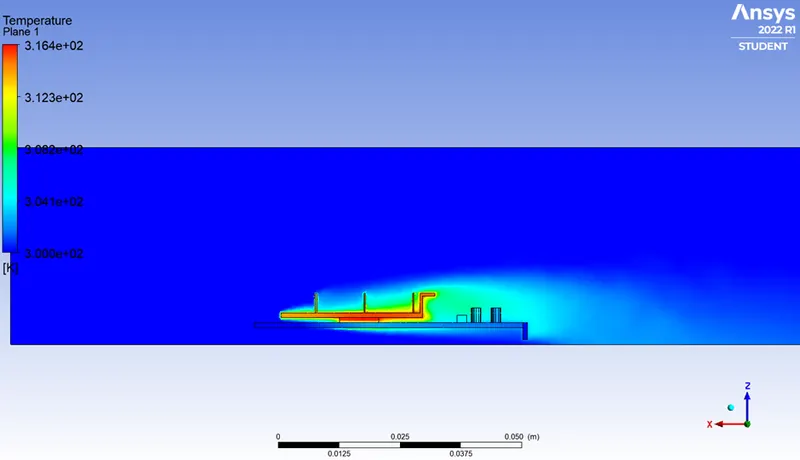
We can see the same hot Spots are created behind the fin areas
Flow of Air:
Wall Heat Flux
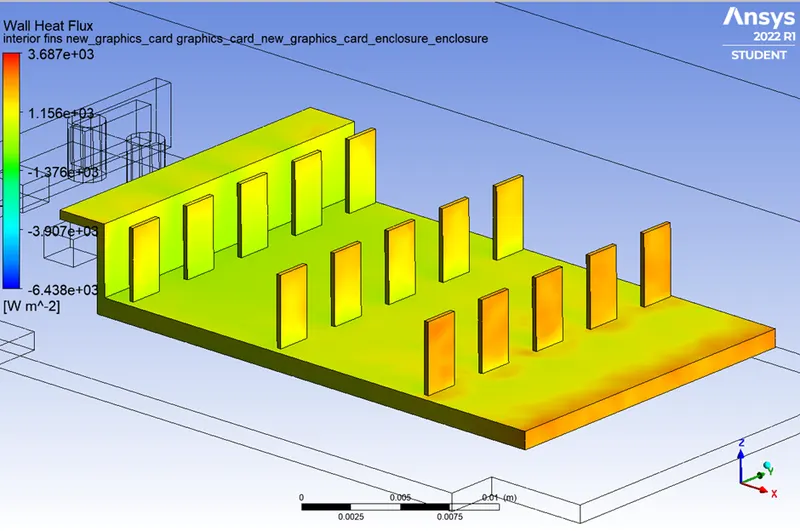
Heat Flux is positive at the front fins where the cold air hits first and gradually till the last fin the heat flux become negative
CASE 3:
Inlet velocity = 5m/s
Results:
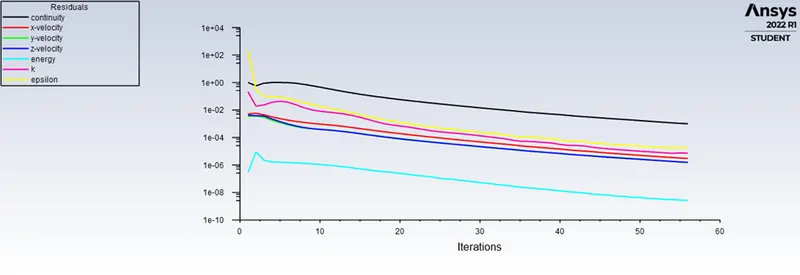
Residuals:
Temperature
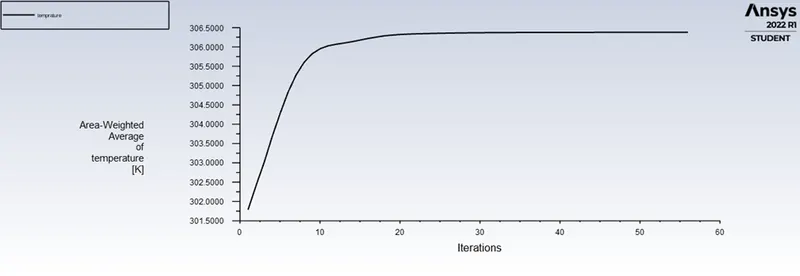
Average Temp. – 305K = 31.85 C
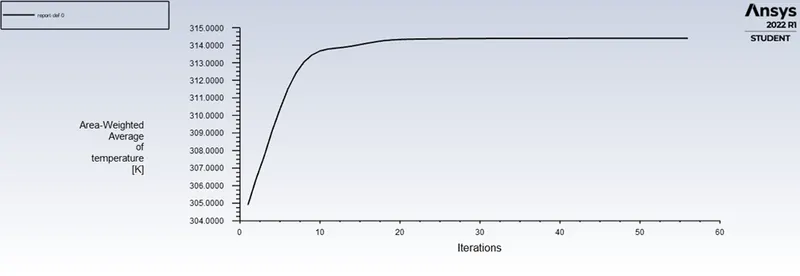
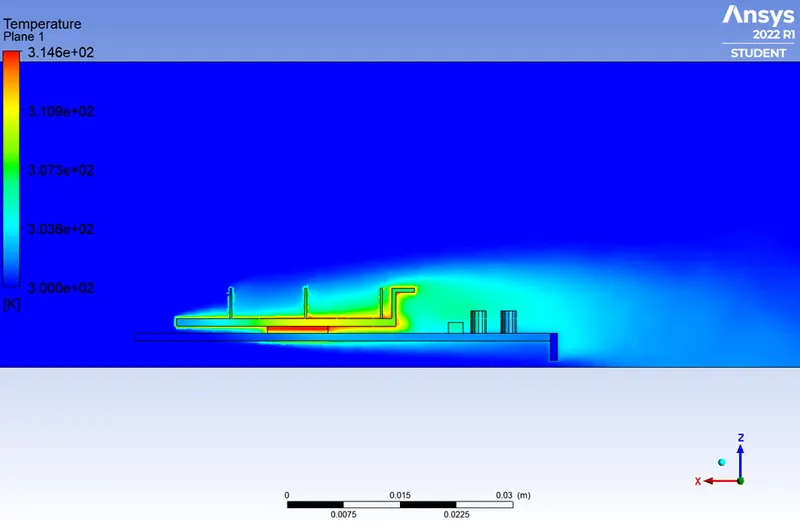
Max Temperature = 314.8 K = 41.65 C
Temperature distribution:
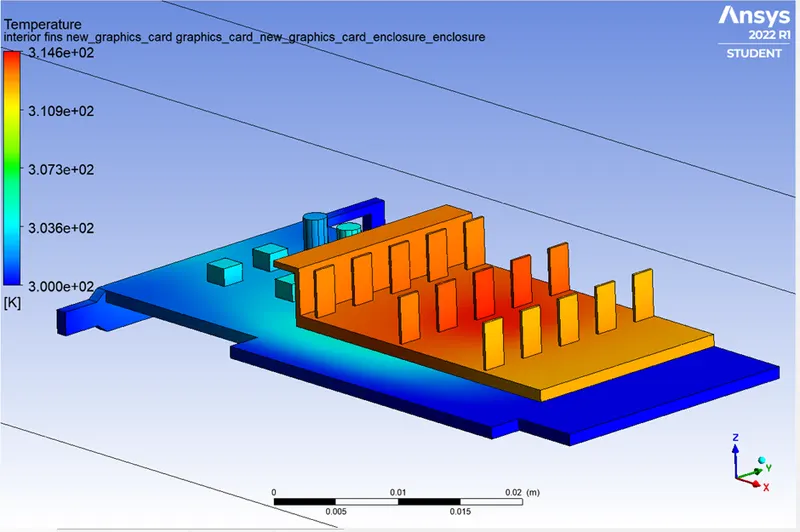
Local Temperature Distribution:
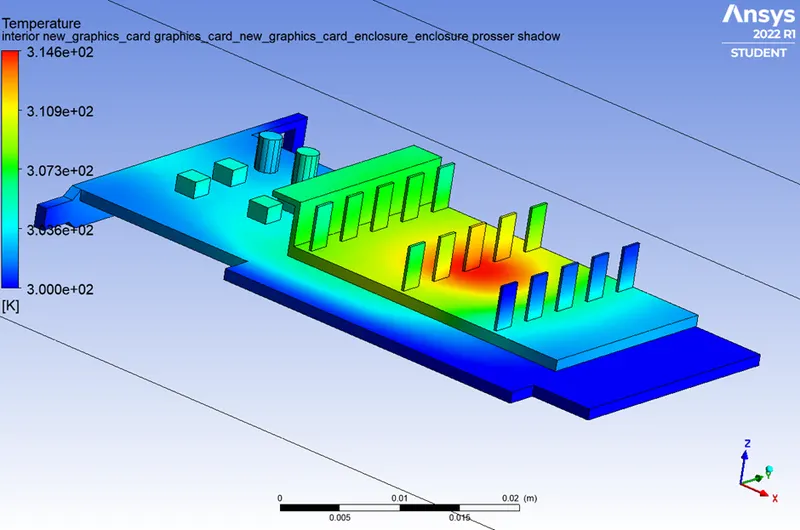
Temperature Rendering:
Temperature Distribution on plan
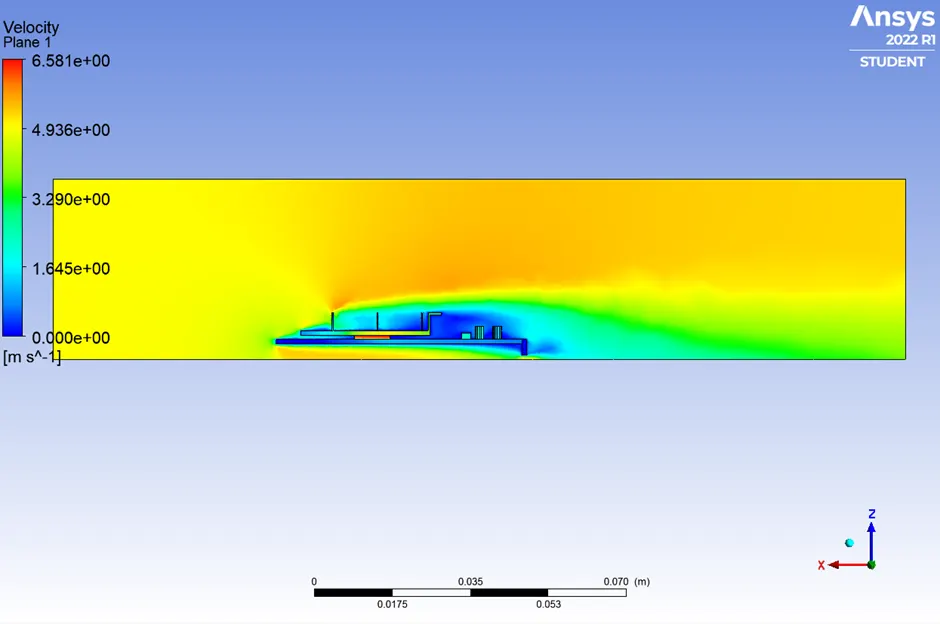
Velocity along plan
Wall heat Flux
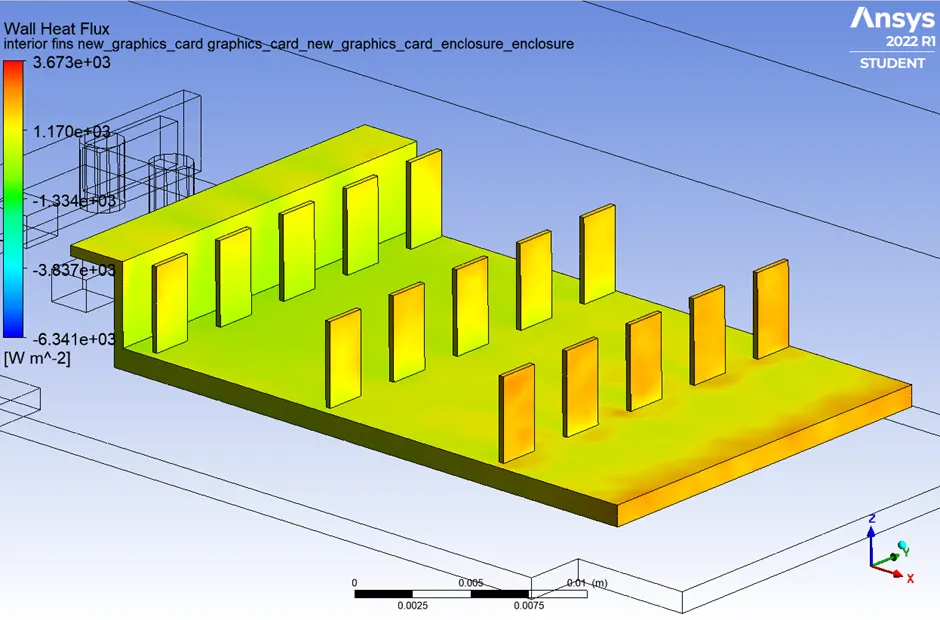
We can see from last time the heat flux has decreased as the velocity increases
Final Comparison:
|
Sr. No. |
Inlet Velocity(m/s) |
Max. Velocity (m/s) |
Max. Temperature (Deg. C) |
|
Case 1 |
2 |
2.603 |
52.85 |
|
Case 2 |
4 |
5.25 |
44.5 |
|
Case 3 |
5 |
6.58 |
41.65 |
CONCLUSION
- As the inlet air increases the average heat decreases of graphics card
- Also, the heat Flux also decreases causing good cooling of graphics card
- Mash needs to be fine in the area where we need to find the heat flux accordingly