Week 6 - CHT Analysis on a Graphics card
Aim
Perform a steady-state conjugate heat transfer analysis on a model of a graphics card
Objectives
- Run the simulation by varying the velocity from 1m/sec to 5m/sec for at least 3 velocities and discuss the results.
- Find out the maximum temperature and heat transfer coefficient attained by the processor.
- Prove that the simulation has achieved convergence with appropriate images and plots.
- Identify potential hotspots on the model.
Methodology
- Introduction
A CHT analysis is nothing but an analysis where we will be modeling both the fluid flow and the heat transfer through it. Examples are, flow through the exhaust port of an engine, heat exchangers, cooling of electronic equipment, etc. It is used to simulate the heat transfer either between solid and solid or solid and fluid.
A Graphics card is hardware that is used to increase the video performance of a computer while gaming, designing, etc. It enhances the performance of a computer and supports the computer to perform heavy tasks which require additional video memory.
A graphics card mainly consists of the following parts
- A processor
- A fin
- PCB board
- A fan
- Preprocessing
- Model creation (For Baseline Meshing)
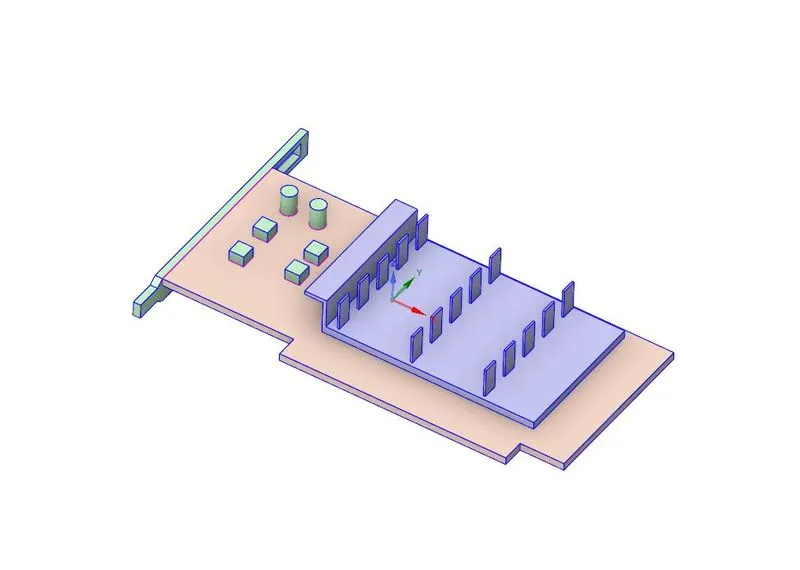
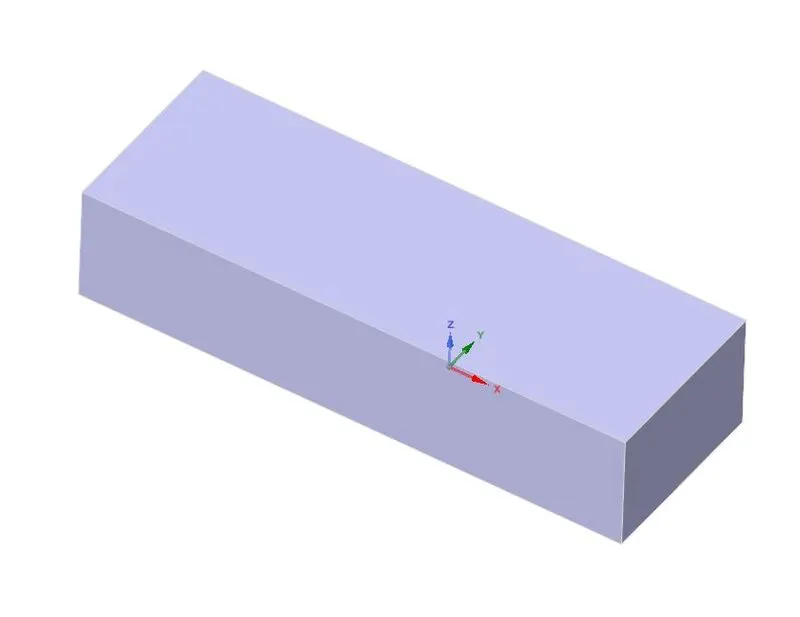
A model of graphics card has been loaded into ansys Spaceclaim. The graphics card is enclosed with an enclosure to simulate the airflow over the graphics card.
In order to be sure that the information from one region is transferred to the other region smoothly, we need to share the topology in spaceclaim. If we don’t do this, there is a high chance that the mesh will fail. For this go to workbench and click on share. After clicking on tick we can see a red line at the interfaces, which says that the information’s are shared with each other.
Graphics card.
Enclosure
- Naming and meshing of domains
After naming all the faces and walls we will proceed to mesh. Here we need to define inlet, outlet, and symmetric walls before we proceed further. Here, we don’t need to define other solid walls as the solver will automatically identify each. Also, we will Name the processor, fins, and board for our reference.
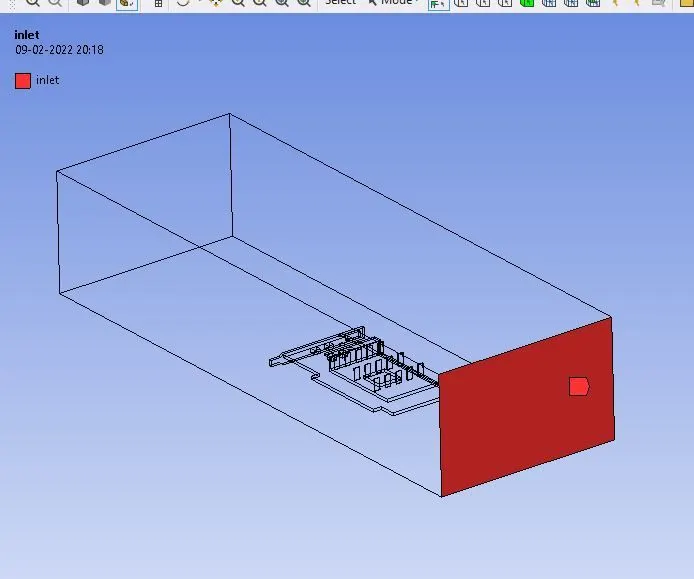
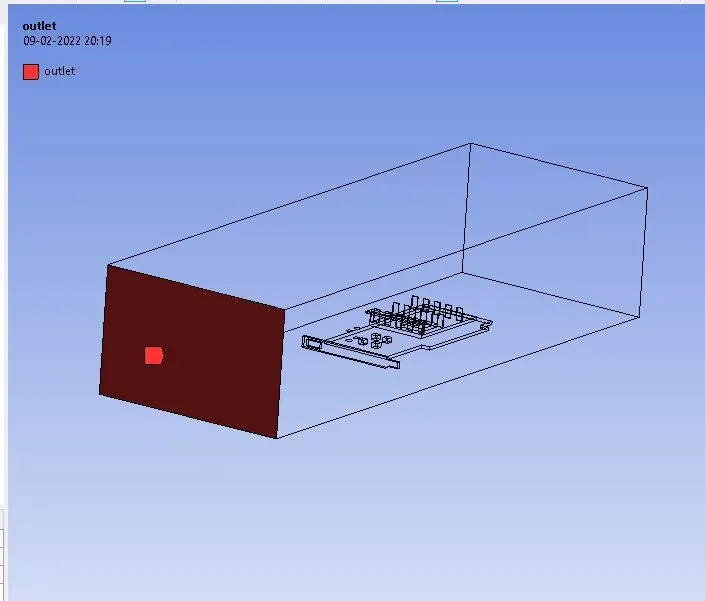
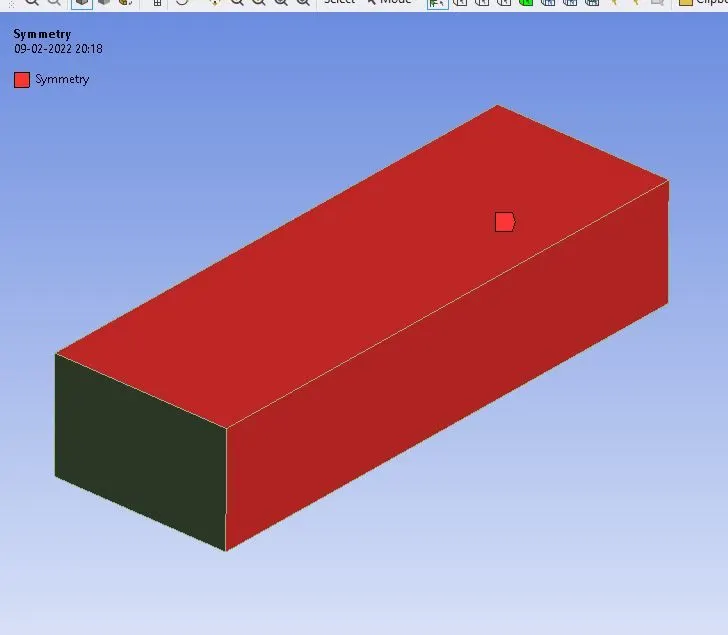
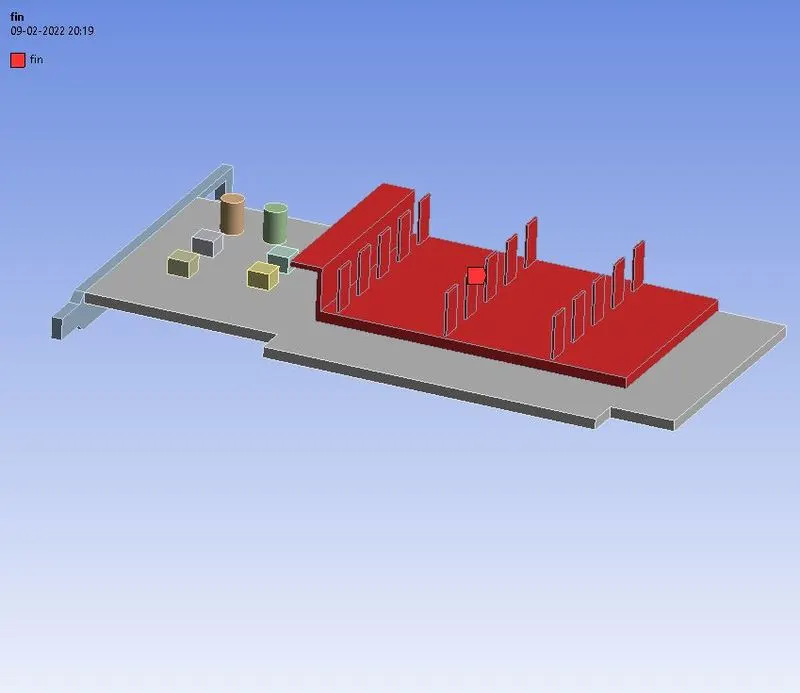
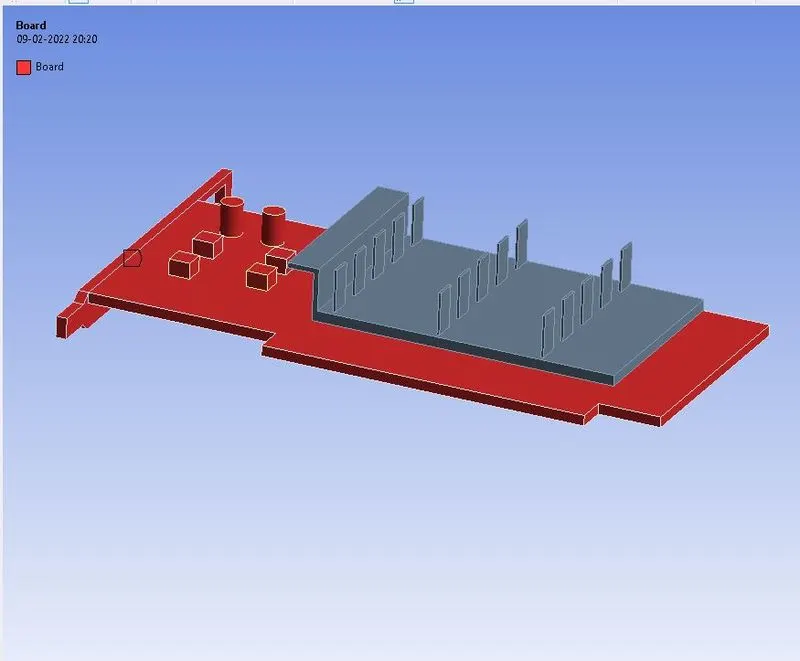
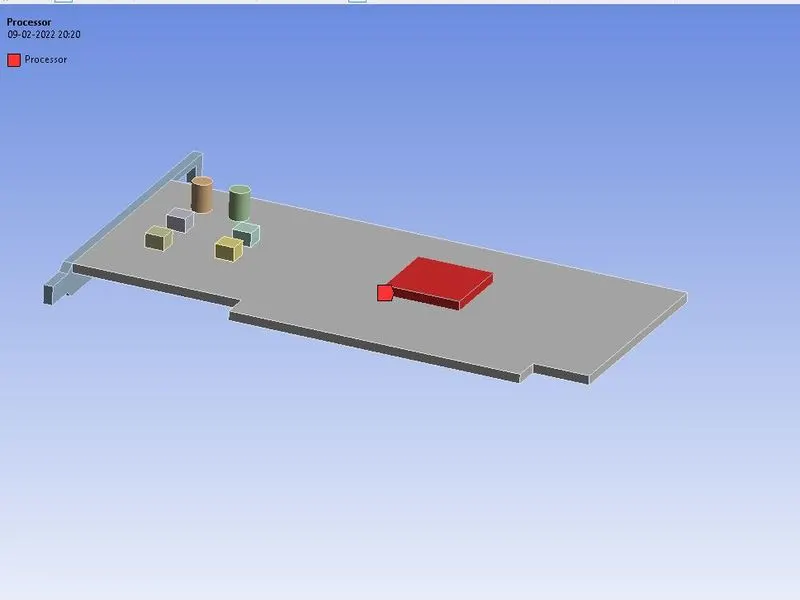
Now right-click on mesh and click on generate mesh to create baseline Mesh.
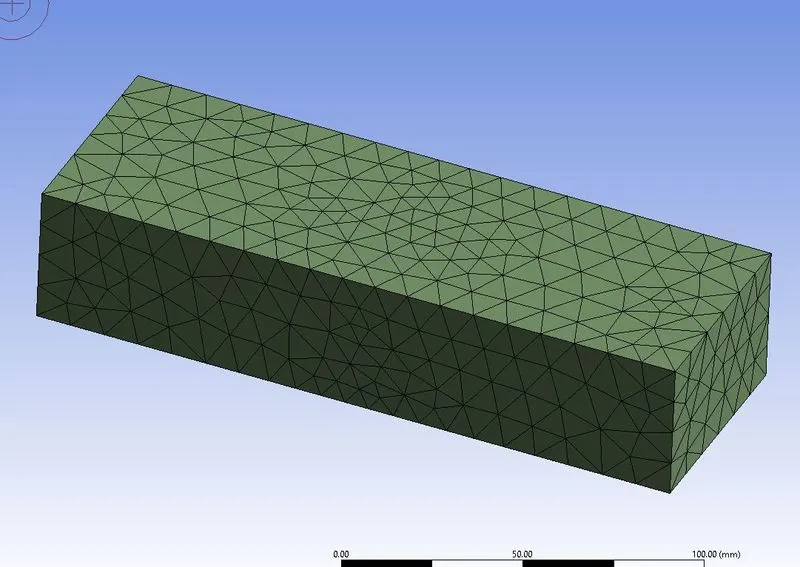
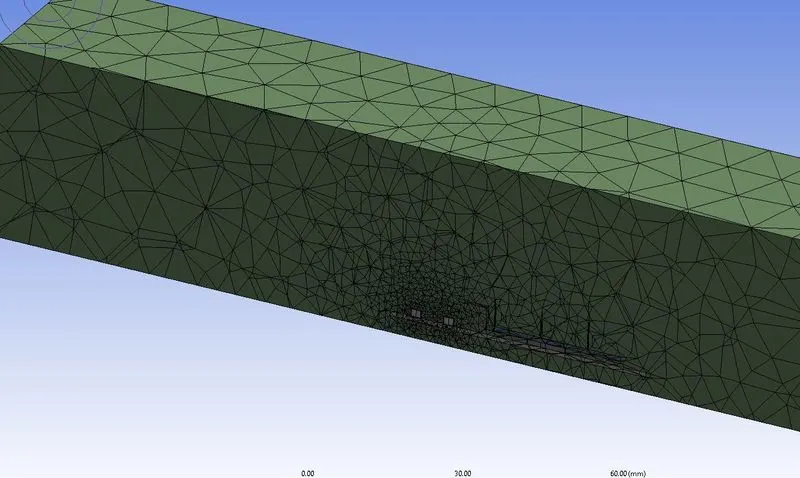
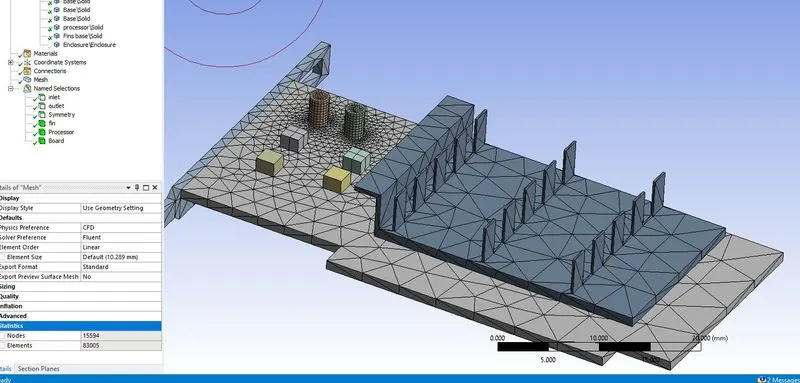
Number of elements = 83005
- Setting up the problem
Here we set up the problem by applying relevant
- Initial conditions
- Boundary conditions
- Material properties
- Turbulence Models
Here we are using a pressure-based (Mach number is less than 0.3) steady solver. The fluid is air with a freestream velocity of 2m/s.
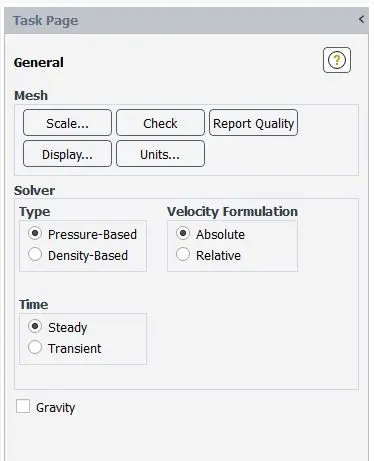
Turn on the energy and select k-epsilon as a turbulent model.
Material Properties
The fluid is Air and the solid is Aluminium. Material properties are as shown below.
Air - Enclosure
Density =`1.225 (kg)/m^3`
Thermal conductivity = 0.0242 W/mK
Specific Heat`=1006.43 J/(kgK`
Aluminium - Fin
Density =`2719 (kg)/m^3`
Thermal conductivity =`202.4 W/(m K`
Specific Heat`=871 J/(kgK`
Epoxy FR-4 – Board
Density =`1850 (kg)/m^3`
Thermal conductivity =`1100 W/(m K`
Specific Heat`=0.25 J/(kgK`
Silicon – Processor
Density =`2329 (kg)/m^3`
Thermal conductivity = `148W/(m K`
Specific Heat`=700 J/(kgK`
The next step is to assign the materials to different cell zones, by going into the cell zone section under zones.
The above materials have been assigned to the graphics card as follows,
Processor – Silicon
Board – Epoxy FR-4
Fin – Aluminium.
Enclosure – Fluid – Air
As the processor is a heat-generating unit, we need to create a source term while assigning the material for the processor.
Processor characteristics
The selected processor is NVidia Quadro FX 380 LP which consumes 28W Power. It has a dimension of 8*8*1mm.
Therefore heat generated from the processor `= 28/(8*8*1*10^(-9) )=437.5*10^6 W/m^3`
Adding source Terms
Click on the edit tab inside the processor cell zone, select the material silicon, enable the source term.
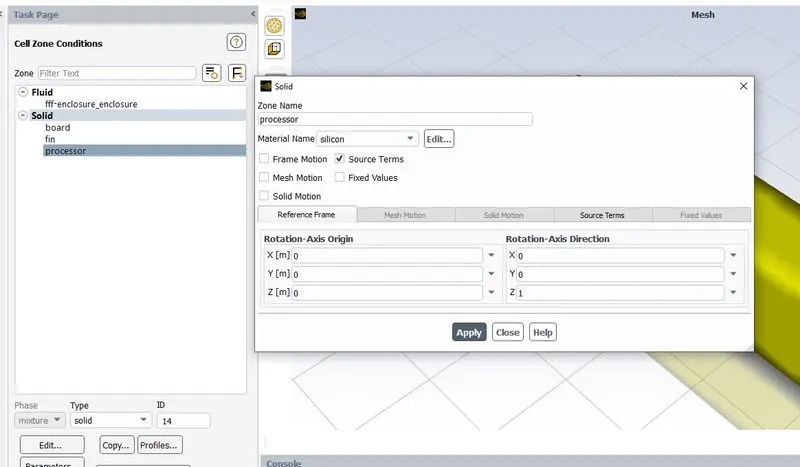
Now go to the source term tab and click on edit. Input the number of source terms and enter the value of heat generated,
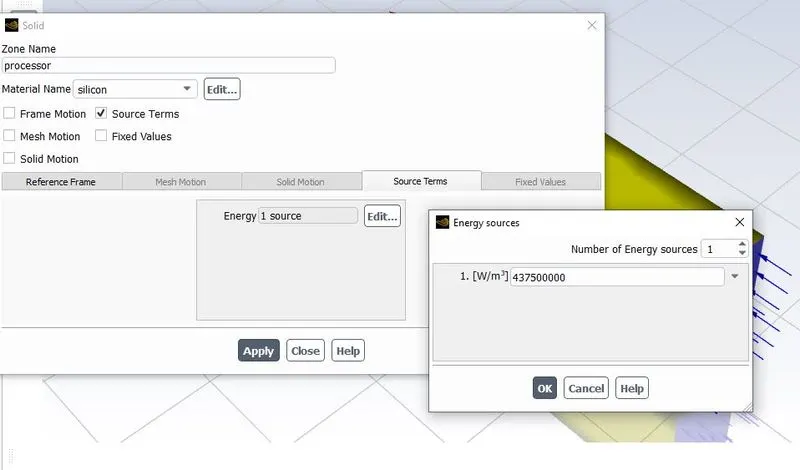
Boundary conditions
Inlet - Velocity boundary condition: Here the velocity magnitude is 2m/s
Temperature = 300 K
Outlet - Pressure outlet: Gauge pressure = 0
Symmetry wall – Symmetry
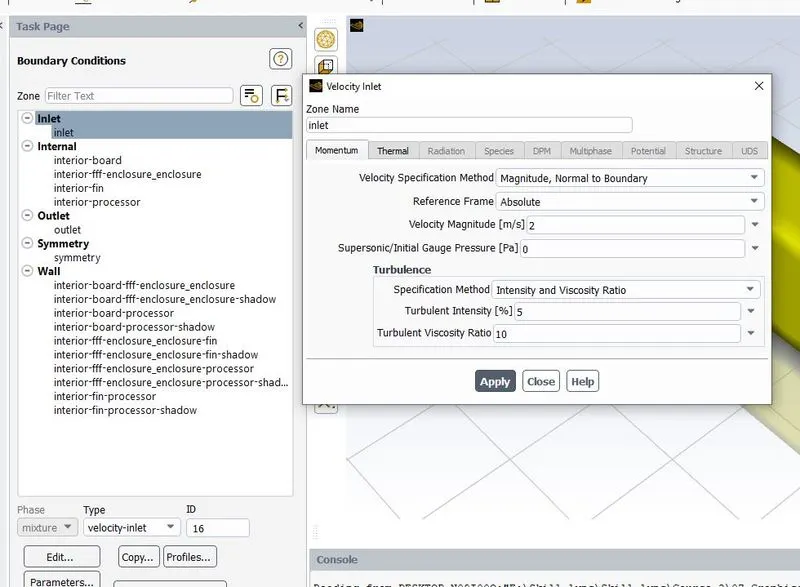
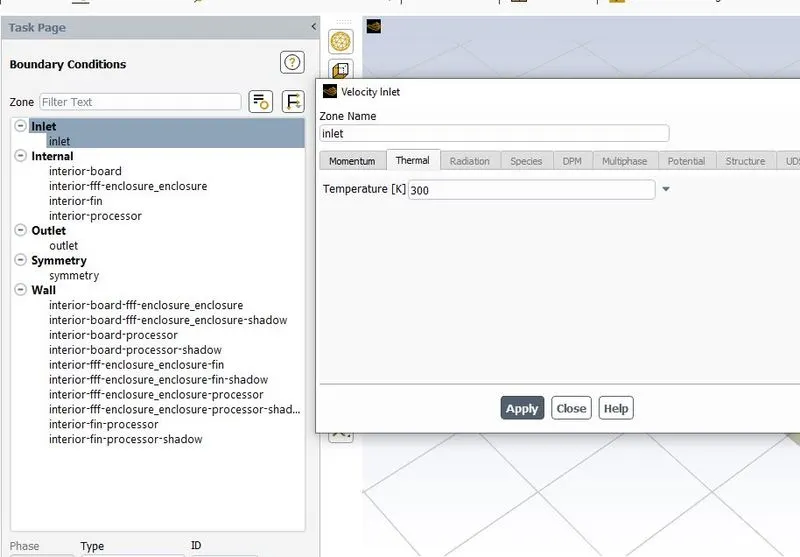
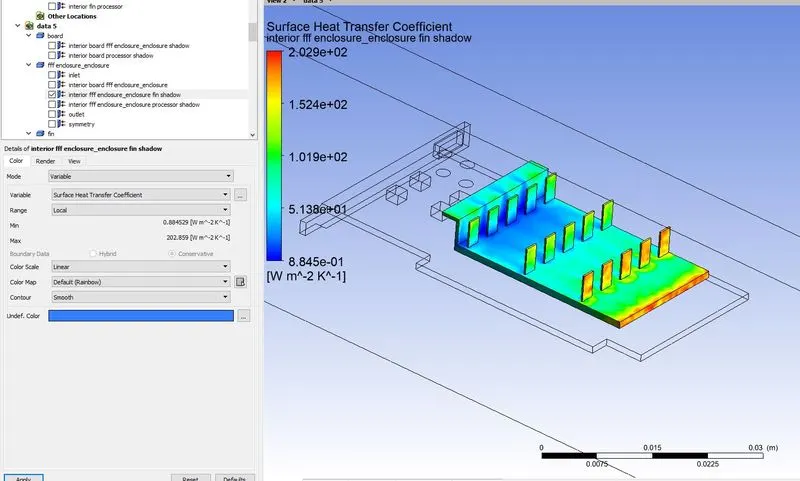
Extracting heat transfer properties: In order to plot the heat transfer coefficient on the inflation we need to export the solution data’s to a CDAT file to visualize the coefficient of heat transfers in a plot in the CFD post. By default, these options are not available in the CFD post. That’s why we are exporting the solution data to a file.
After the simulation is over go to file then export and click on solution data.
Select CDAT for CFD-Post & EnSight as file type. Then, select all cell zones and all surfaces. After this select the required quantities that need to be exported as shown in the figure.

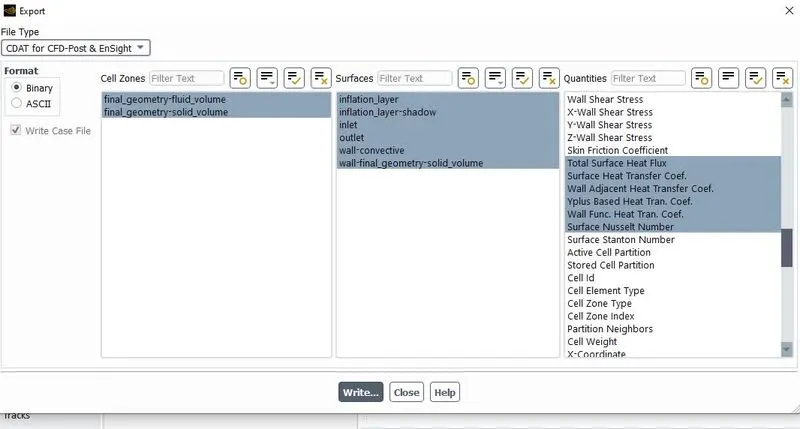
Now go to CFD Post and load the saved results by clicking on file then load results. Now the saved data will load and we can plot the required quantities as we need.
- Model creation (With local refinement)
In the above section, we created an unrefined mesh which resulted in distorted results. In order to get a better result, we will refine the processor and fin furthermore.
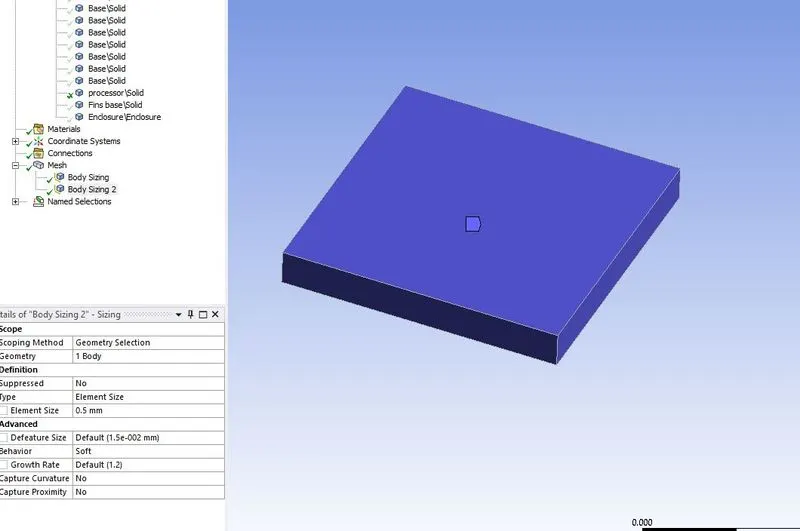
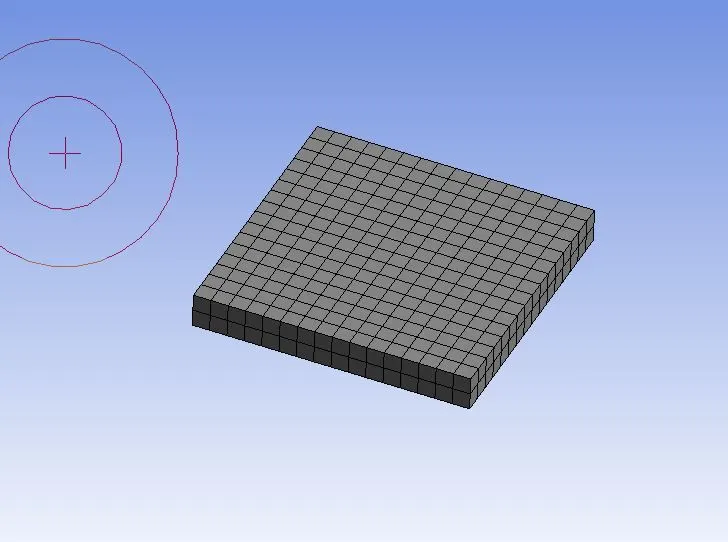
- Body sizing (Processor)
Right-click on the mesh and click on sizing. Then select the processor as body and size of the element as 0.5mm. Now update the mesh.
- Body sizing (fin)
Right-click on the mesh and click on sizing. Then select the fin as body and size of the element as 0.5mm. Now update the mesh.
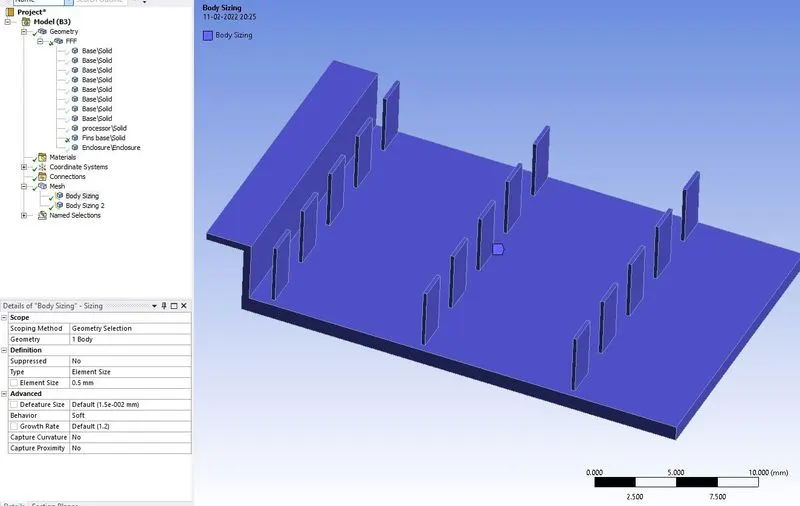
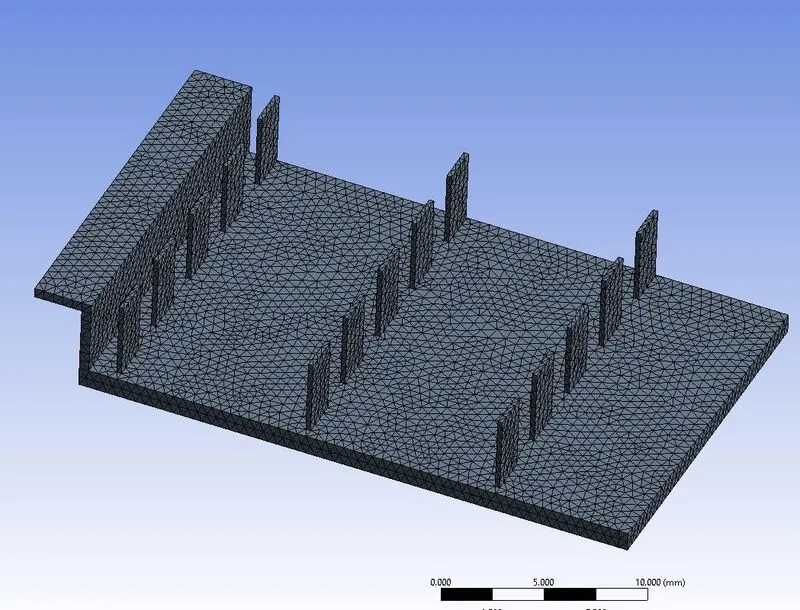
Now click on mesh and under properties give element size as 3mm and generate the mesh. This would give us our final mesh with the total number of elements = 425842
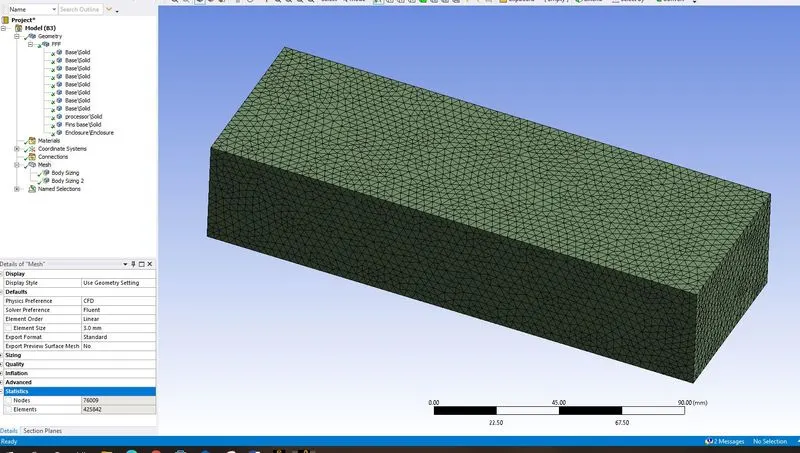
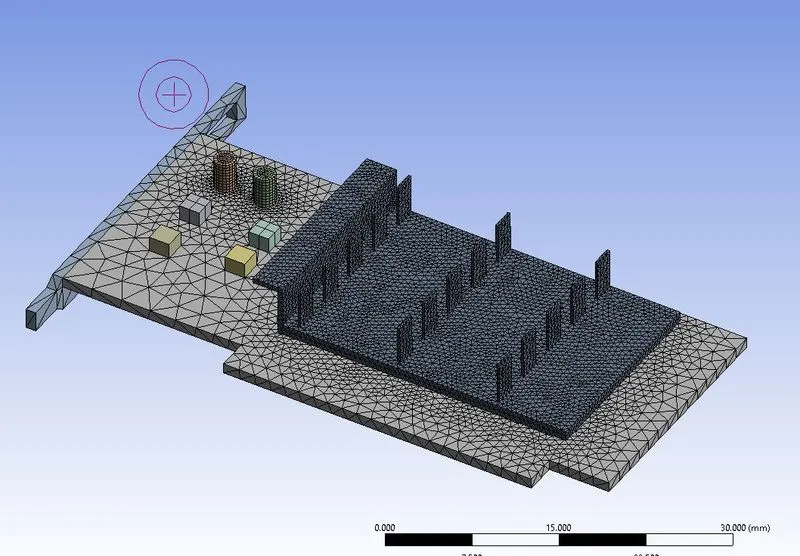
Number of elements = 425842
All the other settings are like baseline mesh setup.
We will be simulating the flow for 3 different inlet velocities. 2m/s, 3m/s and 5m/s
The solution method has been taken as coupled and hybrid initialization is selected. The solver has been set to run 1000 iterations.
- Postprocessing
- Solutions: inlet velocity is 2m/s
- Residual plot
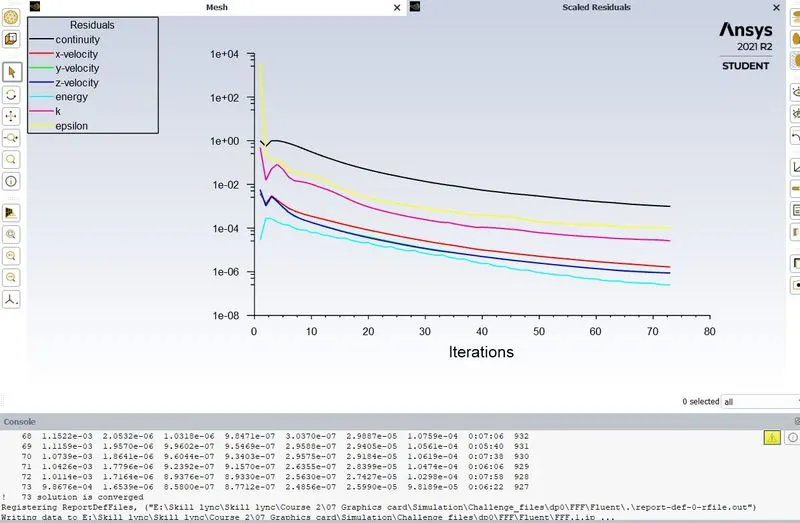
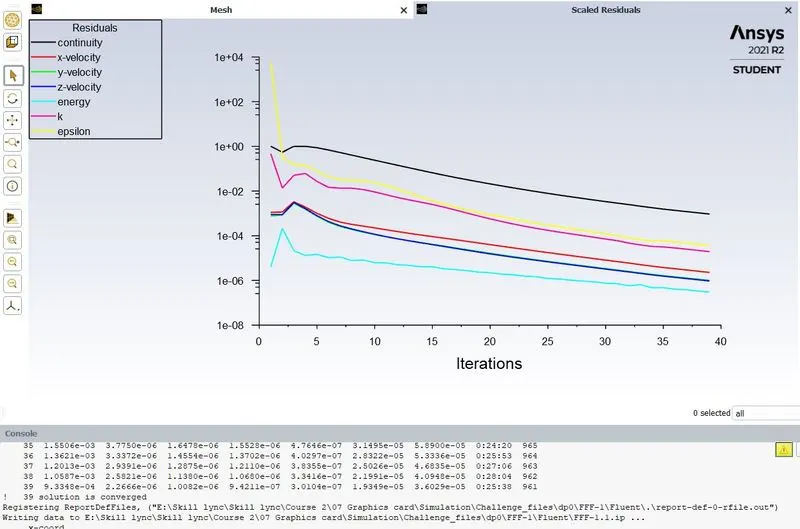 Baseline Refined Both baseline and refined mesh converged to the solution after a few iterations.
- Residual plot
- Solutions: inlet velocity is 2m/s
- Temperature plot
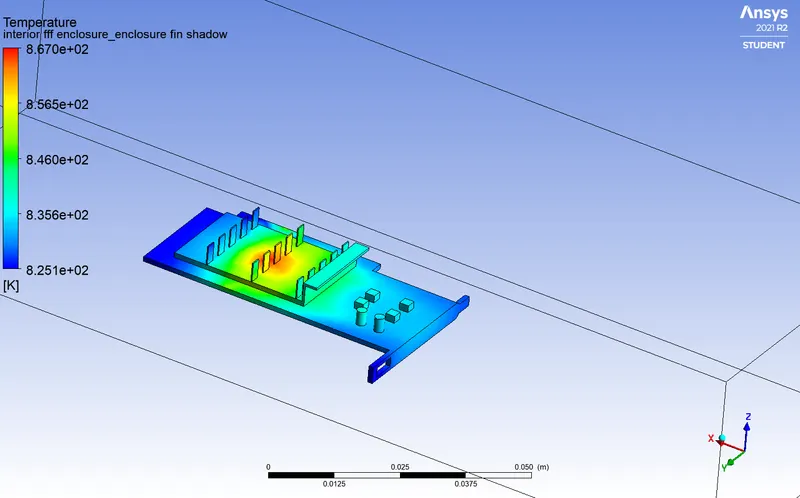
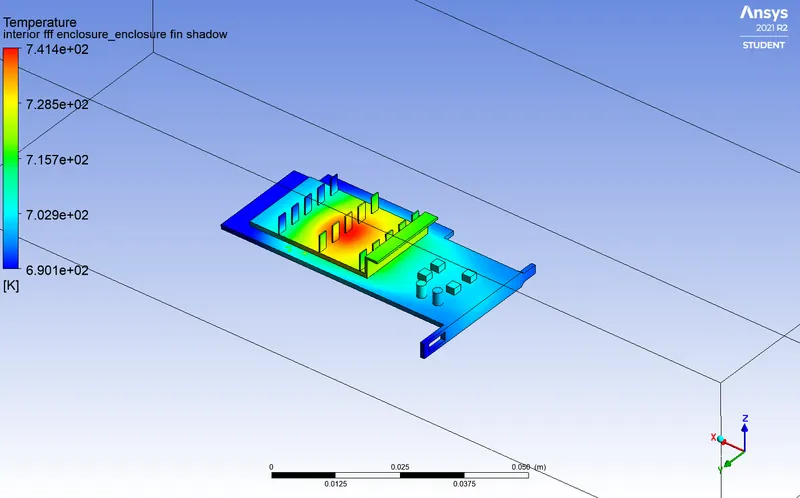
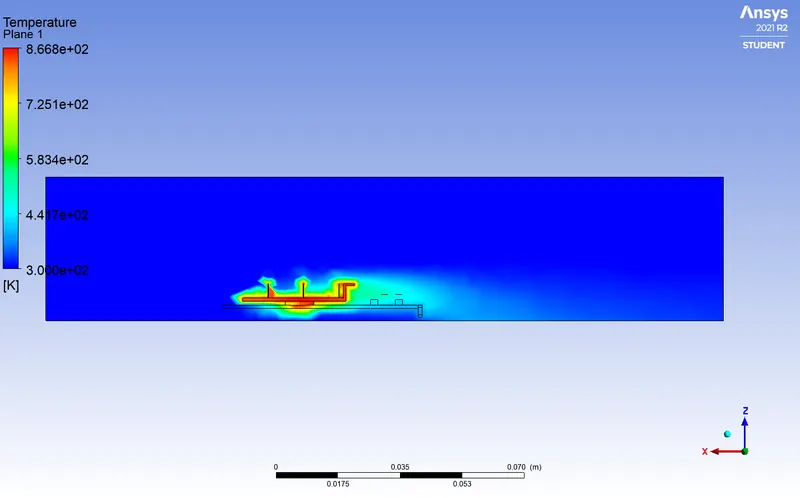
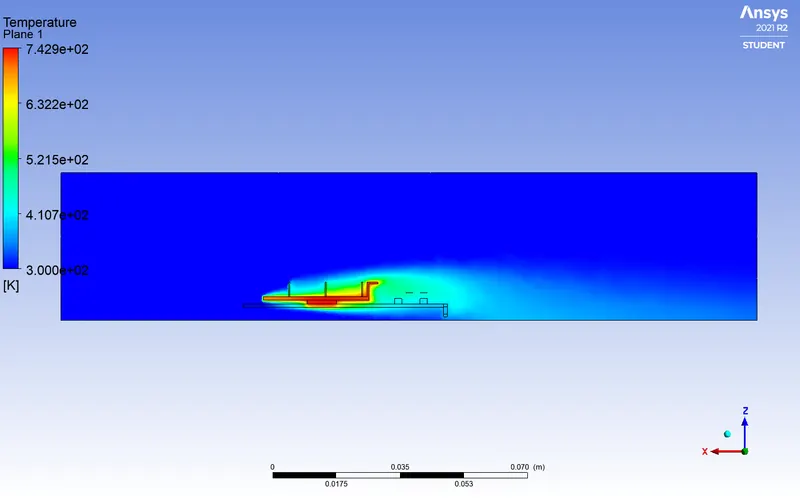
The temperature distribution on the graphics card with baseline and refined mesh are shown as above. We can observe that the baseline results are not in detail as well as the temperature because of the heat generation is also showing much difference compared to the refined results.
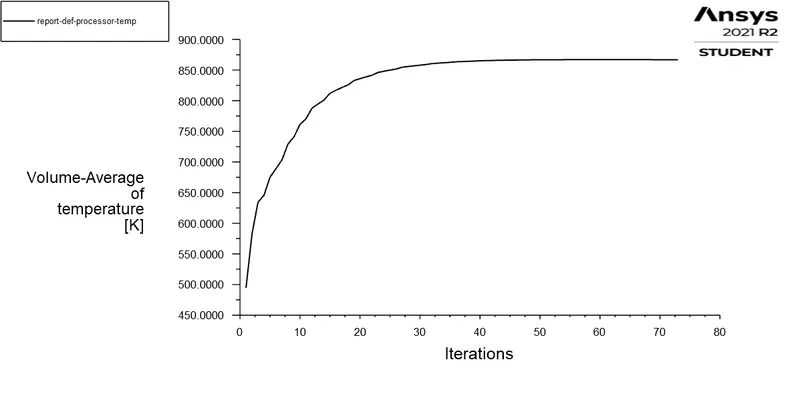
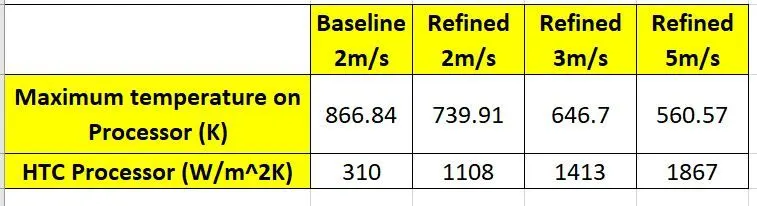
The maximum temperature attained by processor is 866.84K when the mesh is Baseline.
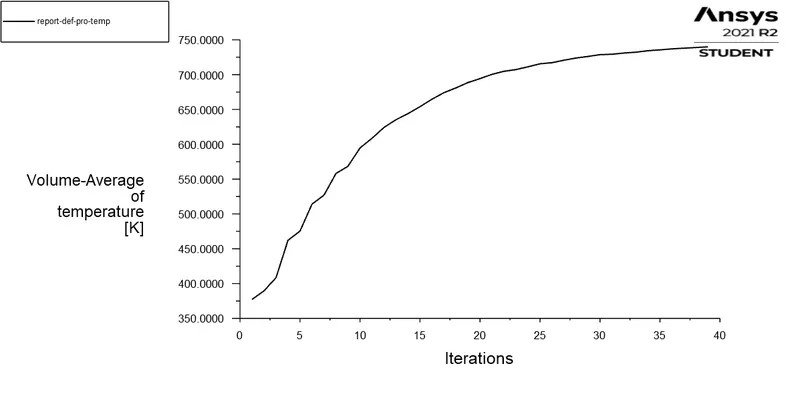
The maximum temperature attained by processor is 739.91K when the mesh is refined
- Temperature contour plot
Baseline Refined
The above plot shows the temperature distribution along the mid-plane. From the plot, it is clear that the baseline setup is not capturing the physics near the solid body boundaries because of the unrefined meshing which is further reflected in the solution. The solution has distorted data compared to the refined solutions and the refined plots give a smoother contour near the boundaries.
- Velocity contour
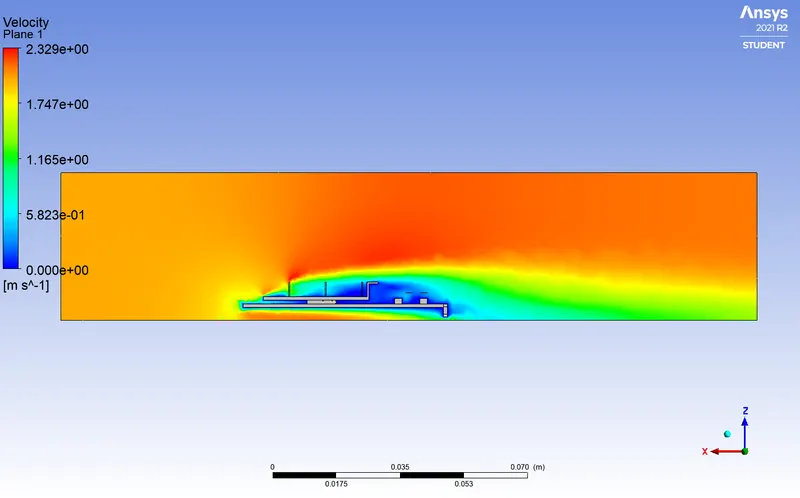
Baseline Refined
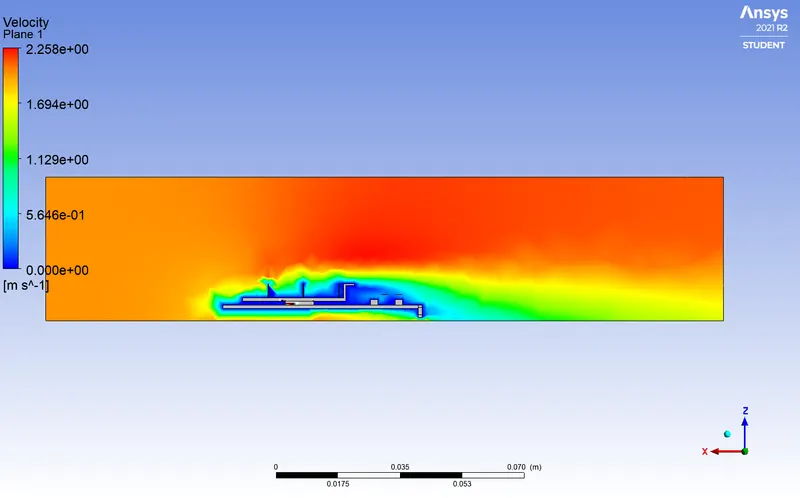
The above plot shows the flow velocity along the mid-plane. From the plot, it is clear that the baseline setup is not capturing the physics near the solid body boundaries because of the unrefined meshing which is further reflected in the solution. The solution has much-distorted data compared to the refined solutions and the refined plots give a smoother contour near the boundaries.
From the refined plot, we can observe a clear wake region just behind the fin flange. This further helps the graphics card to reduce the temperature on the fin by means of convection
- Vector plot
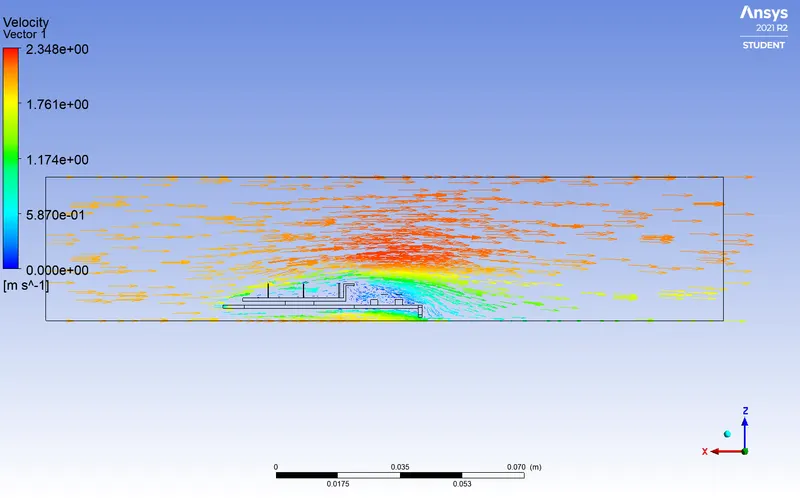
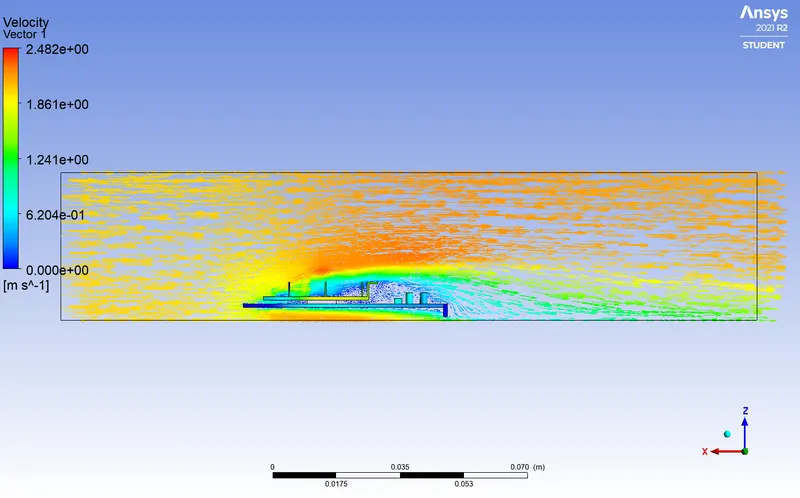
Baseline Refined
The vector plot further gives details about the wake region behind the fin. The details are more evident in the refined plot.
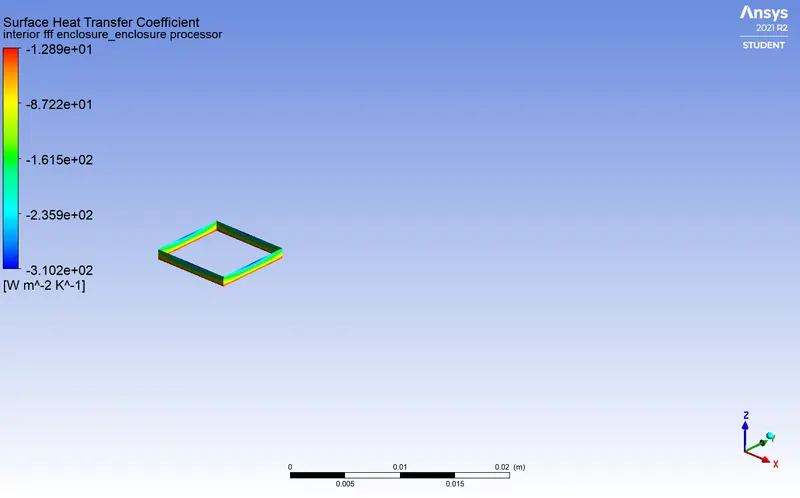
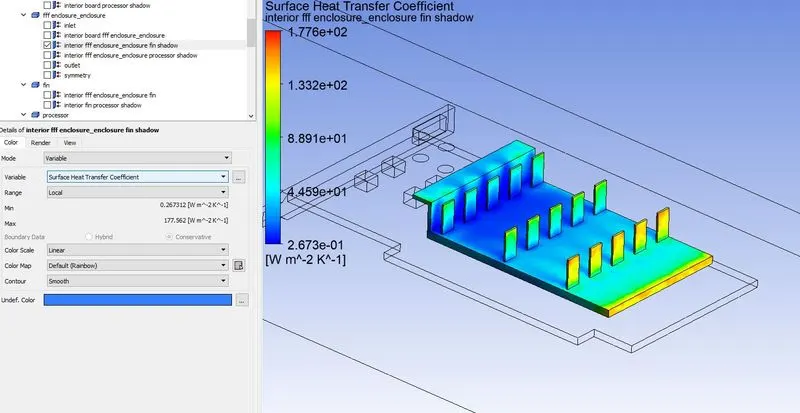
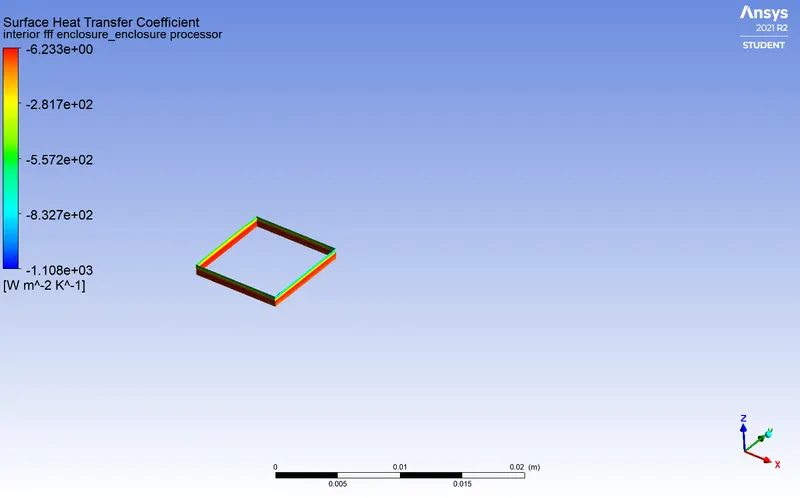
- Surface heat transfer coefficient on processor
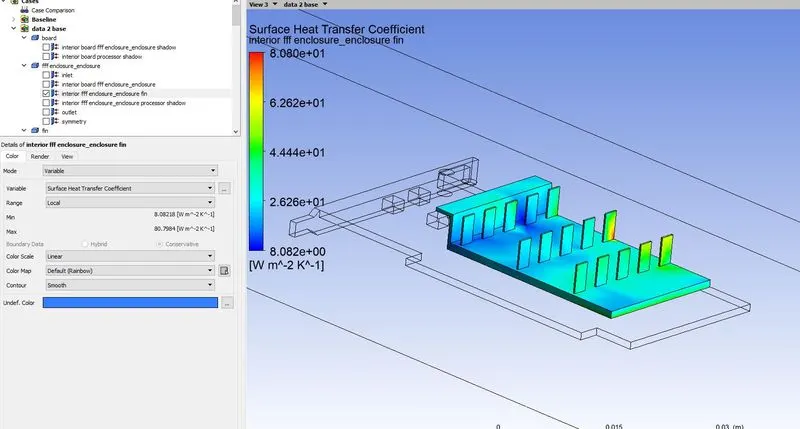
 Baseline
 Refined
The baseline gives a HTC of 310 max on the fin and the refined mesh gives a value of 1108 as HTC. There is a huge error in terms of HTC between baseline and refine mesh.
Since the baseline meshing is not providing accurate results we will be doing refined meshing for inlet velocity 3m/s and 5m/s
2. Solutions: inlet velocity is 3m/s & 5m/s
- Residual plot
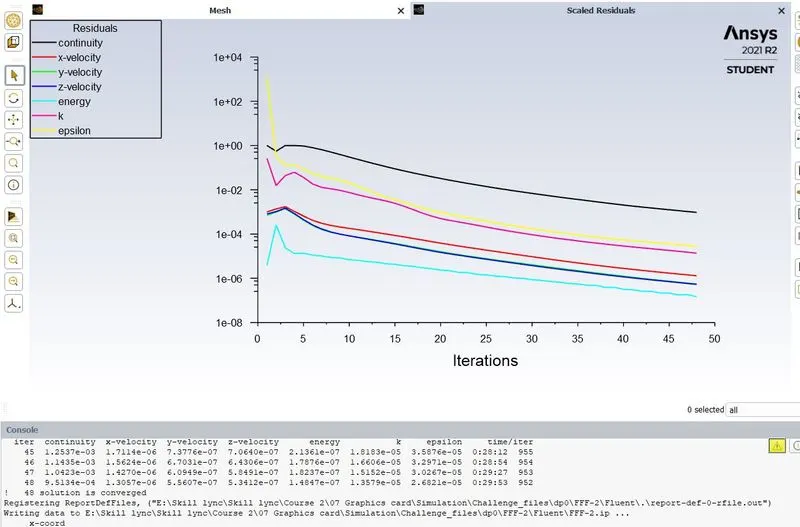
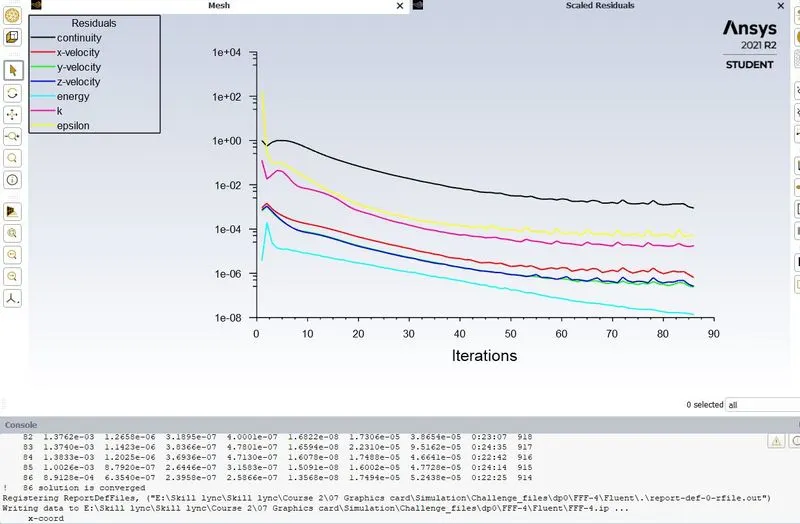
3m/s converged after 48 iterations. 5m/s converged after 86 iterations
- Temperature plot
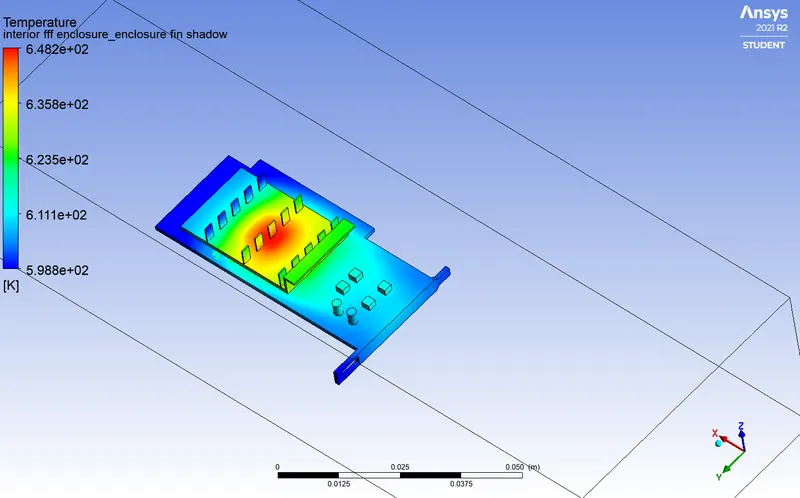
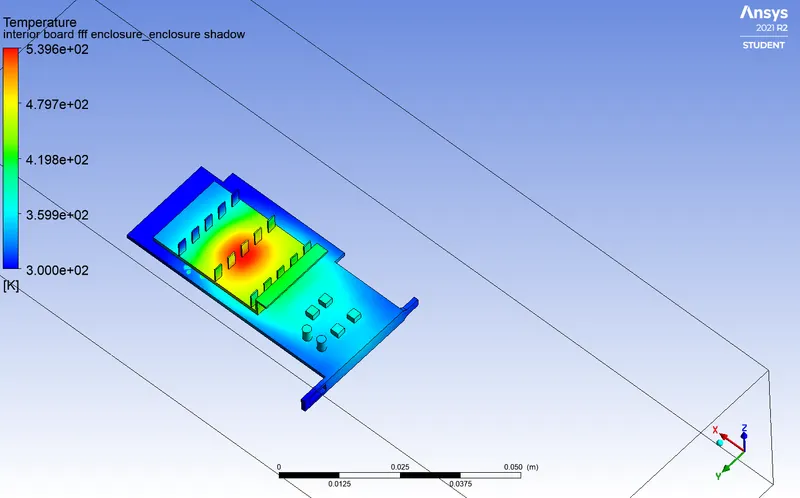
3 m/s 5m/s
The maximum temperature on the processor is 646.7K The maximum temperature on the processor is 560.57K
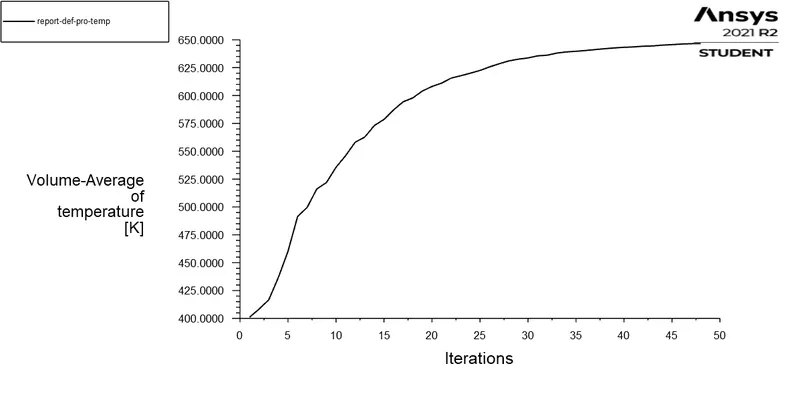
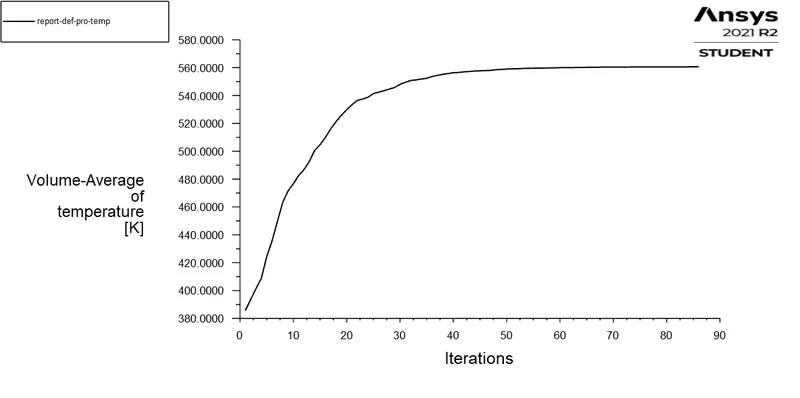
As the velocity is increased from 3m/s to 5m/s the temperature on the graphics card is also reduced.
- Temperature contour plot
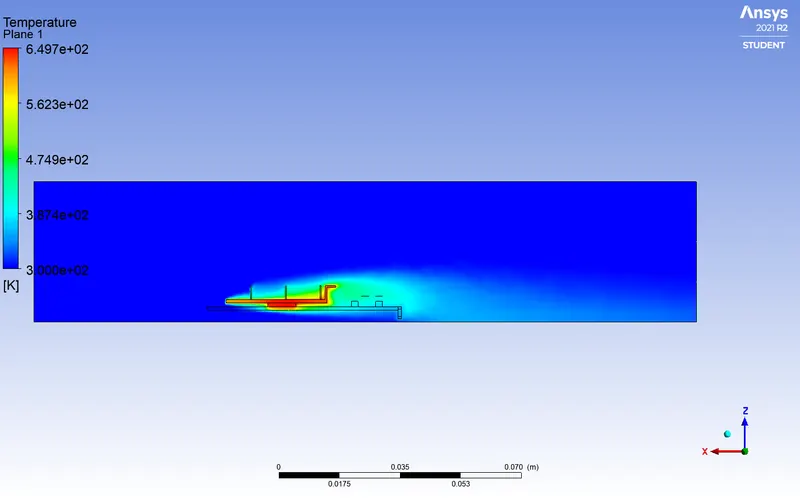
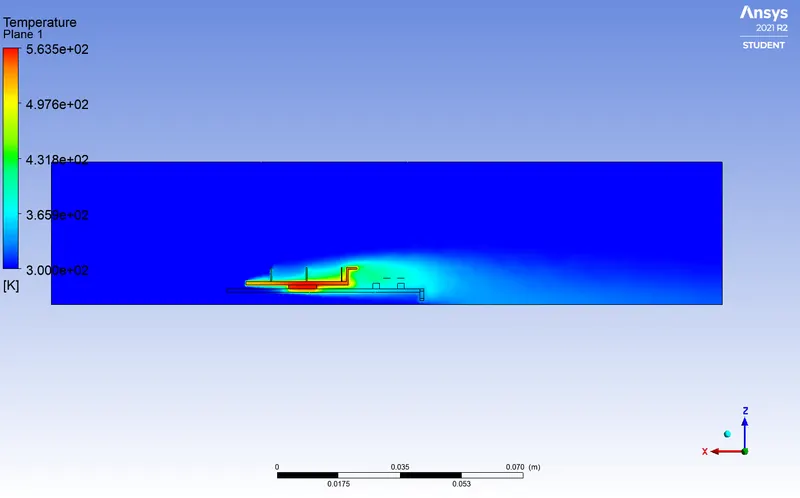
3 m/s 5m/s
- Velocity contour
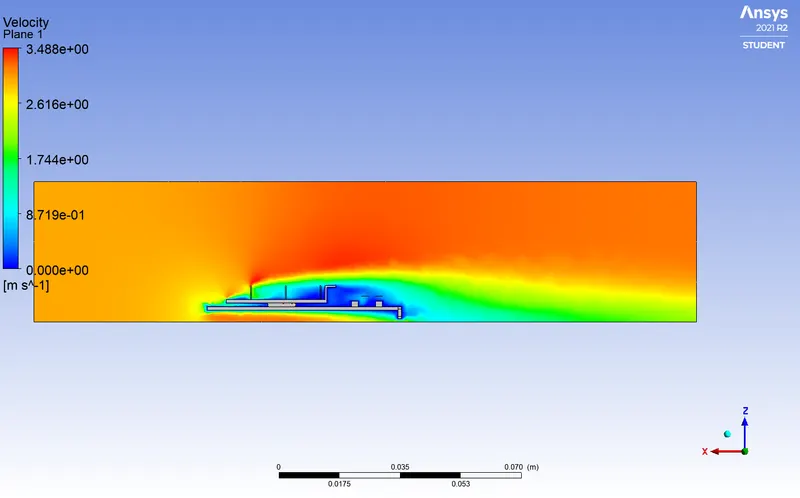
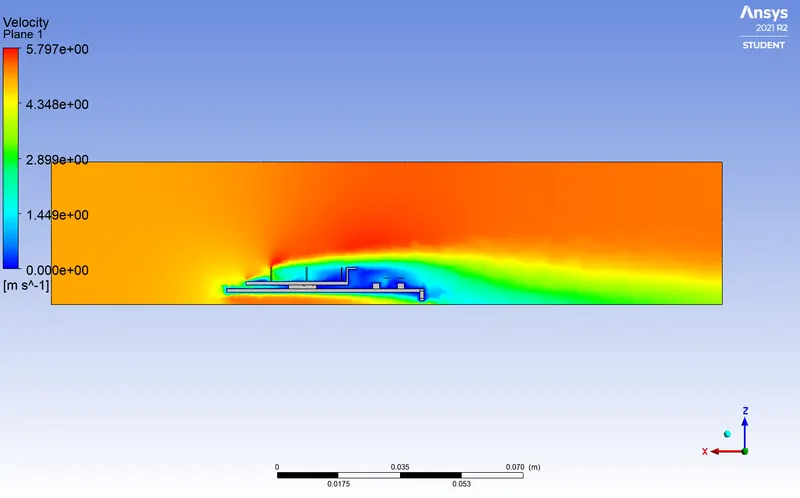
3 m/s 5m/s
- Vector plot
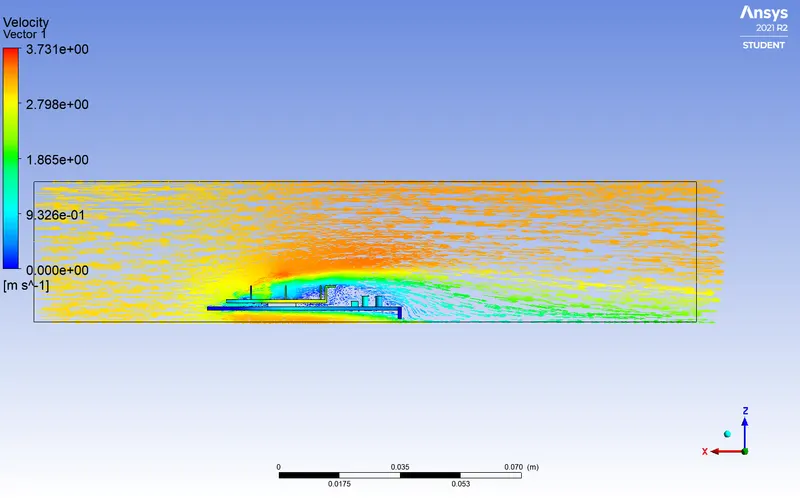
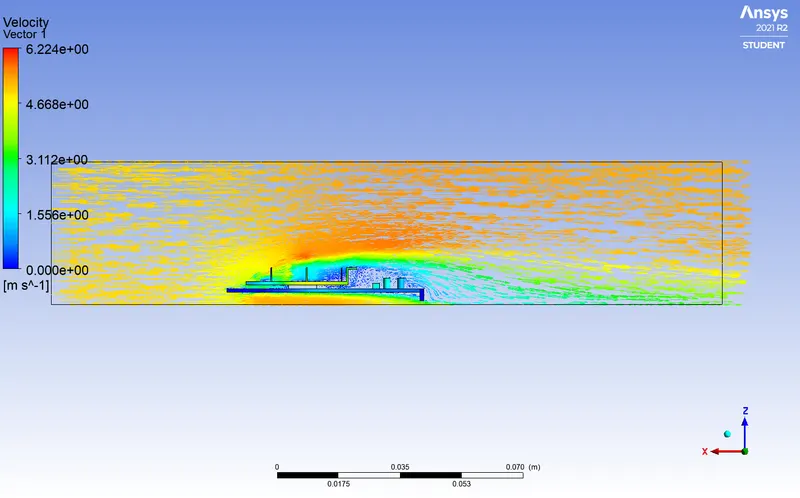
3 m/s 5m/s
- Surface heat transfer coefficient
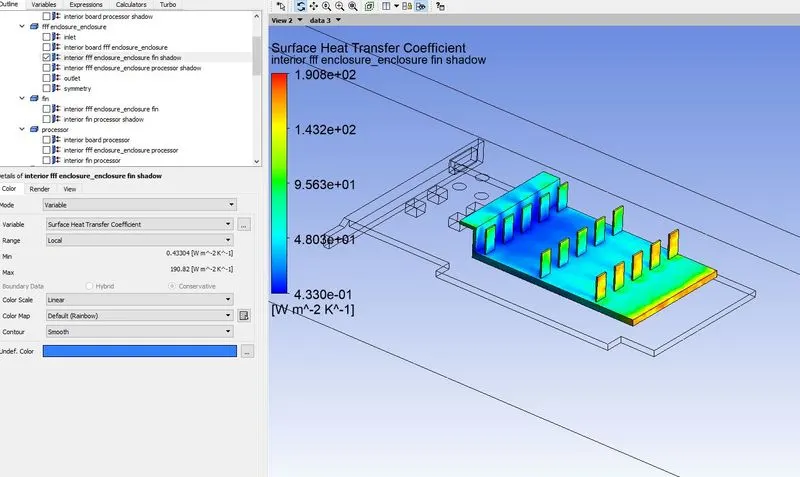
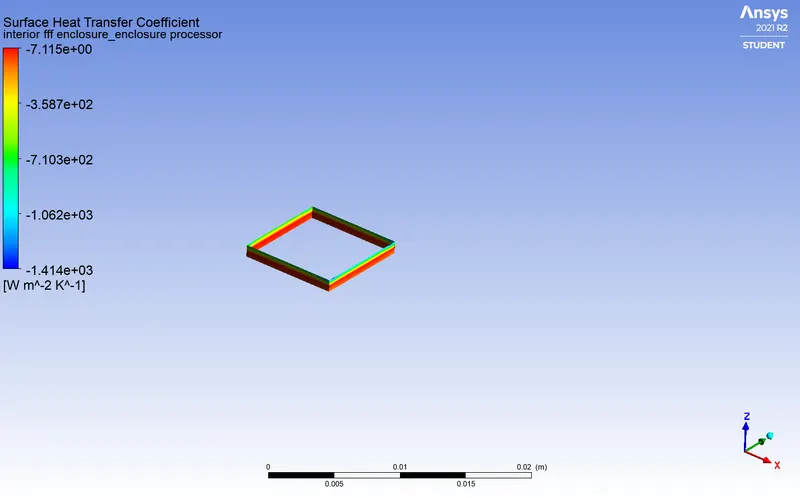
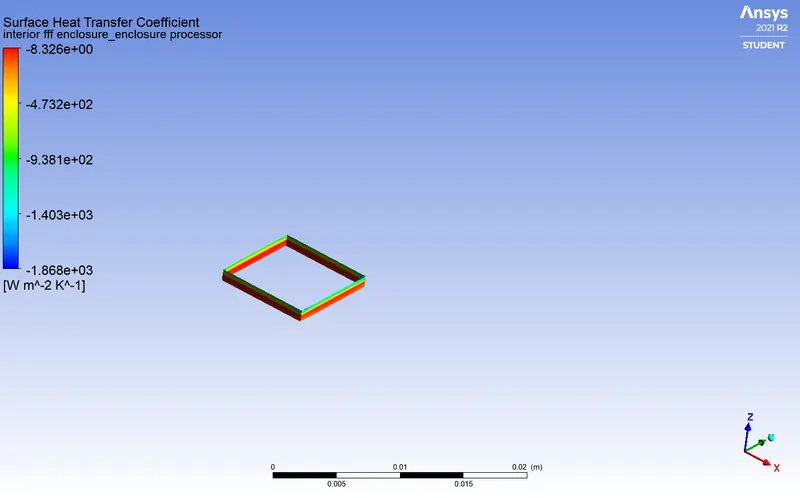
3 m/s 5m/s
Maximum HTC on fin = 1413 Maximum HTC on fin = 1867
The surface heat transfer rate on the processor is increasing as the inlet velocity is increasing. This helps us to reduce the temperature on the graphics card.
A consolidated test results are attached on the table.
- Potential hotspots
From the figures, it is clear that the area just above and below the processor are the potential hotspot regions. The middle area of the fin which is directly in contact with the processor is the major hotspot.
- Conclusions
From the above results, we can conclude the following things.
- The baseline meshing produced results that are far away from the original results. Hence we need to go for refined mesh for more accurate results.
- The temperature on the processor is getting reduced as the flow velocity increases.
- The heat transfer coefficient is increasing as the flow velocity increases. So we can say that as the flow velocity increases, the heat transfer coefficient increases, thereby heat transfer from the processor (also from fin) surface increases. Hence the temperature on the processor surface is less.