Week 5 - Rayleigh Taylor Instability
RAYLEIGH TAYLOR ANNALYSIS
AIM-To perform Rayleigh Taylor Model annalysis for 2 phase fluid consist of Air and water
RAYLEIGH TAYLOR WAVES
This is the uncertainity developed in interface where there are two fluids where the lighter one is placed below the heavier fluid in a 2d plane .The difference in the density of the two fluids and the affect of the gravity are the reason which effects the stabilty line between the two fluid resulting in the developement instability resulting in the movement of the lighter fluid above the heavier fluid which results in the developement of characteristic growth rate which depends on the density of the desnsity of the two liquids which was checked by the density ratio.
The other models based on RAYLEIGH TAYLOR instabilty are
Richtmyer–Meshkov instability (RMI) occurs when two fluids of different density are impulsively accelerated. Normally this is by the passage of shock wave. The development of the instability begins with small amplitude perturbations which initially grow linearly with time. This is followed by a nonlinear regime with bubbles appearing in the case of a light fluid penetrating a heavy fluid, and with spikes appearing in the case of a heavy fluid penetrating a light fluid. A chaotic regime eventually is reached and the two fluids mix and the variation are visible .
Plateau–Rayleigh instability often just called the Rayleigh instability, explains why and how a falling stream of fluid breaks up into smaller packets with the same volume but less surface area. It is related to the Rayleigh instability and is part of a greater branch of fluid dynamics concerned with fluid thread breakup. This fluid instability is exploited in the design of a particular type of ink jet printer whereby a jet of liquid is perturbed into a steady stream of droplets.The driving force of the Plateau–Rayleigh instability is that liquids, by virtue of their surface tension, tend to minimize their surface area.
Kelvin–Helmholtz instability is a fluid instability that occurs when there is velocity shear in a single continuous fluid or a velocity difference across the interface between two fluids . Kelvin-Helmholtz instabilities are visible in the atmosphere of planets and moons, such as in cloud formation on Earth or the red spot on Jupiter and clouds on Sun.
ATWOOD NUMBER
It is dimensionless unit represent by A which is used in fluid dynamics for the study of variation in 2 phase system and other types of system where two phases are involved with difference in the velocity .It represents the ration of the difference between the density of the two fluid to the average density of the system consiting of two phases
A=(D1-D2)/(D1+D2)
D1- density of heavier fluid,D2-density of lighter fluid
penetration distance of the heavy liquid bubbles in the lighter fluid is goverened by the equation
Agt^2,where t is time of analysis
ANALYSIS
Geometry
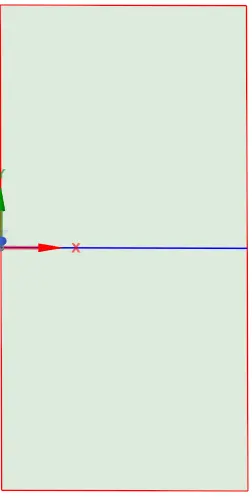
The 2d structure is generated consisting of 2 squares of 20X20 dimension in the XY plane .
Setup (common setup for all cases)
The initial solve used is laminar based solvent used under pressure based ,absolute,transient and we will 2d planar .
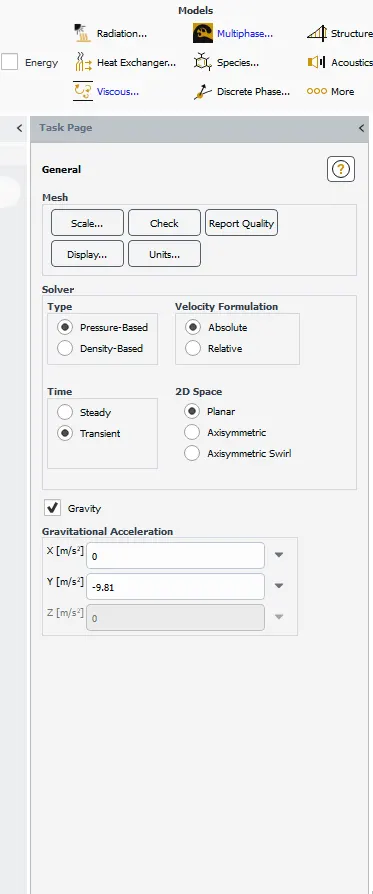
We will select gravity and assign negative sign to gravity in y direction that is 9.81 .
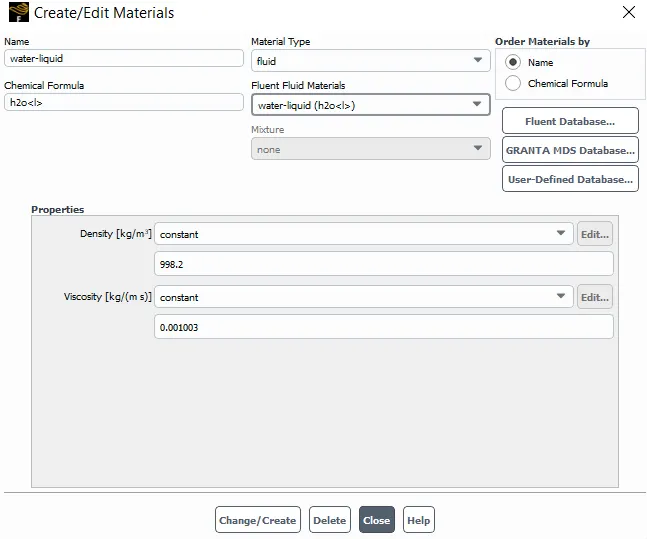
We will select air and water as the material for both the different phases.
Water= 998.2 Kg/m^3
Air =1.125 Kg/m^3
we will use volume based multiphysics after we will initialize the solution and we will use implicit type for solution for the annalysis
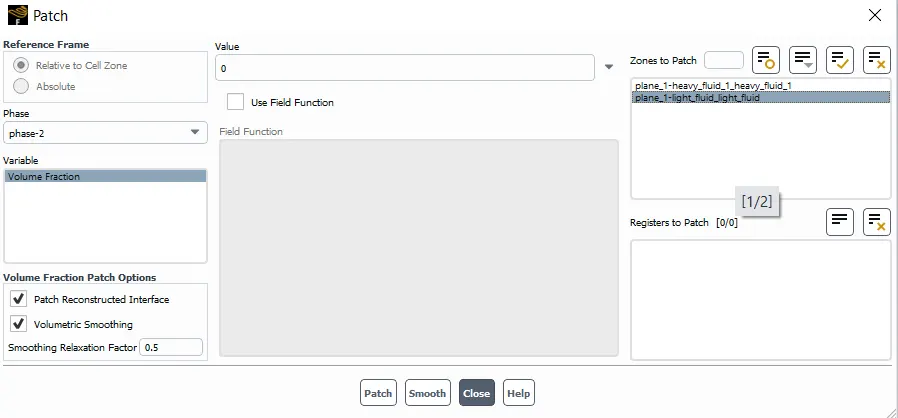
after general initialization we will alocate volume fraction to both the different phase, using patch command .
contour based on phases will be created and its animation is recorded and saved
Meshing based on the cases
Atwood number=0.99775
case 1 (Basic mesh)
meshing element size -0.5 mm
after the mesh is generated with the elements is 3200
annalysis results
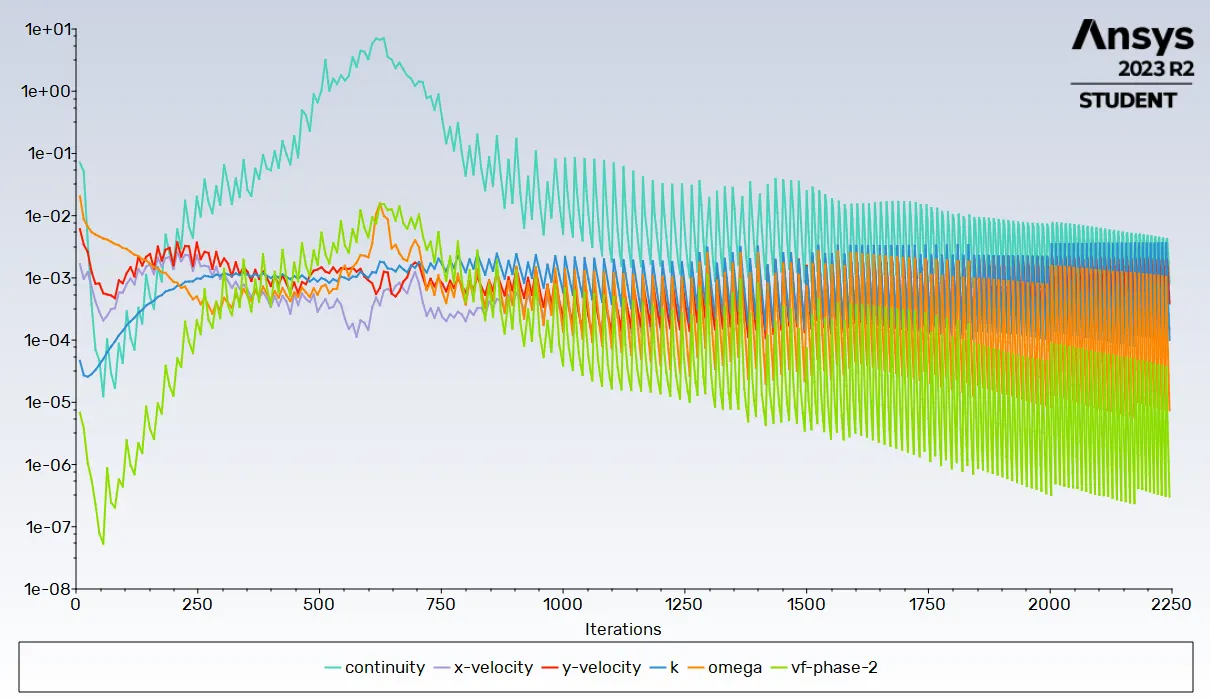
Video link of animation-https://drive.google.com/file/d/1RWtdKGl6i4bdDa4jJ8b7rjCNq81K9RbO/view?usp=drive_link
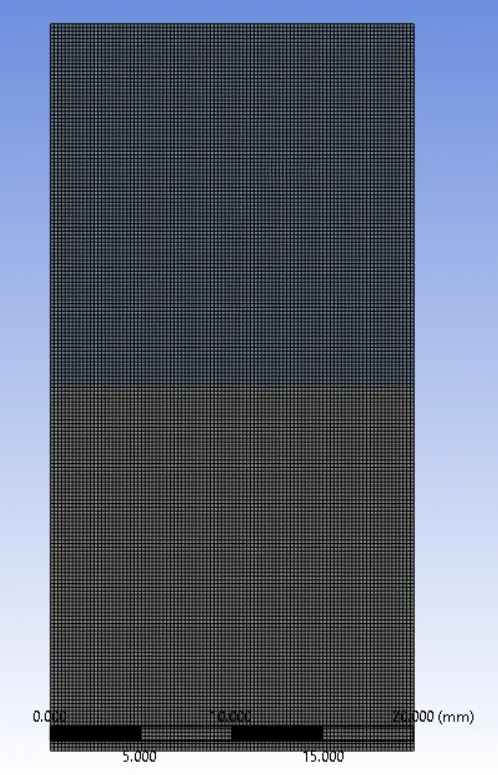
case 2 (refined mesh)
meshing element size -0.2mm
after the mesh is generated with the elements is 20000.
annalysis results
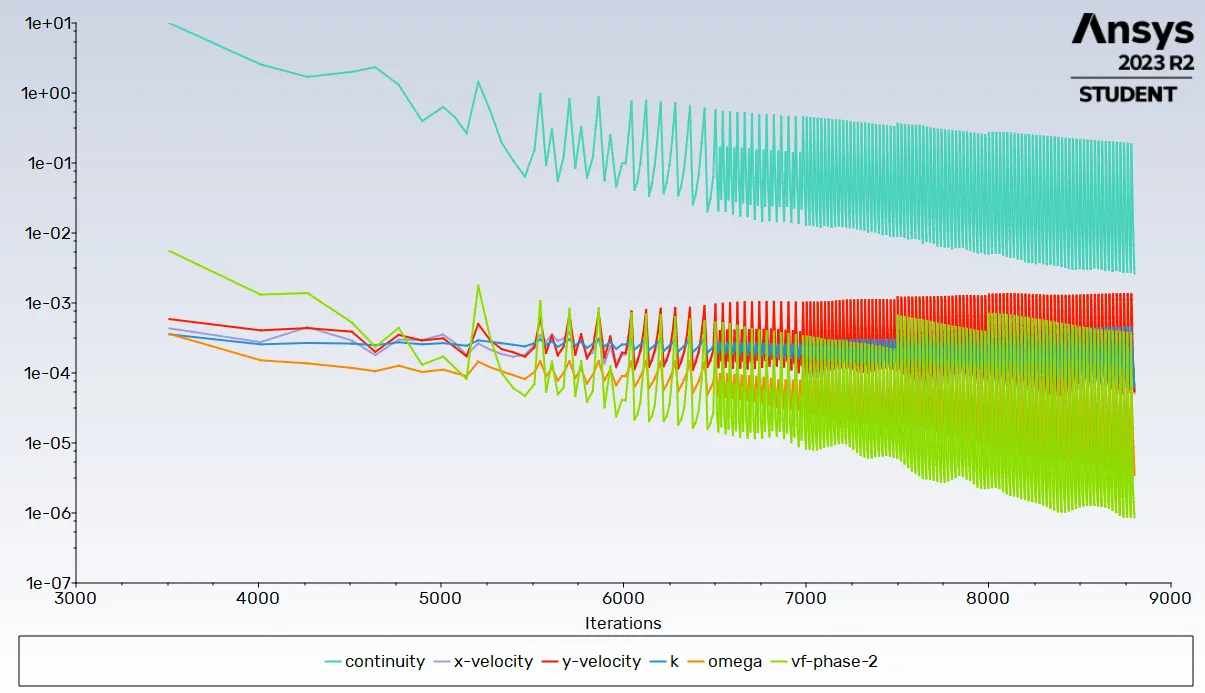
Video link -https://drive.google.com/file/d/1B8nftOW_7Eh_8l2z7FhbrIU2KE9BiW7p/view?usp=drive_link
Setup (for the new phases)
The initial setup is same but we are using different materials in this case which consits of
Water(initially used)
New fluid
Density= 400 Kg/m^3
Viscosity= 0.001 Kg/m s
Atwood number=0.4278
NOTE- As the liquid is ligther that the water we can assign this to the lower phase which previously consisted of Air as the medium
Case 1(Base Mesh)
mesh element size =0.5 mm
Analysis
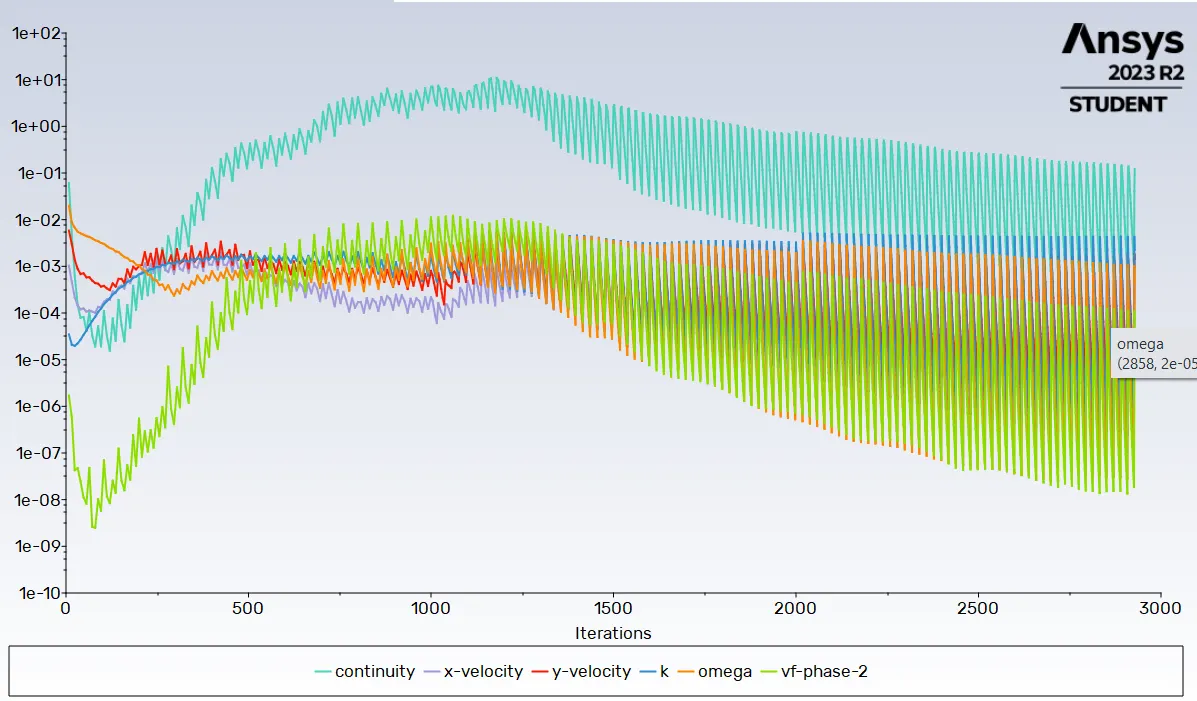
Video link-https://drive.google.com/file/d/1c6G5DblsaYGl5sQT-gDUq3KS8cQubfsI/view?usp=drive_link
Case 2 (refined mesh)
Mesh element size-0.2 mm
Analysis
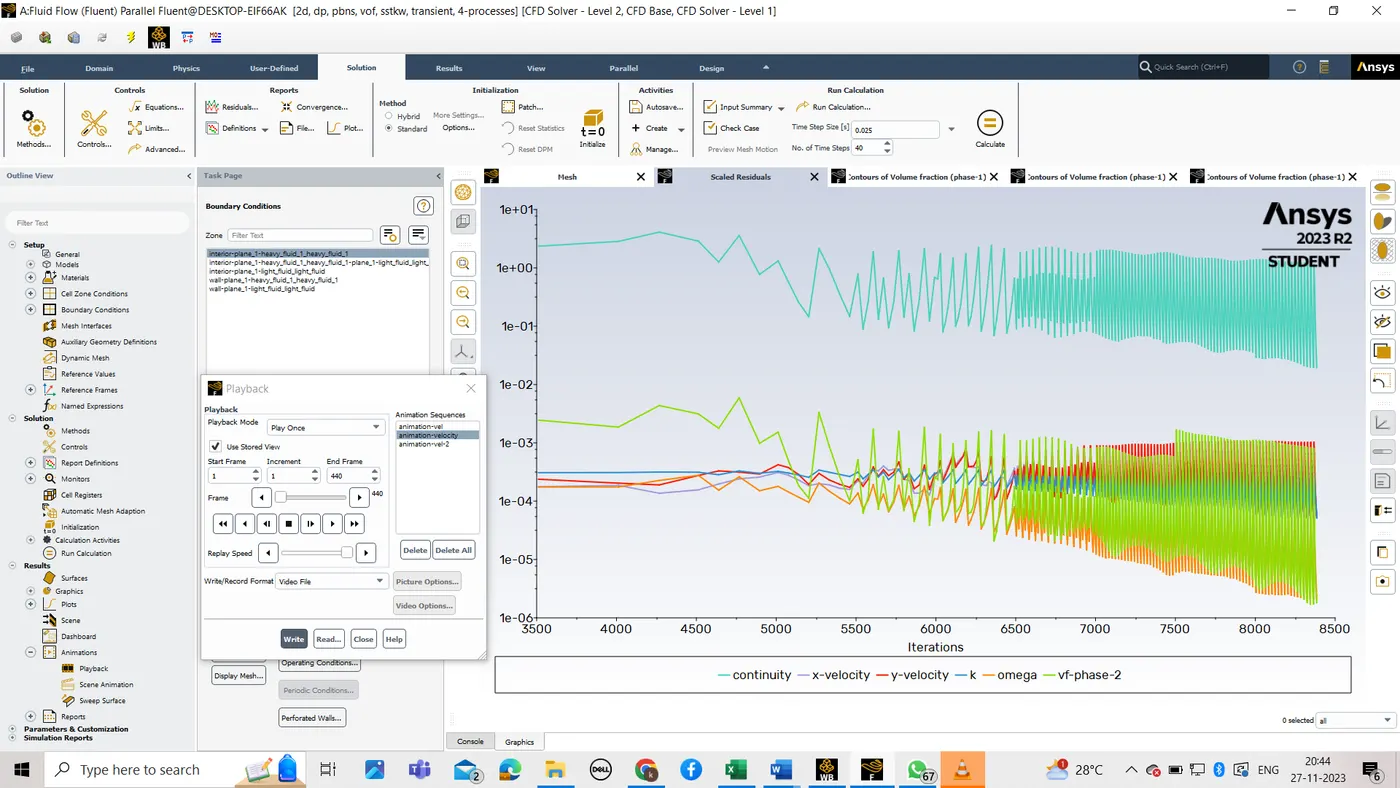
Video link -https://drive.google.com/file/d/1Ote2mYoZexbbZula7wlj6hOXJrxaqiuQ/view?usp=drive_link
RESULTS
The variations in the above conducted annalysis shows that the results generated depends largely on the two factors
1.Artwood Number
2.Mesh quality and sizw
1.ARTWOOD NUMBER
The variation in artwood number highly deternimes the instablity by affecting density stratification at lower artwood number resulting in small size buuble generation in the instability phase which effects the profile of the exchange of the volume fraction in the two phases ,With increasing artwood number density stratification is reduced which results in larger bublle formation in the instability with increase in thickness .
2.MESH SIZE AND QUALITY
It was observed that for the both the cases where annalyis was done in two sizes of element mesh that is 0.5 mm and 0.2 mm for the two sets of different mediums with different artwood number .
It was observed that the more the mesh element due to lower element size resulted in the way more better capturing of the instability than the mesh where we had the base meshing of 0.5 mm .It took a large amount of time and iteration for the capturing of the instability in the finner meshing were element size was 0.2mm
This shows better the mesh qualility results in a better quality of the instabilty which was generated was captured with high accuracy.
In the analysis the transient appraoch was used for the analysis because we had been generating the instablity data based on the time variation with the iteration as mentioned in above governing equation .Due to this reason steady state approach can not be used because it is not based on time variation results
CONCLUSION
By conducting this Analysis we came to know how the instability is generated in the 2 phase system for the rayleigh taylor instabilty where heavier material is placed in the above and lighter material is placed below and how artwood number affects the instability of the 2 phase region and developement of bubbles of different thickness.The importance of high refined mesh for the Analysis which captures the instability more precisely and makes the variation clear and visible
Folder link for all the animation results- https://drive.google.com/drive/folders/1bvyo39YjZrAnqwXqgAkjNiKQWP9LX9i2?usp=drive_link