Week 5 - Genetic Algorithm
AIM: To write a code in MATLAB to optimise the stalagmite function and find the global maxima of the function and also plot graphs for all 3 studies and for F maximum vs no. of iterations.
OBJECTIVES:
1.Write a code for the optimise the stalagmite function.
2.Plot graphs for all 3 studies and for F maximum vs no. of iterations.
3.the global maxima of the function.
PROCEDURE:
1.first i started writting the program with clear all,close all and clc to remove the all last program commands.
2. then i given the all the inputs for the optimise the stalagmite function.
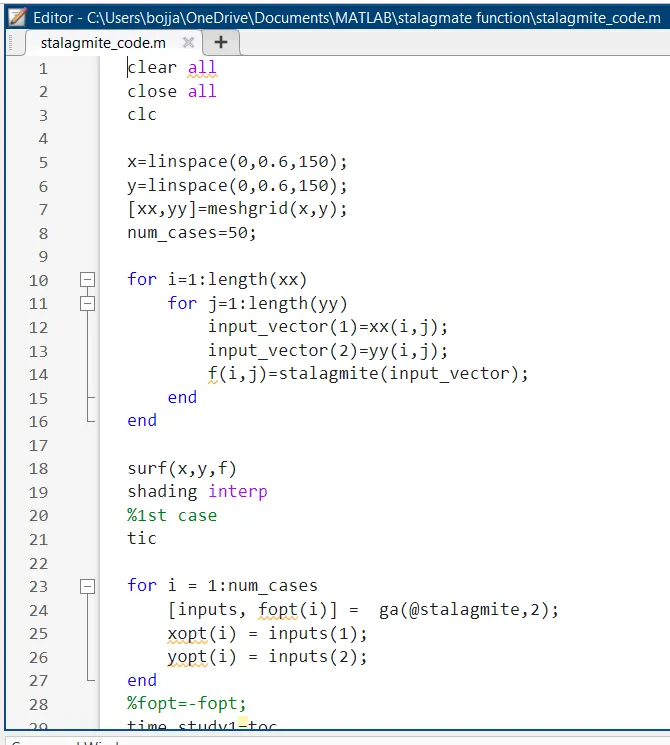
fig: main program part 1.
3.then i converted the 1D array into 3D array for that i used the "meshgrid" command for x and y.
4.then i started writting the for loop for "i" here i change for 1 to the xx. then another for loop is used for j is changed from 1 to yy.
5. then i given the input (1) is given by the xx is cahnge along the i and j. then for one value of i is change all the j value .
6.then i given the input (2) is given by the xx is cahnge along the i and j. then for one value of i is change all the j value .
7. then i given the variable f(i,j) is given by the "stalagmite" then i have given the for xx and yy the change of i nad j.then i end the both the for loops.
8.then i given the surface plot to the stalagmite type of plot. the plot is having the x, y and f. before runing the progran i went to write the function code.
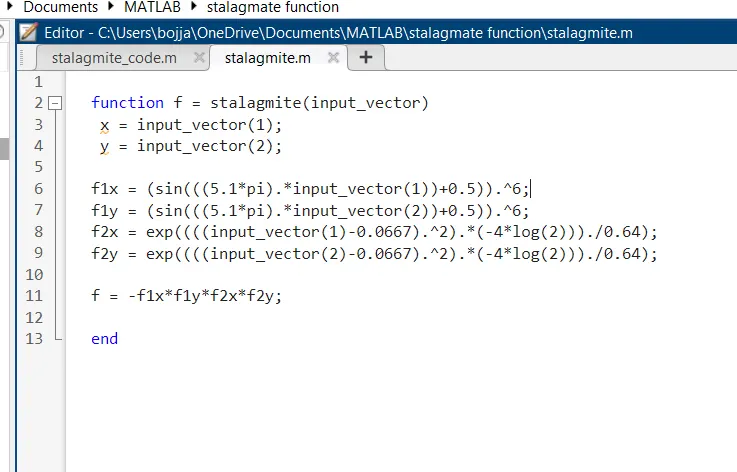
9. here i have given the input values are the input arregiments then i have writen the given equations in the varibles f1x, f1y,f2x and f2y. then i multplied the all f values and end the function coad.
CASE 1
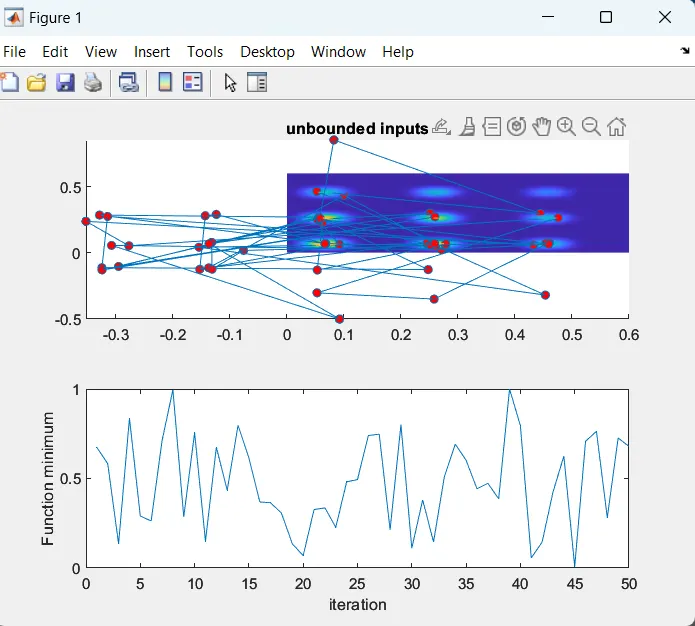
1. here the case 1 is the unbounded GA study. in this sudy the i value change along the change of the num_cases in the for loop.
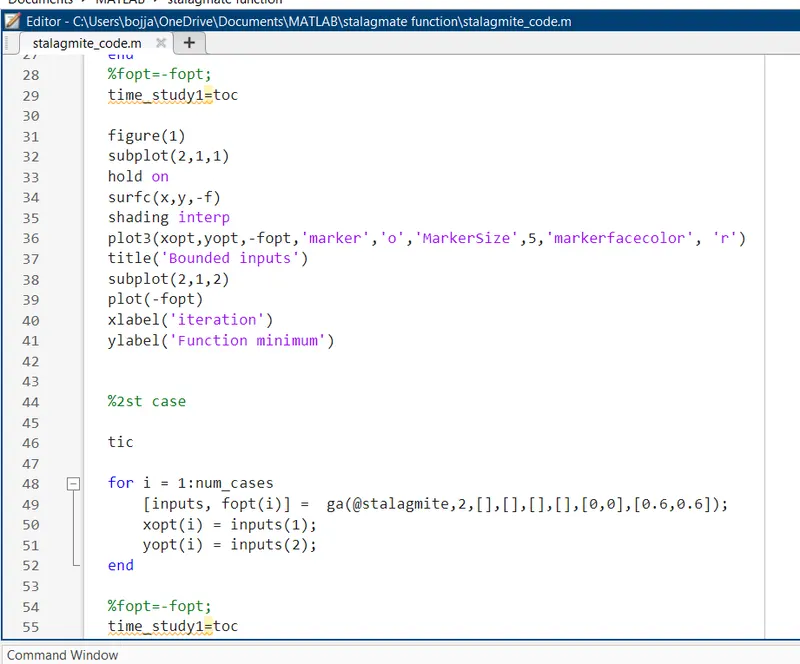
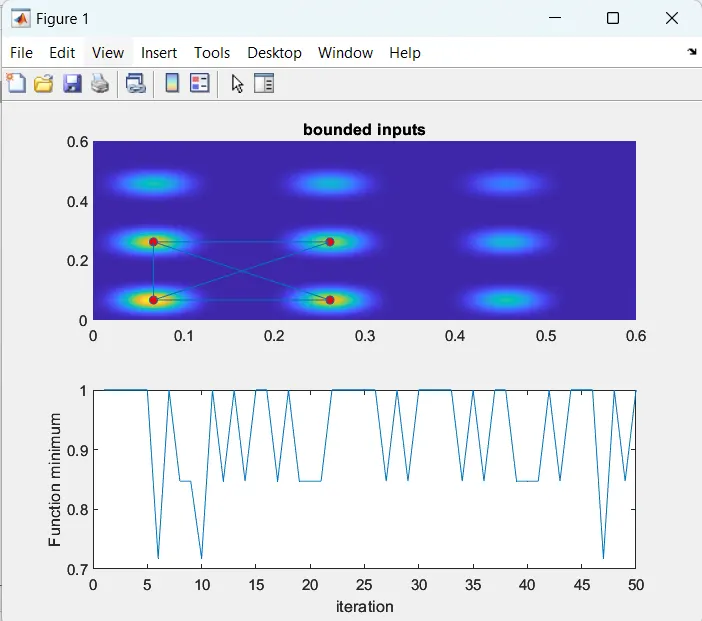
2. the empty bracket are the values not given in the program and options and other then this every thing is same like bounded study.
OUTPUT:
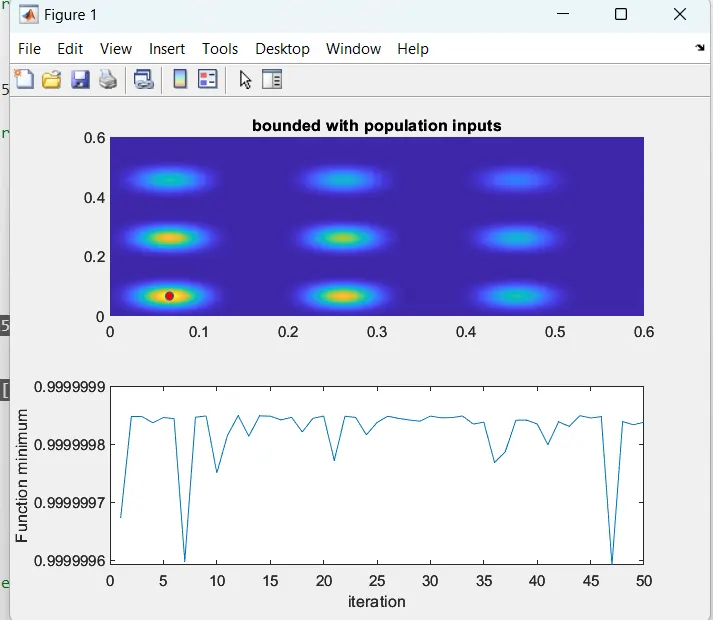
fig: bounded atudy with population size
1.here the optimum value is single value this study is accurcy.
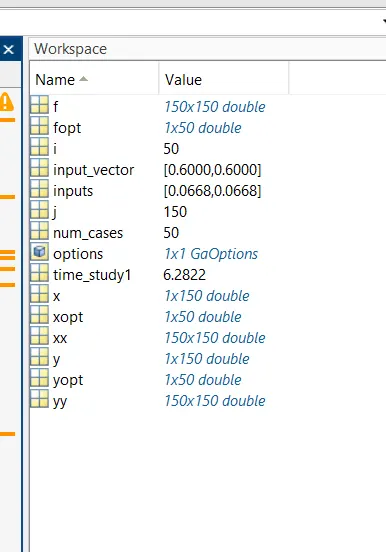
fig: all the output values.
ERRORS:
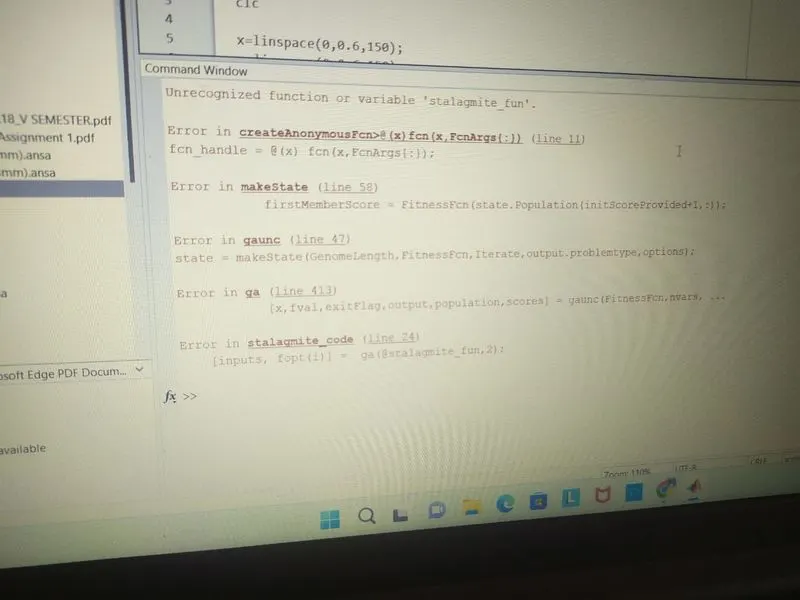
fig: function name error.
this figure is taken in the phone.
1. here the function name is different that i place in the program that is shown the error.
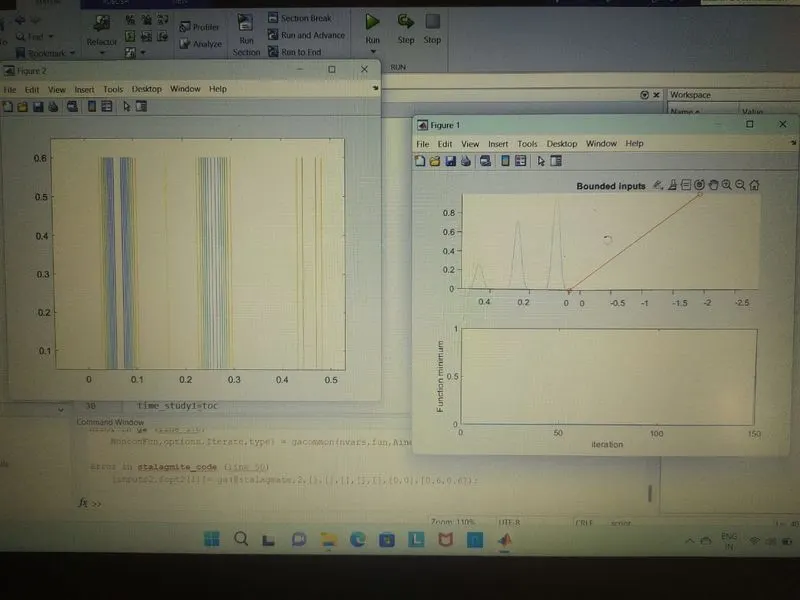
fig: this is the error i got due to the not mention the -ve in the plotting.
1. this error is got due to the not to mention -ve in the plotting fotp and -f in the program.
RESULT:
hence i write the program for all the case study of the bounded,unbounded and bounded with population size and global maxima is 6.1996.
CONCLUSION:
here i conclued that the bounded with the population size is the accurat function to fine the optimum value.