Week 5 - Curve fitting
Aim: To understand curve fitting using the Thermodynamic Data Set of Temperature and Specific Heat and answer the following questions.
1. What does popt and pcov mean?
2. What does np.array(temperature) do?
3. What does the * in *popt mean?
4. Write code to fit a linear and cubic polynomial for the Cp data. Explain if your results are good or bad.
5. What needs to be done in order to make the curve fit perfect?
Theory:
What is Curve Fitting?
Curve fitting is creating a mathematical model that has the nearest proximity to the real sets of data. Using curve fitting, we can create a functional relationship between the dataset and a mathematical function. It is a highly effective mathematical modelling methodology to understand various natural processes.
1. What does popt and pcov mean?
popt and pcov are arrays used to store values generated when the curve fit function is run. Curve fit function comes under the SCIPY library of python which is used to carry out the scientific analysis.
popt is an array which stores the value of the coefficients of the function obtained after performing the curve fit using the data set and a mathematical function.
pcov is a 2d array which contains the true variance(tells about the spread of the dataset around the mean value) and covariance(directional relationship between the two variables) of the variables stored in popt
2. What does np.array(temperature) do?
np.array comes under NUMPY Library which stands for Numerical Python which is basically used while working with array.
In this assignment of curve fitting the data set, np.array(temperature) stores the values of the temperature in an array and transfers it to the called out function variable to perform the specific task.
3. What does the * in *popt mean?
Used as *args, it is used to pass a variable number of arguments to a function, it is mostly used to pass a non-key argument and variable-length argument list.
In this assignment, popt contains the values of the coefficients of the mathematical equation obtained after performing the curve fit function. '*' in '*popt* helps to refer to the coefficients stored as an array in popt.
4. Write code to fit a linear and cubic polynomial for the Cp data. Explain if your results are good or bad.
The program to fit a linear polynomial function for the Cp data is as below,
import numpy as np
import matplotlib.pyplot as plt
from scipy.optimize import curve_fit

#Curve Fit Function
def func(t,a,b,c):
	return a*t +b

#Reading Thermodynamic Data File
def read_file():
	temperature=[]
	cp=[]
	for line in open('data','r'):
		values=line.split(',')
		temperature.append(float(values[0]))
		cp.append(float(values[1]))
	return[temperature,cp]

#Main Program
temperature,cp = read_file()
popt, pcov =curve_fit(func,temperature,cp)
fit_cp=func(np.array(temperature), *popt)

plt.plot(temperature,cp,color="blue",linewidth=3)
plt.plot(temperature,fit_cp,color="red",linewidth=3)
plt.legend(['Actual Data','Curve Fit'])
plt.xlabel('Temperature[K]')
plt.ylabel('Specific Heat')
plt.show()
The following curve is obtained on running the above code
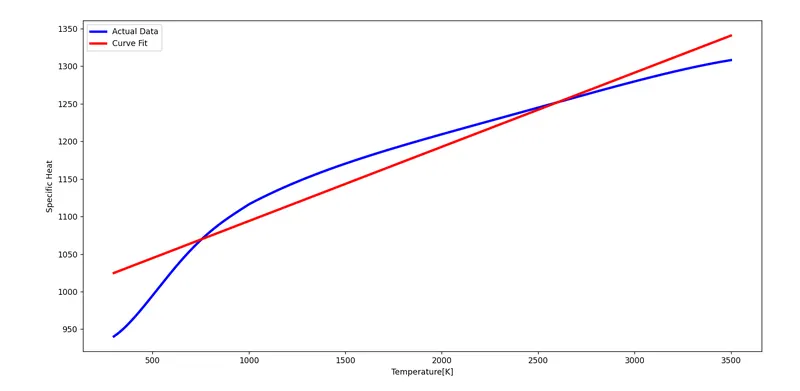
As is visible from the above curve, the new curve hardly fits the actual fit, this is because the actual fit is a plot of a polynomial with a higher degree and we were using a linear plot. Hence it is a bad fit for the dataset.
Now, the program to fit a cubic polynomial function for the Cp data is as below,
import numpy as np
import matplotlib.pyplot as plt
from scipy.optimize import curve_fit

#Curve Fit Function
def func(t,a,b,c,d):
	return a*pow(t,3) +b*pow(t,2) + c*t + d

#Reading Thermodynamic Data File
def read_file():
	temperature=[]
	cp=[]
	for line in open('data','r'):
		values=line.split(',')
		temperature.append(float(values[0]))
		cp.append(float(values[1]))
	return[temperature,cp]

#Main Program
temperature,cp = read_file()
popt, pcov =curve_fit(func,temperature,cp)
fit_cp=func(np.array(temperature), *popt)

plt.plot(temperature,cp,color="blue",linewidth=3)
plt.plot(temperature,fit_cp,color="red",linewidth=3)
plt.legend(['Actual Data','Curve Fit'])
plt.xlabel('Temperature[K]')
plt.ylabel('Specific Heat')
plt.show()
The following curve is obtained on running the above code
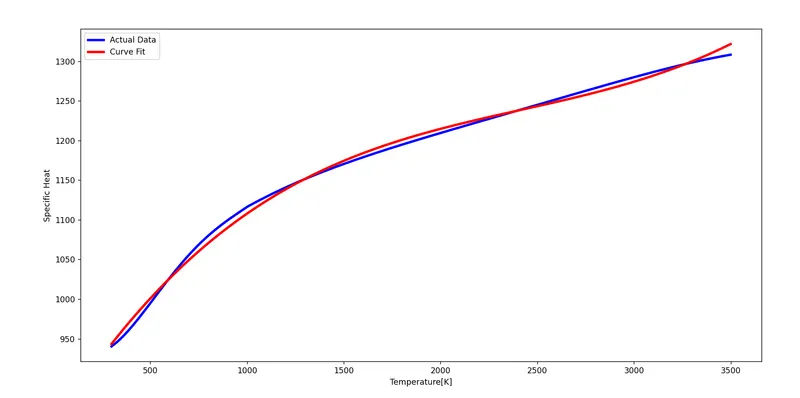
As is visible from the above curve, the new curve fits the actual fit mostly but is not fitting it perfectly. Still, this can be considered a better fit than the one obtained in a linear fit.
5. What needs to be done in order to make the curve fit perfect?
To make the curve fit better, let us try for higher degree polynomials.
Curve obtained for polynomial with degree 4,5 and 6 are are shown below
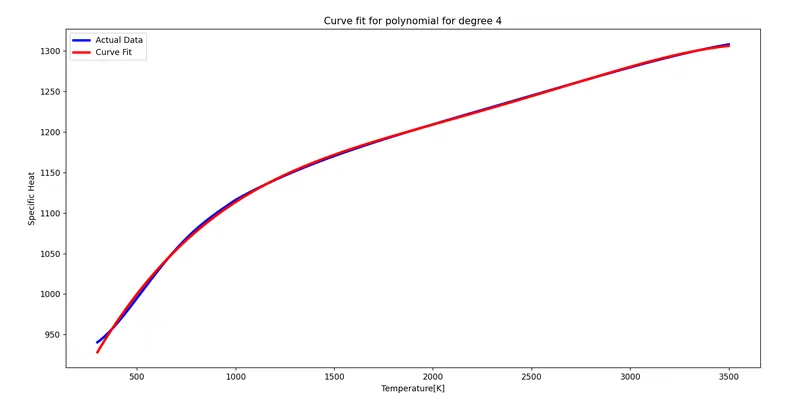
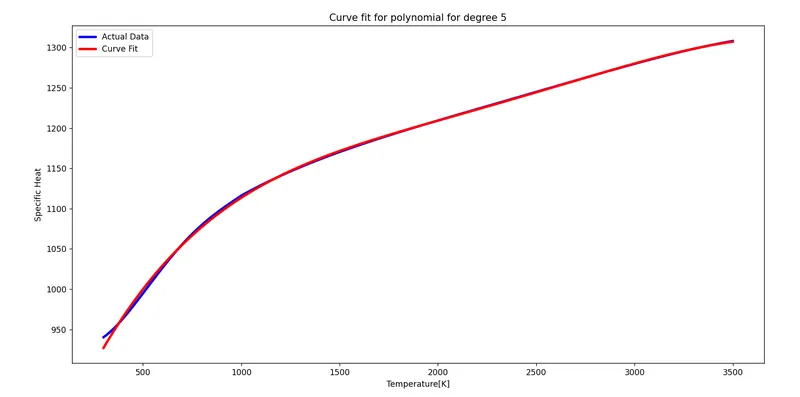
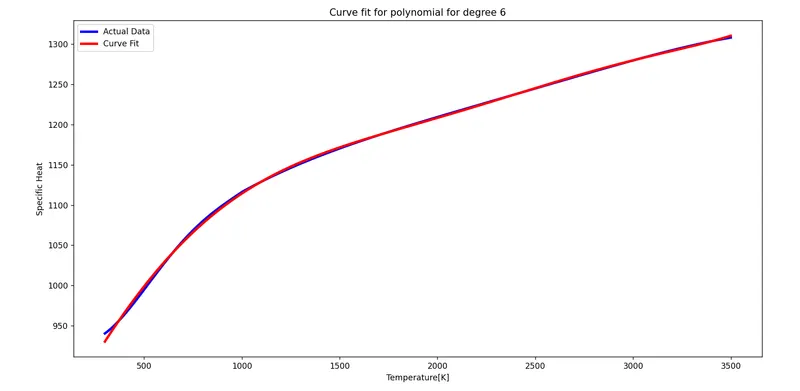
As visible from the above plots, it is visible that the curve fit comes to closer proximity with the actual fit with an increase in the degree of the polynomial function used as a mathematical model.
Conclusion:-
The aforementioned helps us to understand the Curve fit concept and answer the questions regarding curve fitting.