Week -2
Aim:
1. To make a simulink model of doorbell using a solenoid and plot the motion of plunger hitting the bell in every 2 seconds.
2. Use a thermistor to sense the temperature of a heater & turn on the fan if the temperature rises above 25 °C.
1. To make a simulink model of doorbell using a solenoid and plot the motion of plunger hitting the bell in every 2 seconds.
Theory: A solenoid is a type of electromagnet ( a coil of wire which is wrapped over a magnetic metal). When electric current is passed through the wire, according to Faraday's magnetic induction experiment, moving charges generate a magnetic field which works similar to the conventional magnet.
How does a conventional doorbell works?
As you can see in the circuit below,
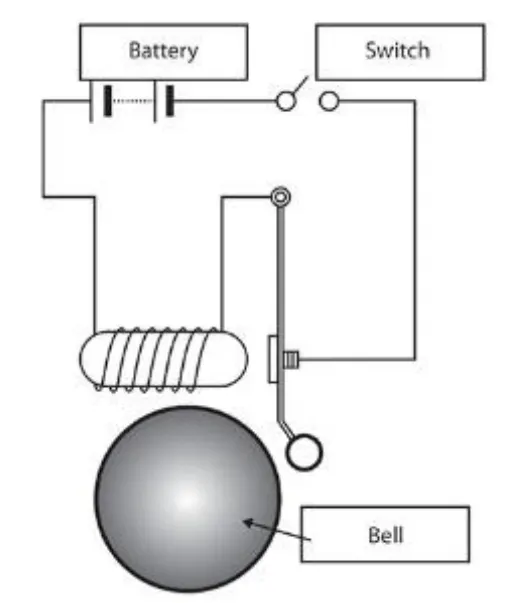
When the switch is pressed, the electric circuit forms a closed loop. Current passes through the solenoid via battery which generates a magnetic field around. This magnetic field is responsible to attract the plunger towards it which hits against the bell producing the doorbell sound we hear. As soon as the circuit is open, magnetic field vanishes and the plunger goes back to its zero or initial position.
Simulink Model:
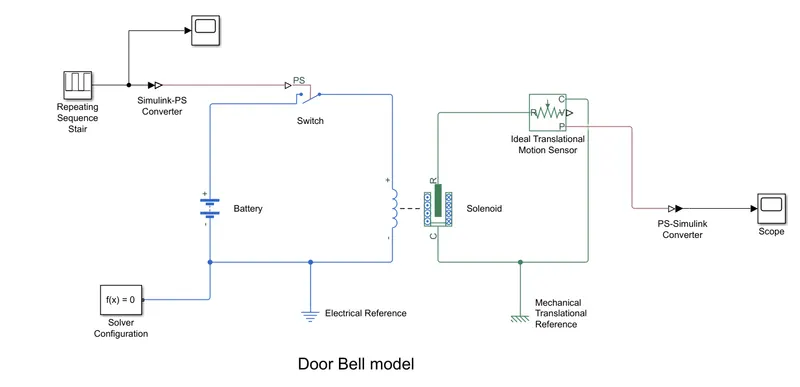
The Simulink Model will look like the one shown below,
The input signal is fed by Repeating sequence stair with following parameters,
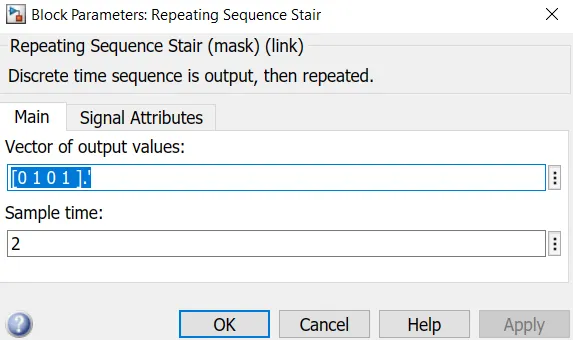
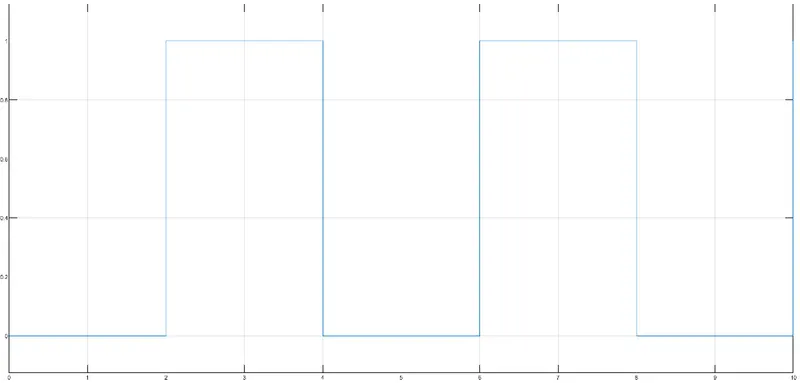
Switch is closed when the input value is greater than its threshold value i.e. 0.5 and open when less than its threshold value. With sample time 2 seconds, the switch is closed or opened every 2 seconds. The input plot is shown below,
Blocks used for this model are as follows:
1. Repeating Sequence Stair- It helps generate the signal to switch on after every 2 seconds.
2. Simulink to PS Convertor- It helps convert the input signal into physical system which the system can understand.
3. Switch- It closes circuit when the value provided by PS is more than the threshold value of the switch.
4. Battery- It is source for energy.
5. Solenoid- It represents the solenoid that generates the magnetic field
6. Ideal Translational Motion Sensor- It helps sense the motion of plunger and plot the position of the plunger with time.
7. Solver configuration- To solve the equation generated in the system.
8. Electrical and Mechanical Reference- It helps provide electrical ground and frame to the electrical and mechanical systems(circuits).
9. PS to Simulink Convertor- To convert the physical system at output to signal which can be plotted against time.
Result & Conclusion:
The ouput signal (Position of Plunger Vs Time) representing the motion of plunger is as below,
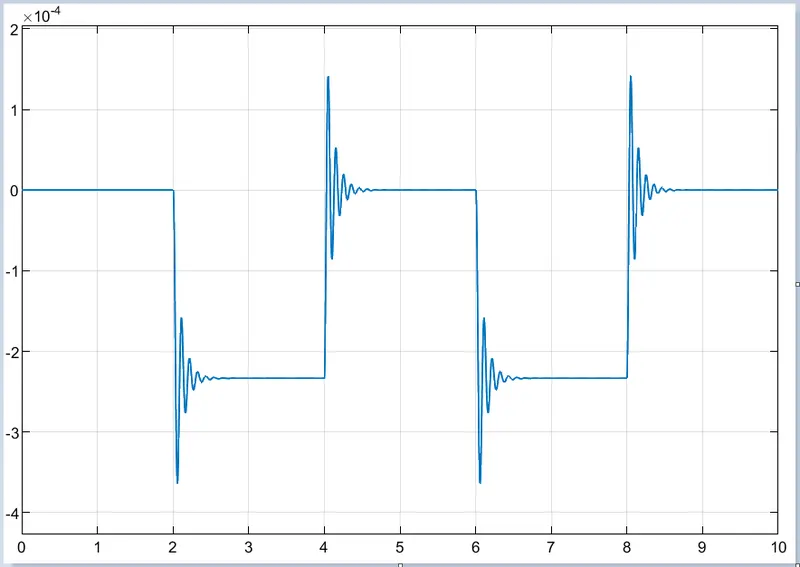
From the figure, we can understand that the plunger hits the bell and comes back to its zero position via damping with time.
2. Use a thermistor to sense the temperature of a heater & turn on the fan if the temperature rises above 25 °C.
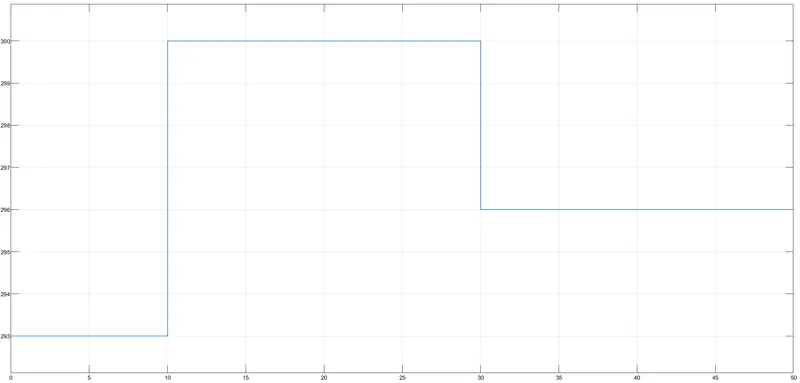
Condition: 293K from 0 to 10 seconds, 300K from 10 to 30 seconds, 296K from 30 to 50 seconds
Theory:
Thermistors are a type of thermal resistors whose resistance depends on the temperature. It detects the temperature and its resistance increases or decreases based on the temperature.
In this model, the thermistor is powered by a controlled temperature source which maintains specific temperature difference across the ports A and B. The input signal built in Signal builder is fed at port S which drives the energy source. The thermal resistance increases or decreases as per the output received from the Temperature source.
Simulink Model:
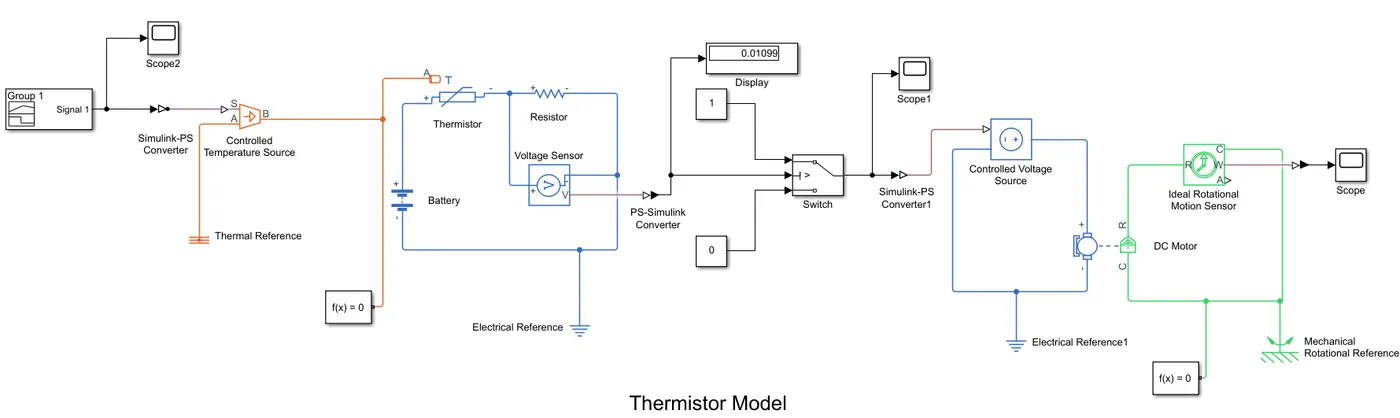
To detect the voltage at 298K ( i.e. 25 °C) above which the fan should operate, a voltage sensor is connected across the resistor which detects the value to be 0.01189V(threshold value for conditional switch) at 298 K. Now this is fed to the conditional switch as input which gives value 1(switch is closed) when this voltage is greater than this threshold value and 0(switch is open) when less than the threshold value.
The output from conditional switch is first converted into physical system and fed into the controlled voltage source which maintains specific voltage output regardless current passing through it. This voltage source drives the DC motor which ultimately drives the fan whose motion is sensed over by the Ideal Rotational Motion sensor and its output is plotted against time in the final scope.
The input signal (Y Vs Time) fed to the Controlled Temperature Source, here Y represents the temperature in Kelvin that is as follows,
Blocks used for this model are as follows:
1. Signal Builder
2. Controlled Temperature Source
3. Thermistor
4. Battery
5. Resistor
6. Voltage Sensor
7. Conditional Switch
8. Controlled Voltage Source
9. DC Motor
10. Ideal Rotational Motion Sensor
11. Simulink to PS Convertor
12. PS to Simulink Convertor
13. Scope
14. Electrical and Mechanical Reference
15. Solver Configuration
Result & Conclusion:
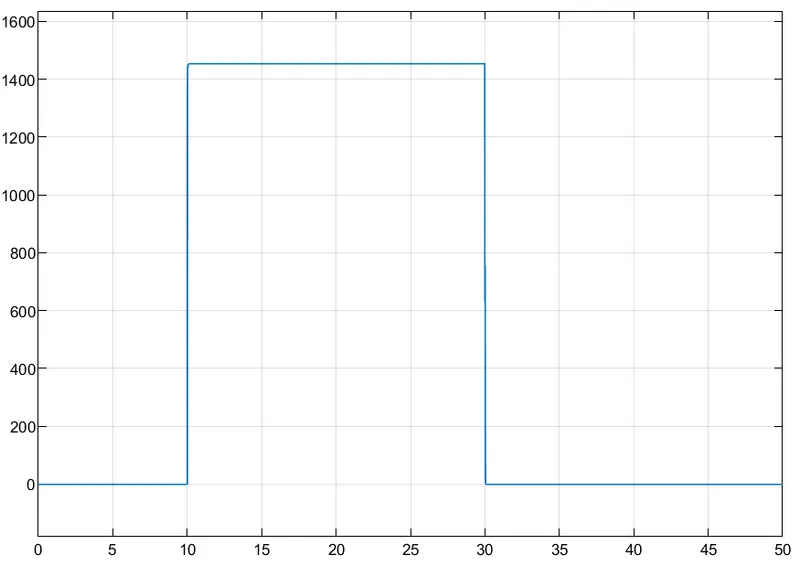
The Velocity vs Time of the Fan is plotted below, which shows the fan is running from 10 to 30 seconds when the temperature is above 25 °C and stops when the temperature is below 25 °C.
Simulink Files to the models