Project 1 - Parsing NASA thermodynamic data
Aim: To write a function that reads the NASA Thermodynamic file and perfoms following tasks,
1. Calculate the molecular weight of each species and display it in the command window.
2. Plot the Cp, Enthalpy and Entropy for the local temperature range (low temperature : high temperature) specific for each species by extracting all coefficients from the "Thermo.dat" file
3. Save the plots as images with appropriate names and dump them in separate folders for each species with suitable name. All these should be generated automatically.
Theory:
What is file parsing?
Parsing means to resolve a sentence into no. of components. File parsing can be defined as reading out the information given in a file, particularly a text file and using it to perform certain task using computational code.
The formula to calculate Specific Heat, Enthalpy and Entropy by extracting the coefficients from the file is as follows:

where R is the Universal Gas Constant.
Functions used to execute the File Parsing Project is as follows:
- feof- To test till end of file. it runs a file and returns 1 when the file ends.
- fopen- to open a file
- fgetl- To read the line in the file. Every time the function is called, it jumps and reads the next line.
- strsplit- To split a string at a specified delimiter
- strcmp- To compare strings
- findstr- To find string within another long string
The main code and explaination is as follows:
- Firslty, we open the file 'Thermo.dat' using function fopen.
- Then, we calculate the no. of species by using the function feof which runs till end of file using the while loop.
- Then we extract the global temperatures by reading the next line using the function fgetl.
- Using For loop, we extract all the coefficients first, then calculate Specific Heat, Enthalpy and Entropy, calculate molecular weight and display it in command window in every loop and finally plot "Cp vs T", "H vs T" and "S vs T" graphs and save it in folders as shown in the result.
- The logic behind extracting the coefficient is, we find the letter "E" which is in every coefficient and each coefficient ends in "E" plus 3 characters and next coefficient starts at 4th character from "E". And this logic goes on in every line.
clear all
close all
clc

% defining no. of species as nos equal to 0
nos=0;

%Universal Gas Constant
R=8.3145;

%to open the file
f1=fopen('THERMO.dat','r');


%To get no. of species using feof function in while loop
while ~feof(f1)
    A=fgetl(f1);
    B=strsplit(A,' ');
    L=length(B);

    if(strcmp(B(L),'1'))
        nos=nos+1;
    end

end

%To obtain gobal temperatures given in the Data file
f1=fopen('THERMO.dat','r');
fgetl(f1);
line_2=fgetl(f1);
C=findstr(line_2,'3');
g1=line_2(C:end);
g2=strsplit(g1,' ')

for i= 1: 3
    global_temp(i)=str2num(g2{i});
end


fgetl(f1);
fgetl(f1); %passing on to the next line
fgetl(f1);

%To extract the coefficients, calculate and plot and save, we run the loop
%until all species are covered
for i=1:nos
    tline1=fgetl(f1);
    species=strsplit(tline1,' '); %to extract species name
    species_name=species{1};
    pos=findstr(tline1,'G ')

    %To extract local temperature of species
    local_temp=tline1(pos:end)
    c2=strsplit(local_temp,' ')
    local_low_temp=str2num(c2{2});
    local_mid_temp=str2num(c2{3});
    local_high_temp=str2num(c2{4});

    %To extract coefficients of species
    tline2=fgetl(f1)
    c3=findstr(tline2,'E')
    a1=str2num(tline2(1:c3(1)+3));
    a2=str2num(tline2(c3(1)+4:c3(2)+3));
    a3=str2num(tline2(c3(2)+4:c3(3)+3));
    a4=str2num(tline2(c3(3)+4:c3(4)+3));
    a5=str2num(tline2(c3(4)+4:c3(5)+3));

    tline3=fgetl(f1)
    c4=findstr(tline3,'E')
    a6=str2num(tline3(1:c4(1)+3));
    a7=str2num(tline3(c4(1)+4:c4(2)+3));
    a8=str2num(tline3(c4(2)+4:c4(3)+3));
    a9=str2num(tline3(c4(3)+4:c4(4)+3));
    a10=str2num(tline3(c4(4)+4:c4(5)+3));

    tline4=fgetl(f1)
    c5=findstr(tline4,'E')
    a11=str2num(tline4(1:c5(1)+3));
    a12=str2num(tline4(c5(1)+4:c5(2)+3));
    a13=str2num(tline4(c5(2)+4:c5(3)+3));
    a14=str2num(tline4(c5(3)+4:c5(4)+3));
    mkdir (species_name);

   %To calculate Specific Heat, Enthalpy and Entropy for each species
   t_range=linspace(local_low_temp,local_high_temp,200);
   Cp=cp_calc(a1, a2, a3, a4, a5,a8, a9, a10, a11, a12, t_range,local_low_temp,local_mid_temp,local_high_temp);
   H=h_calc(a1, a2, a3, a4, a5,a6, a8, a9, a10, a11, a12,a13, t_range,local_low_temp,local_mid_temp,local_high_temp);
   S=s_calc(a1, a2, a3, a4, a5, a7, a8, a9, a10, a11, a12,a14, t_range,local_low_temp,local_mid_temp,local_high_temp);

   Molecular_wt=mol_wt(species_name);
   sprintf('%s %i',species_name,Molecular_wt)
   %disp(species_name);
   %disp(Molecular_wt);


   figure(1)
   plot(t_range, Cp);
   xlabel('Temperature');
   ylabel('Specific Heat');
   title('Specific Heat vs Temperature');

   figure(2)
   plot(t_range, H);
   xlabel('Temperature');
   ylabel('Enthalpy');
   title('Enthalpy vs Temperature');

   figure(3)
   plot(t_range, S);
   xlabel('Temperature');
   ylabel('Entropy');
   title('Entropy vs Temperature');

   cd (species_name);
   saveas(1,'Cp_plot','png');
   saveas(2,'H_plot','png');
   saveas(3,'S_plot','png');
   cd ..


end
The function to calculate Specific Heat:
function [cp] = cp_calc(a1, a2, a3, a4, a5, a8, a9, a10, a11, a12, t_range, tl, tm, th)

tmax=th;
tmid=tm;
tlow=tl;
R=8.315;

for i=1 : length(t_range)
    t=t_range(i);
    if(t>=tmid)&&(t<=tmax)
        cp(i)=(a1 + (a2*t) + (a3*(t^2)) + (a4*(t^3)) + a5*(t^4))*R;
    elseif(t<=tmid)&&(t>=tlow)
        cp(i)=(a8 + (a9*t) + (a10*(t^2)) + (a11*(t^3)) + a12*(t^4))*R;
    else
        disp('Not in range');
    end
end
The function to calculate Enthalpy:
function [h] = h_calc(a1, a2, a3, a4, a5, a6, a8, a9, a10, a11, a12,a13, t_range, tl, tm, th)

tmax=th;
tmid=tm;
tlow=tl;
R=8.315;

for i=1 : length(t_range)
    t=t_range(i);
    if(t>=tmid)&&(t<=tmax)
        h(i)=(a1 + ((a2*t)/2) + ((a3*(t^2))/3) + ((a4*(t^3))/4) + (a5*(t^4)/5) + (a6/t))*R*t;
    elseif(t<=tmid)&&(t>=tlow)
        h(i)=(a8 + ((a9*t)/2) + ((a10*(t^2))/3) + ((a11*(t^3))/4) + (a12*(t^4)/5) + (a13/t))*R*t;

    else
        disp('Not in range');
    end
end
The function to calculate Entropy:
function [s] = s_calc(a1, a2, a3, a4, a5,a7, a8, a9, a10, a11, a12,a14, t_range, tl, tm, th)

tmax=th;
tmid=tm;
tlow=tl;
R=8.315;

for i=1 : length(t_range)
    t=t_range(i);
    if(t>=tmid)&&(t<=tmax)
        s(i)=((a1*log(t)) + (a2*t) + ((a3*(t^2))/2) + ((a4*(t^3))/3) + (a5*(t^4)/4) + a7)*R;
    elseif(t<=tmid)&&(t>=tlow)
        s(i)=((a8*log(t)) + (a9*t) + ((a10*(t^2))/2) + ((a11*(t^3))/3) + (a12*(t^4)/4) + a14)*R;

    else
        disp('Not in range');
    end
end
The function for calculating molecular weight:
The logic behind is, for each element in species name, the j loop runs and adds the atomic weight to 0. In case the species name repeats an element, c stores the value and then calculates and adds as shown.
For eg: H2
For first H, atomic weight 1 is added to molecular weight i.e. 0 which equals 1.
Then we convert string to number and store in n. if n is greater than 1 which in this case is 2, it multiplies the same j element atomic weight with (n-1) since it is already added one time which finally gives the molecular weight which is 2.
function molecular_wt = mol_wt(species_name)
element={'A', 'H', 'O', 'C', 'N'};
atm_wt=[40,1,16,12,14];
molecular_wt=0;
for i = 1 : length(species_name)

    for j=1:length(atm_wt)
   if (strcmp(species_name(i),element{j}))
       molecular_wt=molecular_wt+atm_wt(j);
       c=j;
   end
    end
    n=str2num(species_name(i));
    if n>1
     molecular_wt=molecular_wt+atm_wt(c)*(n-1);

end
end
The folder for elements for storing plots:

The plots inside folders is saved as shown below:
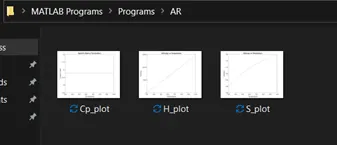
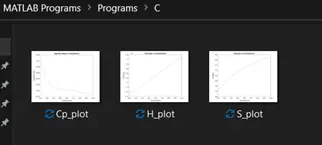
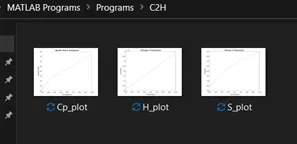
The plots for species C2H:
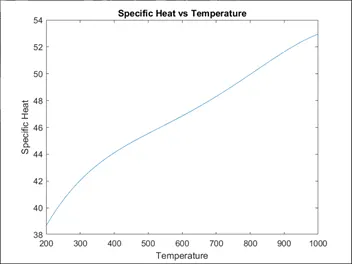
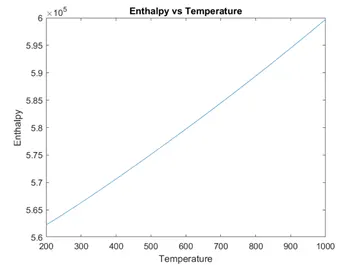
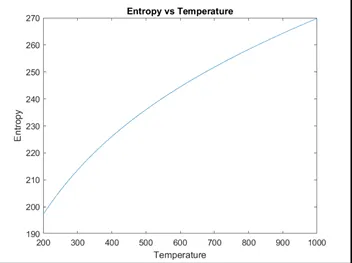
And similarly for all species the plots are generated and saved as shown in above snapshot.
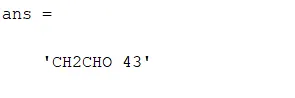
The molecular weight for each species is calculated and displayed on command window with each loop simultaneously.
Conclusion:
Therefore, the code reads, extracts the coefficients from the file and performs task as shown above.