Week 5 Challenge
AIM OF THE EXPERIMENT:-
To determine wind load acting on the bridge and perform analysis in Staad Pro.
THEORY:-
Basic Wind Speed is based on peak gust velocity averaged over a short time interval of about 3s and corresponds to mean heights above ground level in an open terrain
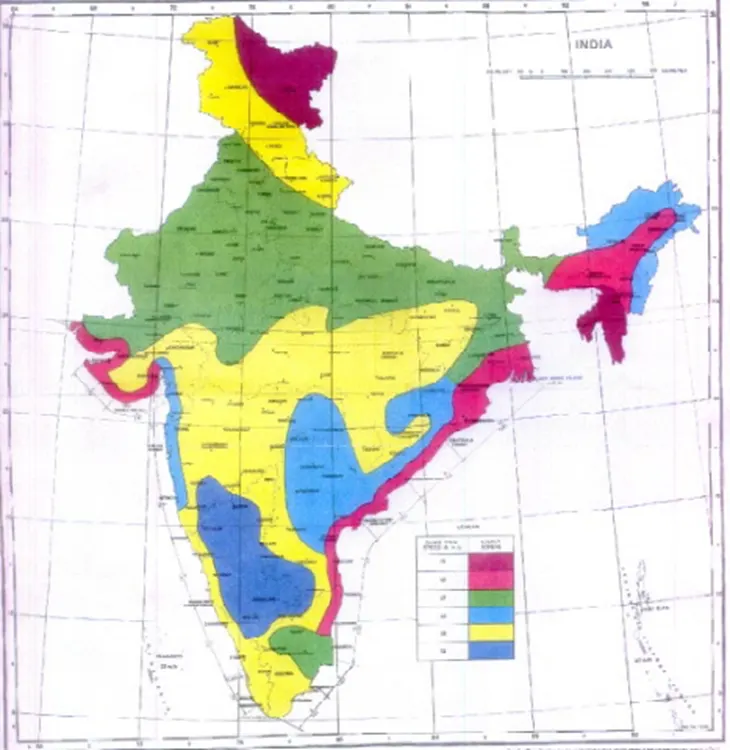
Figure 1 gives basic wind speed map of India, as applicable to 10m height above mean ground level for different zones of the country
Design Wind Speed can be calculated as per IS 875:2015 (Part 3); cl 6.3
Vz = Vb x K1 x K2 x K3 x K4
where,
Vb = Basic Wind Speed
K1 = Risk Coefficient
K2 = Terrain, Height Factor
K3 = Topography Factor
K4 = Importance Factor for Cyclonic Region
DATA GIVEN:-
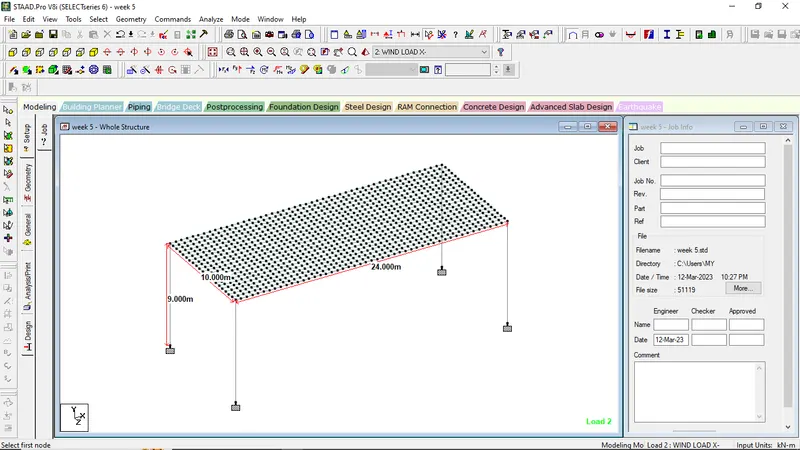
Height of bridge above ground level = 9m.
Location = Open terrain with well scattered obstructions of height less than 10m.
Pier size = 1.5m x 1.5m
Site = Mumbai
Size of Girder beam = I Girder
Size of Cross Beam = 1m x 1m
Thickness of deck sheet = 0.3 m = 300 mm
Since, the height of the bridge is 9m it is asumed that the overall height is 10m for determining the wind loads
Procedure:
Basic Wind Speed (Vb) = 44 m/s
K1 = 1.0
Since location is open terrain with well scattered obstructions having heights generally between 1.5m and 10m. So, assumed Category 2 and Height Z = 10m, then K2 = 1.0
K3 = 1.0 [Topographical faction is less than 3o]
K4 = 1.3 [Refer cl 6.3.4 of IS 875:2015 (Part 3)]
Vz = K1 x K2 x K3 x K4 x Vb = 1 x 1 x 1 x 1.3 x 44 = 57.2 m/s
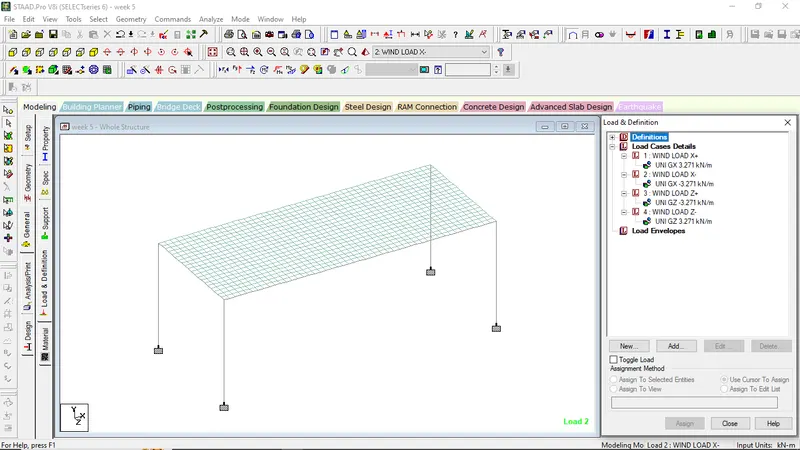
Pz = 0.6 x Vz2 = 0.6 x (57.2)2 = 3.271kn/m^2
MODELLING AND ANALYSIS IN STAAD PRO.
STEP 1:-
Model the Bridge as per dimension
STEP 2:-
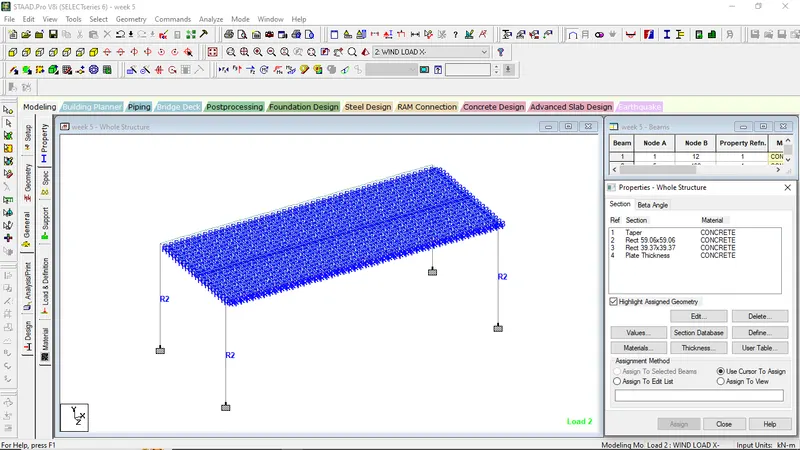
- Give the section property in the model
- deck slab-300mm plate
- Main Girder- I girder
- Cross Beam-1m x 1m
- Pier-1.5m x 1.5m
STEP 3:-
Give the loading value as per the calculated Pz value
STEP 4:-
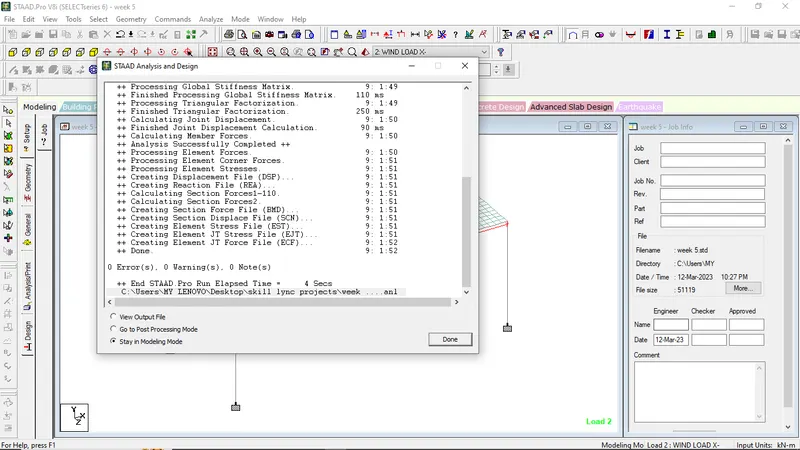
- Analyze the structure
- go to analysis and print
- select no print
- go to analyze menu bar, select run analysis
STEP 5:-
Go to the Post Processing mode to find out the maximum displacement, bending moment and shear force
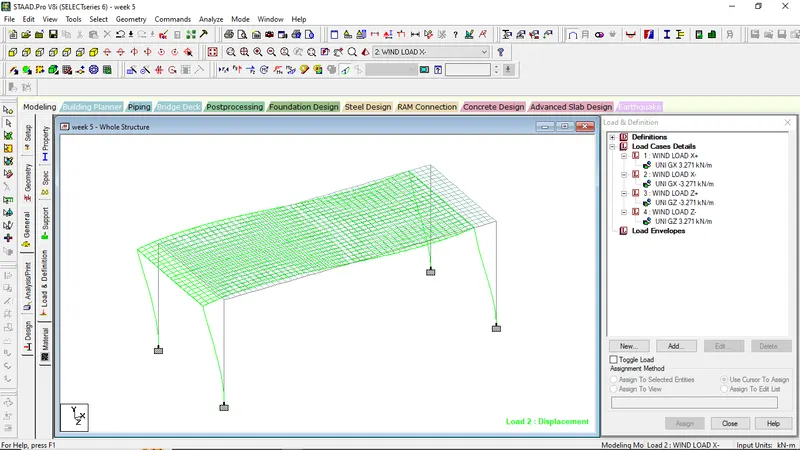
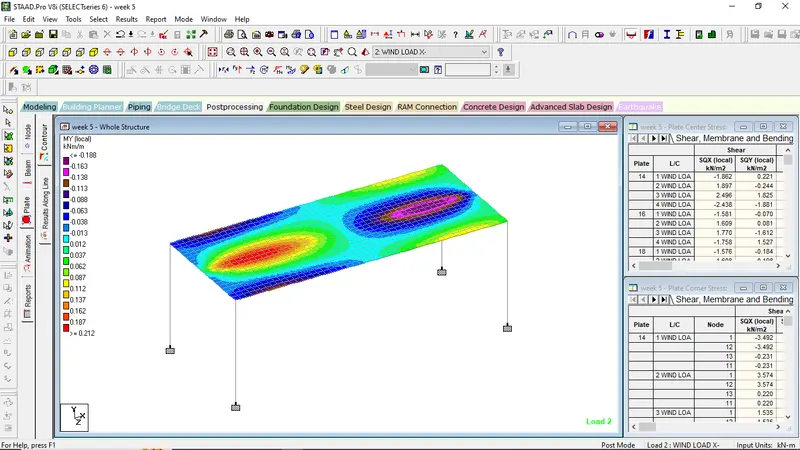
Figure showing maximum MY local WLX-
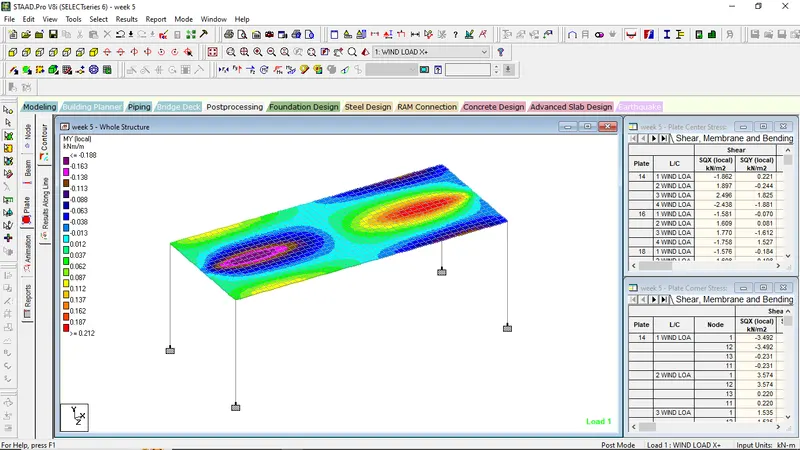
Figure showing maximum MY local WLX+
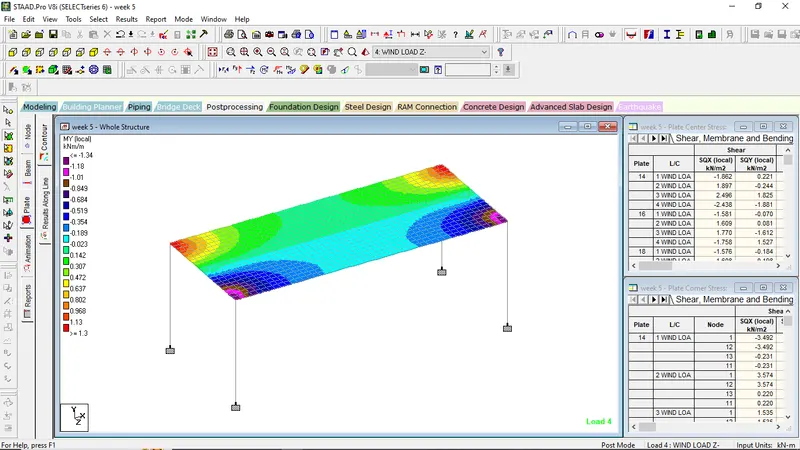
Figure showing maximum MY local WLZ-
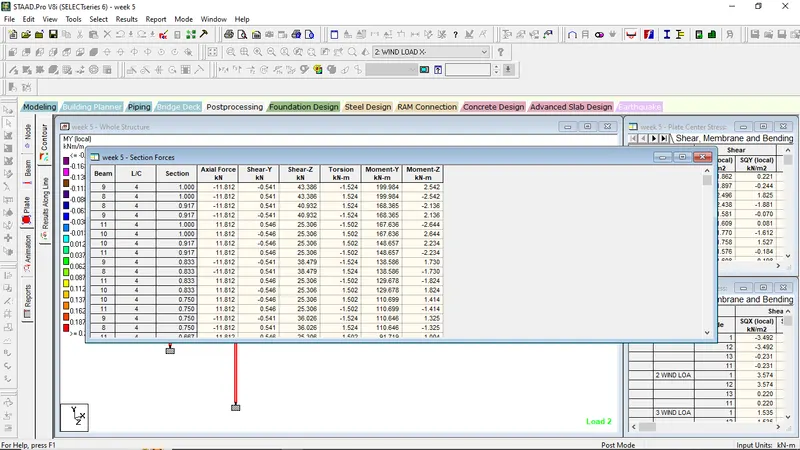
Figure showing maximum axial force