Week 5 Challenge
Aim :- To solve the questions which are based on the condition.
Objective :- Provide proper justification for the true/false question.
Create plot for the various battery type for Energy density vs voltage.
Theory :-
Que 1 : Consider a scenario where an aggressive driver is accelerating very rapidly and braking harshly in a city driving. Is battery better a choice to supply power than UC in this scenario?
Ans : False.
Why??
An ultracapacitor complements a primary energy source by supplementing power during periods of peak demand. They are able to quickly release or accept charge at a moment’s notice, and what an ultracapacitor lacks in storage capacity is overcompensated for by efficiency and life expectancy. They are able to quickly absorb energy, produce peak loads on demand and withstand repeated charge cycles without degradation.A start-stop system reduces fuel consumption and emissions by shutting down and restarting the engine in stop and go traffic. The shift from battery based to ultracapacitor based start-stop systems was due to its enhanced performance and extended life expectancy.
Que 2 :
Consider the following components.
1) Lead acid battery 2) Nickel cadmium battery 3) Nickel Metal hydride battery 4) Lithium ion (specify chemistry) battery 5) Ultra Capacitor
In case of a range of energy density, take the average value for the plot. Create a plot with energy density on the X Axis and cell voltage on the Y axis.
Ans :
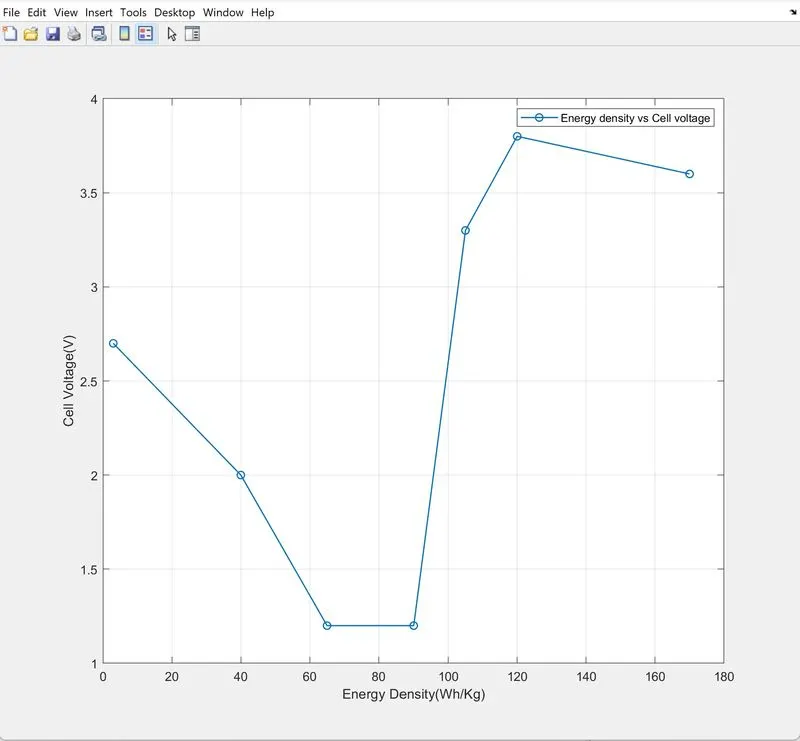
Matlab Code For the plot generation,
% Energy density vs cell voltage Plot for different battery types or ESS.
% 1)Lead acid battery 2)Nickel cadmium battery 3)Nickel Metal hydride battery 4)Lithium ion battery 5)Ultra Capacitor
% Energy density values are average values for the particular battery chemistries

% Energy Density Values
Ed_Pb_battery = 40; % Ed = Energy density(Wh/Kg)
Ed_NiCd_battery = 65; % Ed = Energy density(Wh/Kg)
Ed_NiMH_battery = 90; % Ed = Energy density(Wh/Kg)
Ed_Li_ion_CobaltOxide_battery = 170; % Ed = Energy density(Wh/Kg)
Ed_Li_ion_ManganeseOxide_battery = 120; % Ed = Energy density(Wh/Kg)
Ed_Li_ion_Phosphate_battery = 105; % Ed = Energy density(Wh/Kg)
Ed_Ultracapacitor = 3; % Ed = Energy density(Wh/Kg)


% Nominal Cell Voltage Values
Cv_Pb_Battery = 2; % Cv = Cell voltage(V)
Cv_NiCd_Battery = 1.2; % Cv = Cell voltage(V)
Cv_NiMH_Battery = 1.2; % Cv = Cell voltage(V)
Cv_Li_ion_CobaltOxide_Battery = 3.6; % Cv = Cell voltage(V)
Cv_Li_ion_ManganeseOxide_Battery = 3.8; % Cv = Cell voltage(V)
Cv_Li_ion_Phosphate_Battery = 3.3; % Cv = Cell voltage(V)
Cv_Ultracapacitor = 2.7; % Cv = Cell voltage(V)

% Plotting Energy density VS Cell voltage
Energy_density = [3,40,65,90,105,120,170];
Cell_Voltage = [2.7,2,1.2,1.2,3.3,3.8,3.6];
plot(Energy_density,Cell_Voltage,'Marker','o','linewidth',1)
xlabel('Energy Density(Wh/Kg)')
ylabel('Cell Voltage(V)')
legend('Energy density vs Cell voltage')
grid on
If we compare the capabilities of the above battery chemistries the battery with highest energy density is Li-ion Cobalt Oxide battery with 170 Wh/Kg energy density with 3.6 nominal cell voltage.For the ultracapacitor the energy density is around 3 Wh/Kg with 2.7 voltage.But according to the usage UCs are perfect to their position or the ratings because of their nature of the working.
Que 3 :
Create a plot with power density on the X axis and cell voltage on the Y axis.
Ans :
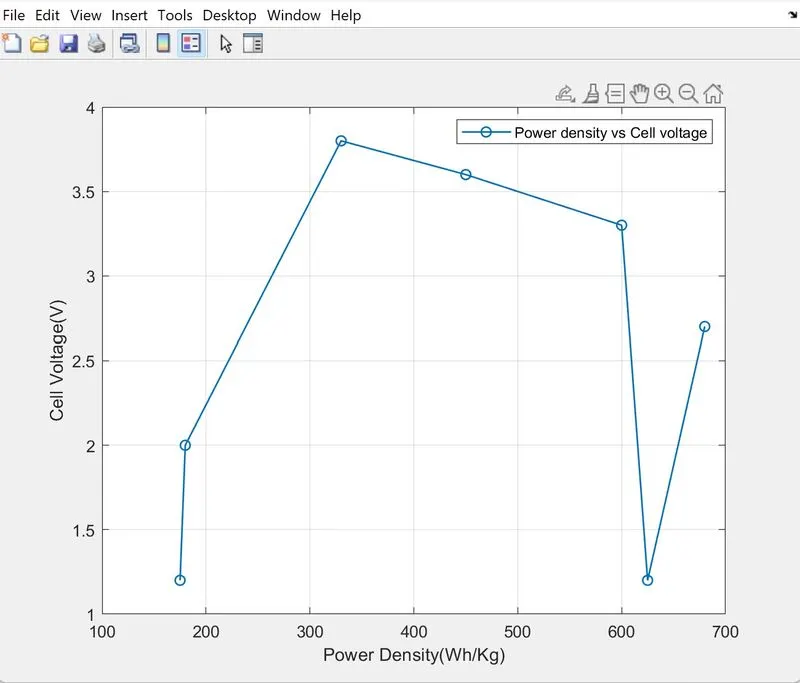
Matlab Code For the plot generation,
% Power density vs cell voltage Plot for different battery types or ESS.
% 1)Lead acid battery 2)Nickel cadmium battery 3)Nickel Metal hydride battery 4)Lithium ion battery 5)Ultra Capacitor
% Power density values are average values for the particular battery chemistries

% Power Density Values
Pd_Pb_battery = 180; % Pd = Power density(W/Kg)
Pd_NiCd_battery = 175; % Pd = Power density(W/Kg)
Pd_NiMH_battery = 625; % Pd = Power density(W/Kg)
Pd_Li_ion_CobaltOxide_battery = 450; % Pd = Power density(W/Kg)
Pd_Li_ion_ManganeseOxide_battery = 330; % Pd = Power density(W/Kg)
Pd_Li_ion_Phosphate_battery = 600; % Pd = Power density(W/Kg)
Pd_Ultracapacitor = 680; % Pd = Power density(W/Kg)


% Nominal Cell Voltage Values
Cv_Pb_Battery = 2; % Cv = Cell voltage(V)
Cv_NiCd_Battery = 1.2; % Cv = Cell voltage(V)
Cv_NiMH_Battery = 1.2; % Cv = Cell voltage(V)
Cv_Li_ion_CobaltOxide_Battery = 3.6; % Cv = Cell voltage(V)
Cv_Li_ion_ManganeseOxide_Battery = 3.8; % Cv = Cell voltage(V)
Cv_Li_ion_Phosphate_Battery = 3.3; % Cv = Cell voltage(V)
Cv_Ultracapacitor = 2.7; % Cv = Cell voltage(V)

% Plotting Energy density VS Cell voltage
Power_density = [175,180,330,450,600,625,680];
Cell_Voltage = [1.2,2,3.8,3.6,3.3,1.2,2.7];
plot(Power_density,Cell_Voltage,'Marker','o','linewidth',1)
xlabel('Power Density(Wh/Kg)')
ylabel('Cell Voltage(V)')
legend('Power density vs Cell voltage')
grid on
Que 4 : A battery has just been manufactured in the industry and has been connected to a charger for the first time. The electrode marked as (1) in the picture below is the negative electrode. True or False
Ans : True
Why??
Usually while charging electrons travel from positive side(which is anode) to the negative side(which is cathode).And while discharging electrons travel from negative side to the positive side through the load.In the above case charging situation is happening and electrons are moving towards the negative electrode which is mark as 1.And also we can see the the arrow which shows the movement of the ions in the direction of the negative electrode which is gray in color.