Week 5 Battery characteristics using drive cycle
Simulation of Generic Battery model using UDDS data
Batteries in electric vehicles discharge during acceleration while maintaining vehicular speed. They are recharged during braking. Driving cycles can therefore reflect significant variations in battery discharging and charging events such that observation of ampere-level current swings may be possible. Cyclic charge and discharge (CCD) of batteries is a standard cycling test that can be used to analyse the performance of battery in real world situations. These tests use a preset current profile to discharge a battery. The current profile is designed to mimic operating conditions that the battery is exposed to in its lifetime. Here we examine the charging and discharging of batteries for electric vehicles, associated with driving cycles such as the EPA Urban Dynamometer Driving Schedule (UDDS). Although we are not testing actual electric-vehicle batteries here, we show results from a standard 18650 Li-ion battery.
Significance of drive cycle
In the United States, the Environmental Protection Agency(EPA) is responsible for testing and rating the fuel economy of all road-going vehicles, and the methodology used for rating electric vehicle range is actually very close to what they use to test conventional vehicles.
The EPA tests cars on a dynamometer, also known as a dyno. A dyno is kind of like a treadmill for cars – the car is placed on rollers so the car can be “driven” while staying locked in place. Dynos can be used to gather all sorts of data about a car’s performance, such as horsepower and fuel economy. On the dyno, vehicles are put through different driving cycles, where the cars are sped up or slowed down to hit prescribed speeds to simulate different kinds of driving. The two important cycles that EVs are put through are the Urban Dynamometer Driving Schedule (UDDS) and the Highway Fuel Economy Driving Schedule (HWFET).
The UDDS cycle simulates stop-and-go city driving by getting the test vehicle up to speed and back down to zero. It’s used to measure city fuel economy.
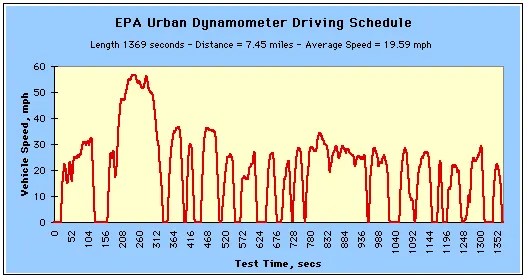
Figure 1: UDDS Drive cycle
The HWFET cycle simulates sustained-speed highway driving by getting the vehicle up to speed, then having it fluctuate between various speeds speeds in the 30 – 60 mph range over the course of the test. The wheels don’t come to a complete stop until the end. This test measures highway fuel economy.
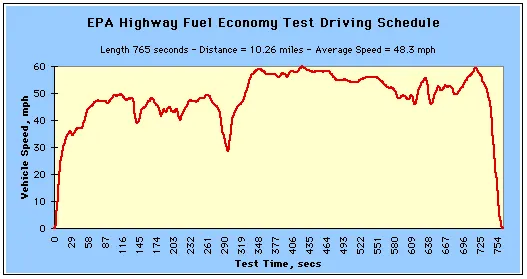
Figure 2: HWFET Drive cycle
Modelling of Generic Battery using UDDS data in Simulink
The screen shot of Simulink model for cyclic charge and discharge simulation for UDDS data is as shown below in figure 3. There are three main components in this model.
- Battery (Simulink->electricdrivelib->Extra Sources)
- Controlled current source (Simulink->powerlib->Electrical Sources)
- Signal Builder (Simulink->sources)
The library locations of each of the blocks are given above and the configuration procedure has been explained below.
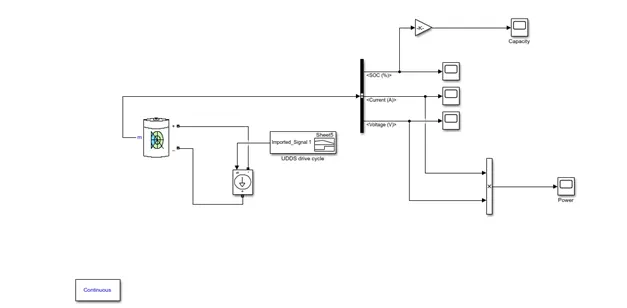
Figure 3 : Simulink model for Generic Battery simulation
- Battery configuration
The high voltage battery it is one of the most important component of a battery electric vehicle (BEV). The battery parameters have a significant influence on other components and attributes of the vehicle, like:
- maximum traction motor torque
- maximum regeneration brake torque
- vehicle range
- vehicle total weight
- vehicle price
Here we are not going to calculate all the above data since our aim is to model the battery charge discharge cycle. In order to model the battery, we need actual value of battery rating used in BEVs.
As we know, BEVs consists of battery packs and these battery pack design depends upon range, Energy and other parameters.
For example, Mitsubishi and Tesla battery packs are shown below.
The high voltage battery pack of Mitsubishi i-MiEV consists of 22 modules made up from 88 cells connected in series. Each module contains 4 prismatic cells. The voltage of each cell is 3.7 V and the total voltage of the battery pack 330 V.
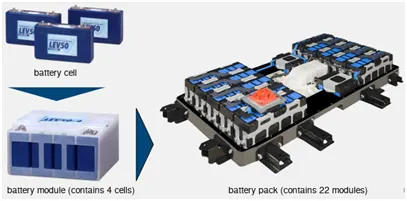
Another example is the high voltage battery pack of Tesla Model S, which has:
- 74 cells in a parallel group
- 6 groups in series for a module
- 16 modules in series
- 7104 cells in total

Figure 5: Tesla Battery pack
Battery Pack Calculation
For calculating battery pack, we are considering the following manufacturer’s data.
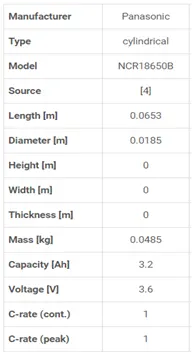
- The required battery pack total energyEbp [Wh] is calculated as the product between the average energy consumption Eavg [Wh/km] and vehicle range Dv [km].

-
Figure 6: Battery pack details of Honda e
For calculating battery pack, let’s consider the Range and Efficiency of Honda e vehicle.Ebp= 168 * 170 = 28560wh Recalculate for total strings in battery pack
- of battery cells connected in series , Ncs
Ncs = Nominal battery pack voltage / voltage of each cell = 400/3.6 = 111.11
Ncs = 112
- Energy content of a string, Ebs
Ebs = Ncs * Ebc
Ebc= Energy of a single battery cell
Ebs= 112 * 11.52 = 1290.24 wh
- Total no.of strings of battery pack, Nsb
Nsb = Ebp / Ebs = 28560 / 1290.24 = 22.135
Nsb= 23
Recalculating Ebp = 23 * 1290.24 = 29675.52 wh
- Battery pack capacity, Cbp
Cbp = Nsb * Cbc
Cbc = capacity of a single cell
Cbp = 23 * 3.2 = 73.6Ah
- Total no.of cells of the battery pack, Ncb
Ncb = Nsb * Ncs = 23* 112 = 2576
Based on the above calculations, we can enter the data in generic battery model.
Nominal voltage, V = 400v
Rated Capacity, Ah = 73.6Ah
Initial SOC = 100%
Battery response time = 30sec
- Controlled Current Source
The Controlled Current Source block converts the Simulink input signal into an equivalent current source. The generated current is driven by the input signal of the block.
In our model, the input signal is given by the signal builder block. Based on the signals from signal builder block, current is generated. When the current is positive, it acts as load which means it discharges battery and when the current is negative, it charges the battery.
- Signal builder
The input to the battery model is the UDDS cycle. But we haven’t implemented driver and vehicle model to get the desired current for corresponding velocity. So we have to input the current profile to the signal builder block in order to generate corresponding signals. The time and current data can be imported to signal builder block from excel sheet. We get the following signal after importing UDDS current profile.
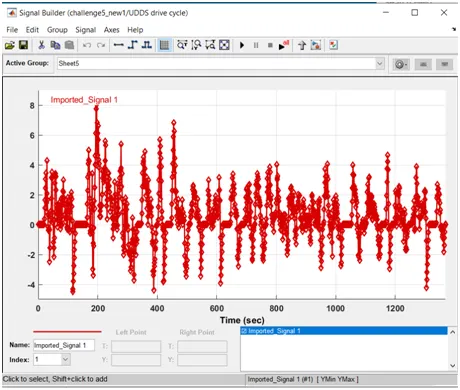
Figure 7: UDDS current signals in signal builder
Analysis of Results
The total capacity of the battery at 100% SOC (which is the given initial SOC) is 73.6Ah. As the vehicle accelerates battery discharges and it loses capacity which is shown in figure 8. During braking battery charges and it gains capacity. This is the reason for some increase in capacity for small interval of time. But ultimately battery loses its capacity and it reaches to 73.35Ah. This capacity curve is obtained by multiplying SOC with gain k. Where k= Battery capacity/100 = 73.6/100.
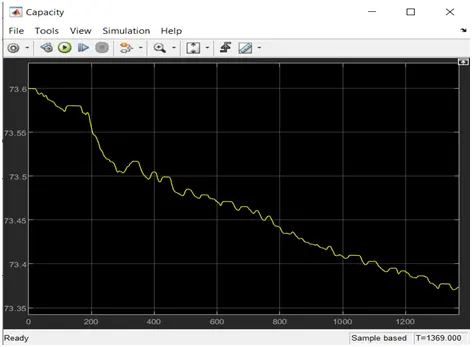
Figure 8: Battery Capacity (Charge lost from battery)
The State of charge of the battery is as shown in figure 9. We have given initial SOC as 100%. The increase and decrease of SOC shows charging and discharging of battery.
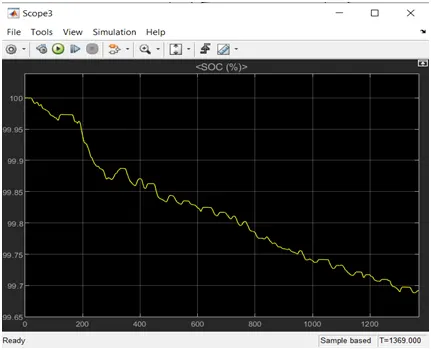
Figure 9: State of Charge of the battery
Figure 10 shows battery current profile. The positive current shows battery discharge current during vehicle acceleration. The negative current shows battery charging current during vehicle braking.
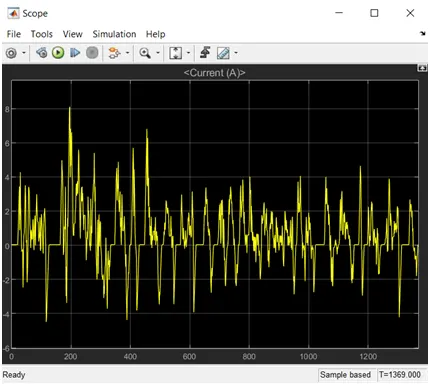
Figure 10: Battery current
Figure 11 shows battery voltage profile. The positive voltage shows battery discharge current during vehicle acceleration. The negative voltage shows battery charging current during vehicle braking. The nominal voltage of the battery given is 400V. So the maximum voltage of the battery started from 467.5V.
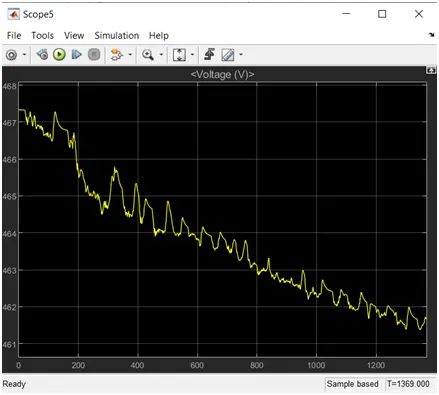
Figure 11: Battery Voltage
Figure 12 shows battery power profile. It is obtained by battery voltage and current profile. We can see the power demand at different times in this plot.
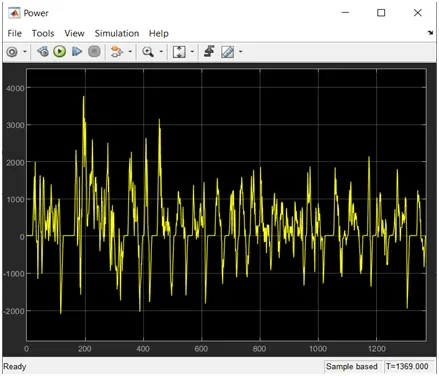
Figure 12: Battery Power
Find the attached simulink model for battrey charge discharge during UDDS cycle.