Project 1
- AIM
To create the simulink model of fuel cell, Li-Ion battery, Energy management block and plot the distribution of power among these sources.
- Objective
To create the following plots against time.
- Fuel cell power
- Battery power
- Fuel cell operating state (running , stand by)
The distribution of power among these sources will be as per the flow chart given below.
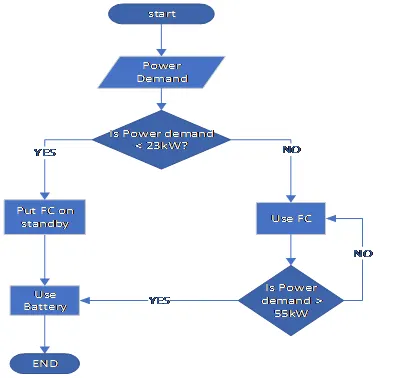
Figure 1: Flow chart
The operating range of 80kW fuel cell can be extracted from polarisation curve provided by the manufacturer. From the datasheet, operating range of fuel cell is 23kW to 55kW.
Above the max power (55kW) and below the minimum power (23kW) will be supplied by the battery.
- Simulink modelling
There are mainly 3 subsystems involved in this model.
- Power Source selection
- Fuel Cell
- Battery model
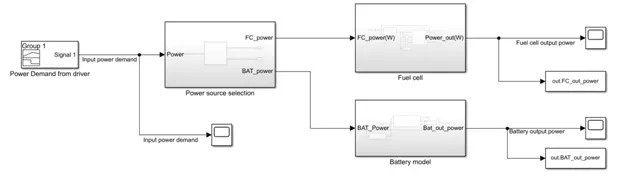
Figure 2: Simulink model of the system
3.1 Power source selection
The main function of this subsystem is to distribute the power demand to battery/ fuel cell according to the flowchart shown in figure1.
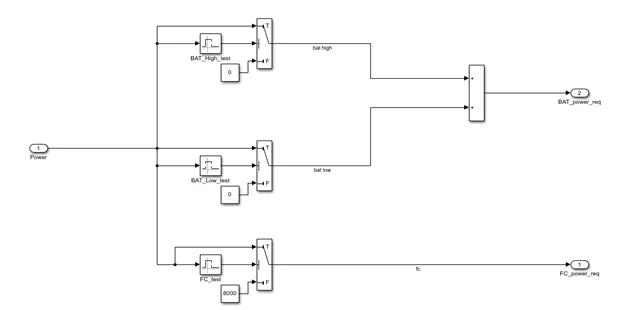
Figure 3: Power Source selection
The input power, PD distribution is as follows.
1. If 23kW>=PD <55kW , Fuel cell will deliver the power.
- If PD<23kW or PD>=55kW , Battery will deliver the power. Fuel cell will be in standby mode during this time.
During standby mode, fuel cell will deliver 10% of its rated power. Since the rating of fuel cell implemented here is 80kW, its standby mode power will be 8kW.
All these conditions are being through interval loop test blocks shown in figure 3.
3.2 Fuel cell Modelling
Fuel cell modeling is helpful for fuel cell developers because it can lead to fuel cell design improvements, as well as cheaper, better, and more efficient fuel cells. The model must be robust and accurate and be able to provide solutions to fuel cell problems quickly. A good model should predict fuel cell performance under a wide range of fuel cell operating conditions[2].
There are two different types of models: engineering or scientific models and statistical models. Engineering and scientific models are often built using equations from the literature and from derived equations. In this model type, there is often a combination of equations that are used to calculate the natural phenomena that is occurring -- and there is often little to no available data to help build the model. The other model type is a statistical or empirical model. These models are generated from known datasets[6].
There are many statistical tools that can be used for model validation. One of the most useful tools is graphical residual analysis.
The model implemented in this project is statistical model. It several values from datasheet or experimental analysis. The details of this model are explained below.
There are mainly 3 systems involved in the modelling of fuel cell.
- Compressor model
- Fuel cell stack
- Feedback control
Actual fuel cell includes lots of other components also. But here only main components have been modelled and the performance optimisation is done by adding datasheet values/ plots.
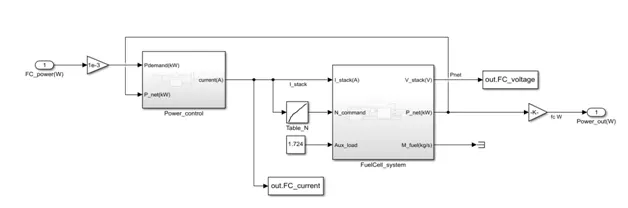
Figure 4 : Fuel cell subsystem
Inside ‘fuelcell’ subsystem, there are two subsystems.
- ‘Power_control’ ‘FuelCell_system’
The Energy Management System (EMS) will calculate the power required from fuel cell and fed to the fuelcell subsystem.
3.2.1 Power_control subsystem
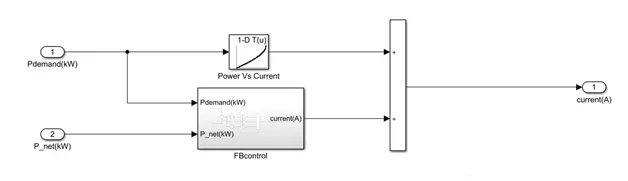
Figure 5 : Power_control subsystem
The desired current of fuel cell is calculated from the power request and feedback values inside this block.
There is a lookup table which gives fuel cell current value to the corresponding power input. The power Vs current curve will be provided by the manufacturer.
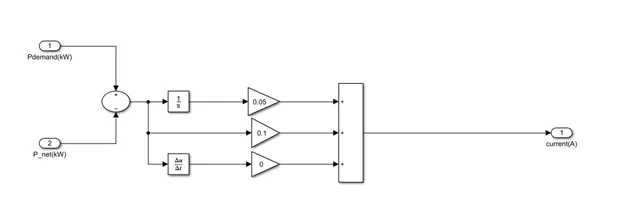
Figure 6 : FBcontrol subsystem
The feedback control loop takes the feedback power and the difference between power demand and output power is fed through a PID controller to get the corresponding current. Both of these currents are added together to get the total current.
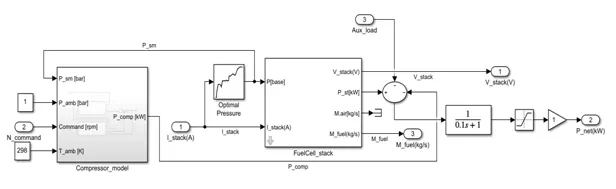
Figure 7 : Fuelcell _system
3.2.2 Compressor model
The simplest type of pressurised PEM fuel cell is that in which the hydrogen gas comes from a high-pressure cylinder. Only the air has to be compressed. The hydrogen gas is coming from a pressurised container, and thus its compression ‘comes free’[3]. Running a fuel cell at higher pressure will increase the power, but it also involves the expenditure of power, and there is the cost, weight, and space taken up by the compression equipment. The increase in power resulting from operating a PEM fuel cell at higher pressure is mainly the result of the reduction in the cathode activation overvoltage. The increased pressure raises the exchange current density, which has the apparent effect of lifting the open circuit voltage (OCV). There is also sometimes a reduction in the mass transport losses, with the effect that the voltage begins to fall off at a higher current. In simple terms, for most values of current, the voltage is raised by a fixed value.
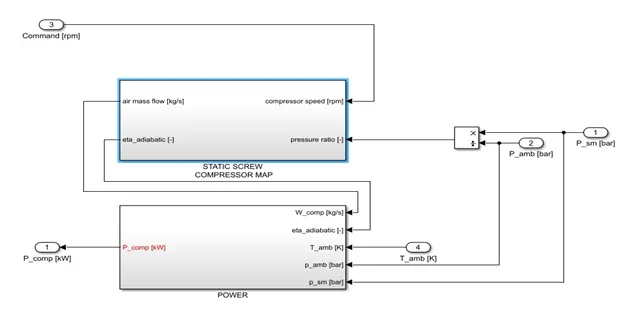
Figure 8 : Compressor_model subsystem
The air flow rate from the compressor depend on the following values.
- Pressure ratio
- Compressor speed
- Adiabatic efficiency
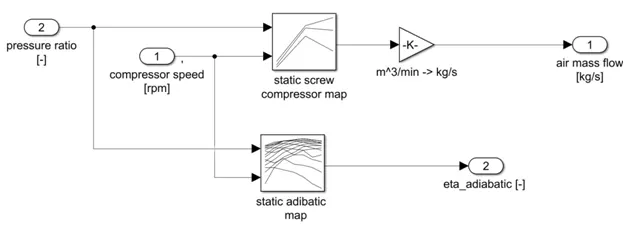
Figure 9: Static screw compressor map
The adiabatic efficiency map gives the efficiency of the compressor for different compressor speed and pressure speed.
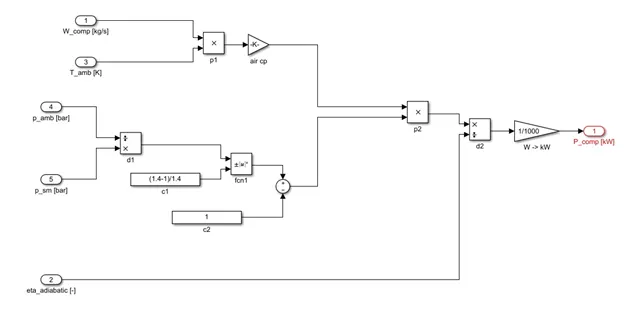
Figure 10: Power
The compressor output power can be calculated as follows[2] :
P_comp = (W_comp * T_amb * Cp) * (((P2/P1) (1.4-1/1.4) -1) / eta_adiabatic)
Where W_comp = air flow rate[kg/s]
T_amb – Ambient temperature
Cp - specific heat at constant pressure (J/gK)
P2 – Raised pressure
P1 – Atmospheric pressure
3.2.3 Fuel Cell stack subsystem
- Stack_voltage
- Air&H2_consumption
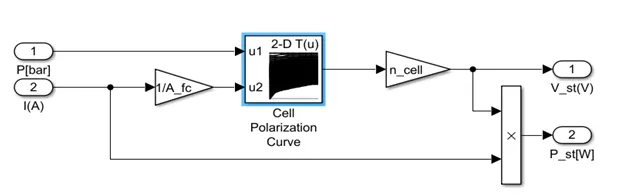
Figure 11 : Stack_voltage
The stack voltage subsystem will give the stack voltage value for different cathode pressures and current density. Where ‘A_fc’ is the area of fuel cell and n_cell is the number of cells in series.
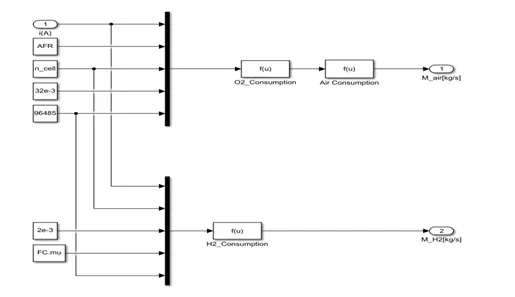
Figure 12 : Air&H2_compression
The Oxygen consumption is given by[2],
O2 Consumption = (I * AFR * no.of cells in series * molar mass of O2 ) / (4* F)
Where I = Stack current
AFR = Air fuel ratio
Molar mass of O2 = 32e-3
F = Faradays constant = 96485
The Air consumption is given by,
Air Consumption = O2 consumption / (0.21*32/(0.21*32 + 0.79*28))
Where Approximate Air:
0.21 02 + 0.79 N2 (mole basis)
Molar mass of O2 = 32 and N2 = 28
The Hydrogen consumption is given by,
H2 consumption = I * no.of cells in series * molar mass of H2 / 2* FC.mu*F
Where FC.mu = Hydrogen utility factor
Molar mass of H2 = 2e-3
F = Faradays constant
3.3 Battery model
The Li-Ion battery model is as shown in figure13. The input to the model is the power request from the EMS. There are two subsystems inside it.
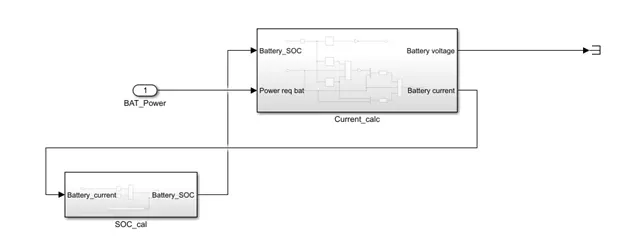
Figure 13 : Battery model
- Current_calc
- SOC_cal
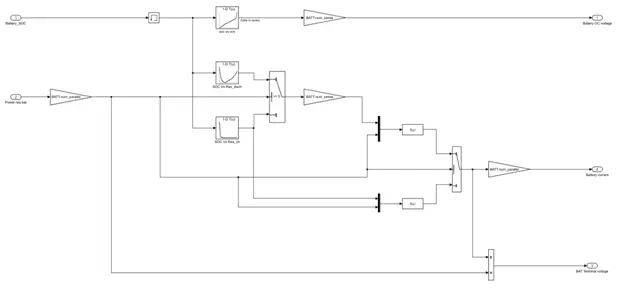
Figure 14 : Current calc
The current calculation subsystem is as shown above. Battery voltage is determined from SOC[5]. The open circuit voltage with SOC data for a single cell will be available from the datasheet. It has to be multiplies with total number of cells in series to get the total voltage of the battery pack.
There are 3 plots used in this model to calculate the current. The open circuit voltage of the battery is determined from the SOC Vs OCV plot.
The internal resistance of the battery will be different while charging and discharging. This value can be obtained from SOC Vs Resistance for discharging and charging curves.
Then current, I = sqrt(Power /R(chg/disch)
The battery terminal voltage = Battery power / current
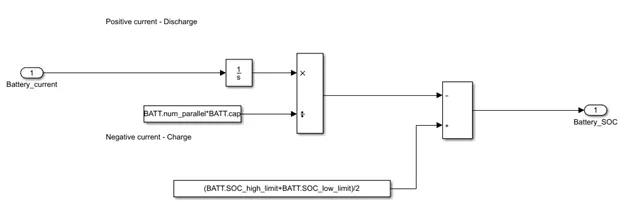
Figure 15 : SOC
The SOC estimation of the battery is as shown above. There are various methods to estimate the SOC of a battery. The method adopted here is the coulomb counting method [5]. The Coulomb counting method measures the discharging current of a battery and integrates the discharging current over time in order to estimate SOC. Coulomb counting method is done to estimate the SOC(𝑡), which is estimated fromthe discharging current, 𝐼(𝑡), and previously estimated SOC values, SOC(𝑡 −1). SOC is calculated by the following equation[5]:
SOC(t) = SOC(t-1) + ( I(t) * Δt ) / Qn
Where Qn is the total Ah capacity of the battery. Here it is given as a constant value of 200Ah. Which is converted to mAh and fed to the block. There should be an initial SOC for the battery to provide emergency power to the vehicle. This is provided by another constant block.
Initial SOC = (Maximum SOC+ Minimum SOC) / 2
This SOC is fed to the current calculation block for current calculation. Since SOC is available after 1st iteration, a memory block is added to avoid computational error.
4.Output Analysis
The output analysis contains the following plots
- Battery power
- Fuel cell power
- Fuel cell operating state (running, standby)
The input power request is given by a signal builder block given below.
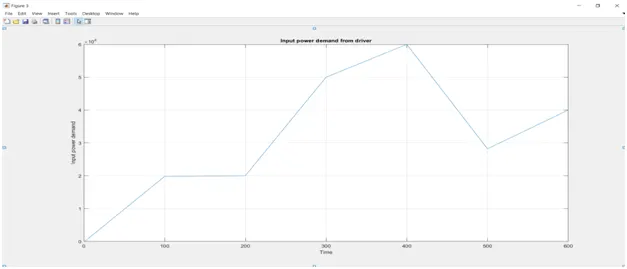
Figure 16: Input power demand
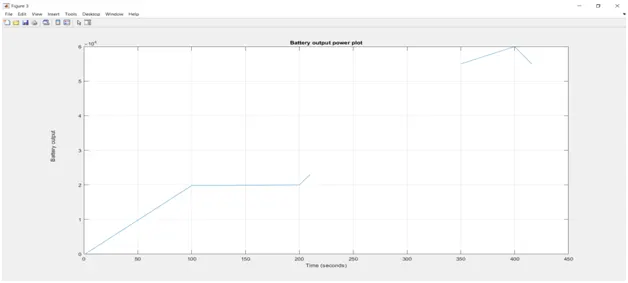
Figure 17 : Battery output
The battery will operate when the input power demand is less than 23kW and greater than 55kW. This can be observed from the above plot.
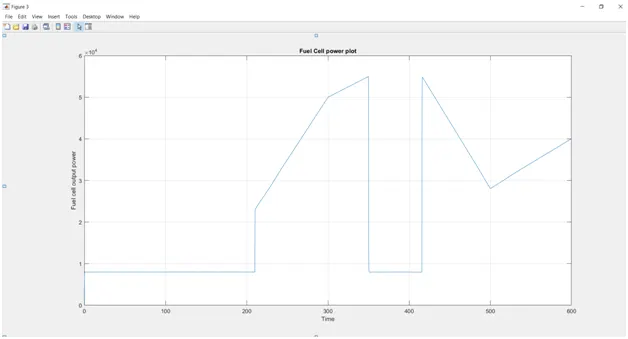
Figure 18 : Fuel cell output
The fuel will operate when the input power demand is greater than or equal to 23kW and less than 55kW. This can be observed from the above plot. Fuel cell will be in standby mode during other conditions. In standby mode, it will deliver 10% of its rated power which is 8kW. Both these conditions can be obtained from the above plot.
4.1 Commands to plot Fuel cell in stand by operating state
index= find(out.FC_out_power < 10000);
>> scatter(out.tout(index),out.FC_voltage(index))
>> hold on
>> scatter(out.tout(index),out.FC_current(index))
>> scatter(out.tout(index),out.FC_out_power(index)/100)
>> grid on
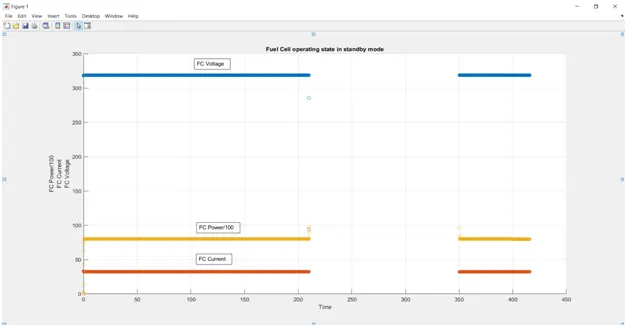
Figure 19 : Standby operation of fuel cell
4.2 Commands to plot Fuel cell in running operating state
index= find((out.FC_out_power >= 23000) &(out.FC_out_power < 55000));
>> hold off
>> scatter(out.tout(index),out.FC_voltage(index))
hold on
scatter(out.tout(index),out.FC_current(index))
scatter(out.tout(index),out.FC_out_power(index)/100)
>> grid on
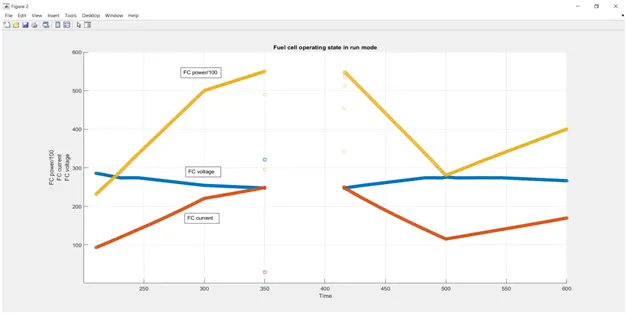
Figure 20 : Running operation mode of Fuel cell
5.Conclusion
An energy management system has been modeled successfully with advanced energy sources like fuel cell and battery. Both of these sources are widely used in automotive industry and the modeling of the same will be very useful in the industry.
Modeling of PEM fuel cell in this project was done by statistical method. The values are to be fed from the datasheet or experimental analysis. It can predict the performance of the fuel cell better than mathematical model.
Since the experimental analysis takes time and cost, modeling of these energy sources is relevant in automotive industry.
6.Future Scope
This project models fuel cell system in statistical method and it is not validated with experimental values. It covers the main components of fuel cell but still miss some important parameters like thermal performance, fuel cell resistance, water management, other components associated with fuel cell like turbochargers, blower, humidifier etc.
Also this project doesn’t include associated electronics components like converter, inverter, BMS etc.
Future scope is to validate the fuel cell model and include other fuel cell components models.
To predict the actual performance, all the associated components need to be modeled and validated experimentally.
7.References
- Fuel Cell Handbook, 7th Edition by EG&G Technical Services, Inc.
- Colleen Spiegel , ‘Designing and Building Fuel Cells’
- James Larminie, Andrew Dicks, ‘Fuel Cell Systems Explained’
- Ardalan Vahidi, Wesley Greenwell, ‘A Decentralized Model Predictive Control Approach to Power Management of a Fuel Cell-Ultracapacitor Hybrid’
- Wen-Yeau Chang , ‘ The State of Charge Estimating Methods for Battery: A Review’
- https://www.fuelcellstore.com/blog-section/fuel-cell-modeling-blog-articles/model-validation-using-residuals
- https://www.fuelcellstore.com/blog-section/fuel-cell-modeling-blog-articles/fuel-cell-modeling-basics
- H.J. Bergveld, ‘Battery Management Systems Design by Modelling’.
- Dongdong Zhao, ‘Control of an ultrahigh speed centrifugal compressor for the air management of fuel cell systems’.
- Richard C Dorf, ‘PEM fuel cells: Theory and practise’.
List of attachments
1. Pro1_plot5.fig - Fuel cell operating state in standby mode
2. Pro1_plot4.fig - Fuel cell operating state in running mode
3. Pro1_plot3.fig - Input power demand plot
4. Pro1_plot2.fig - Fuel cell output power plot
5. Pro1_plot1.fig - Battery output power plot
6. project1_new_var.mat - Workspace file with variables declaration
7. project1_new.mat - MATLAB Simulink file