Battery characteristics using drive cycle
AIM: To simulink generic battery model charge discharge using UDDS data.
INPUTS:
1.Signal Builder:
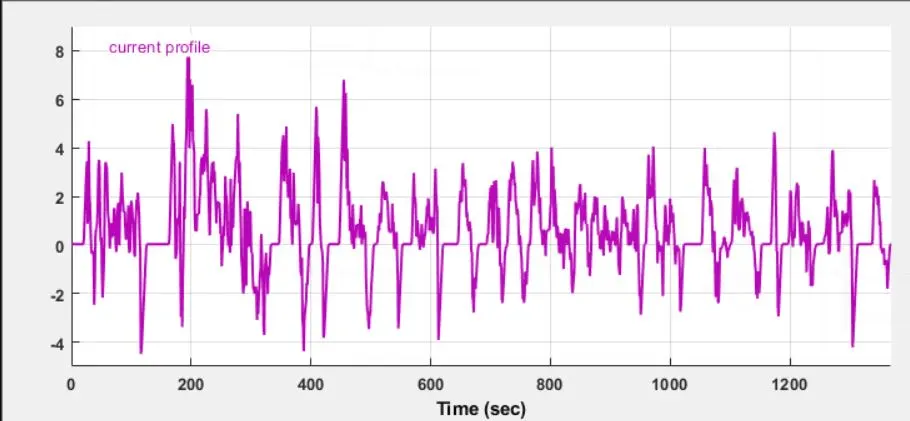
A driving cycle is a series of data points representing the speed of a vehicle versus time. Driving cycles are produced by different countries and organizations to assess the performance of vehicles in various ways.
UDDS drive cycle.UDDS stands for Urban Dynamometer Driving Schedule.
In this model a signal builder block to create the drive cycle data of the UDDS cycle. The limitation of the signal builder is that it accepts data in the form of only the current profile. So, the speed v/s time data from drive cycle should be converted to its corresponding current profile with respect to time
2. Controlled Current Source:
Converts the Simulink input signal into an equivalent current source. The generated current is driven by the input signal of the block.
3. Generic Battery MOdel:
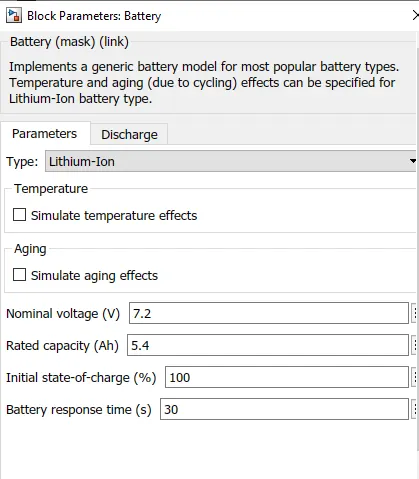
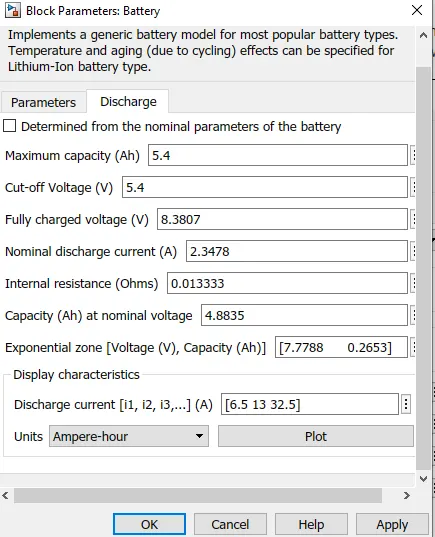
Implements a generic battery model for most popular battery types. Temperature and aging (due to cycling) effects can be specified for Lithium-Ion battery type.

Here Lithium Ion battery are used with nominal voltage 7.2V and Capacity 5.4Ah.
Discharge Characteristic:
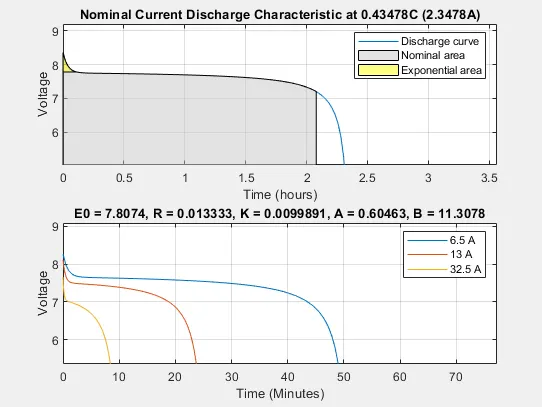
The first subplot gives discharge characteristic of the battery when it is discharge at nominal current(6.5A)
The second Subplot gives the comparison of discharge characteristic of the battery when it is discharged at different current rate. When the discharge rate is high the capacity of the reduces
4. Bus selector:
This block accepts a bus as input which can be created from a Bus Creator, Bus Selector or a block that defines its output using a bus object.
5. Powergui:
The powergui block to simulate any simulink model containing simscape electrical specialized power system blocks. It stores the equivalent simulink circuit that represents the state-space equation of the model.
SIMULINK MODEL:
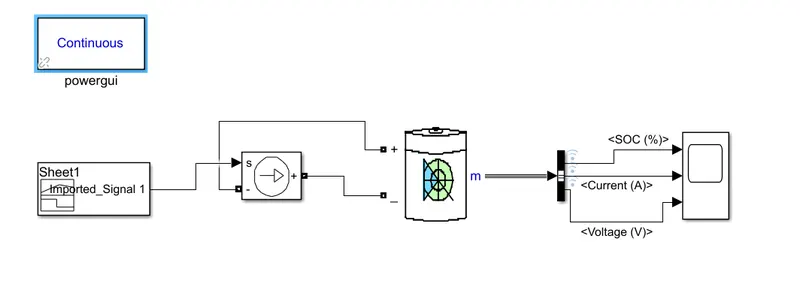
The model represents the battery characteristics of its State of charge, voltage and current response according to the load demand. Here a load demand is assumed to be given from an Electric vehicle. The drive cycle data is assumed to be the load reference.
RESULTS:
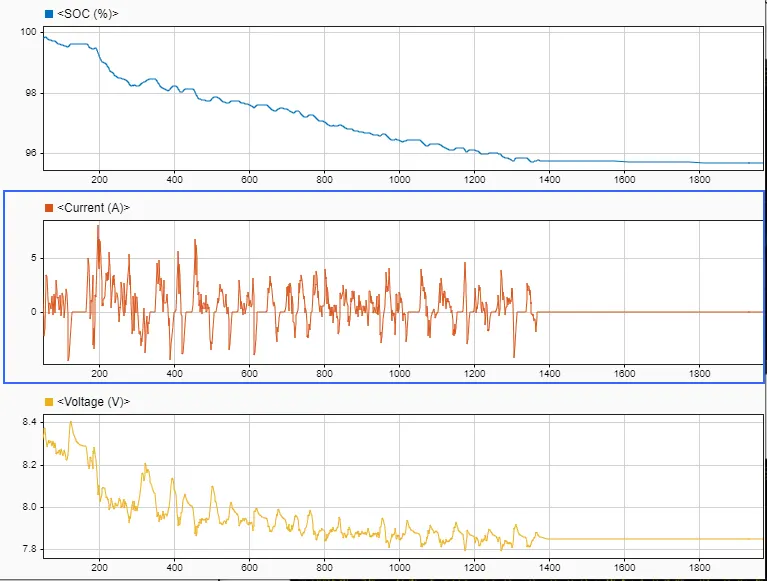
Initially the SOC of the battery is 100%. That means the battery is fully charged.In this graph for battery parameters, the battery SOC is going up and down according to the charging and discharging of battery.
The negative current display current coming into the battery means charging and positive current shows discharging of battery.