Week 5.1 - Mid term project - Solving the steady and unsteady 2D heat conduction problem
Report on Steady and Unsteady Heat Conduction using Jacobi and Gauss-Seidel Method
- Introduction: Heat conduction is one of the important areas in the field of heat transfer. It describes the transfer of heat through the motion of particles. In this report, we will discuss the solution of steady-state and unsteady-state heat conduction using the Jacobi and Gauss-Seidel methods. We will also discuss the use of contour plots to visualize the solution.
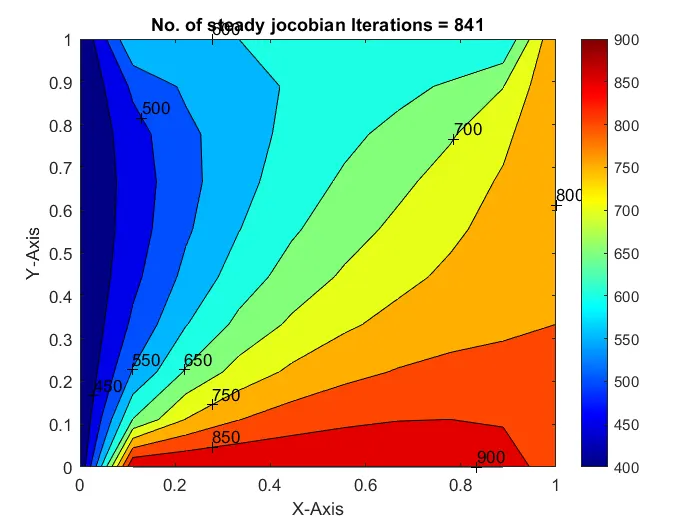
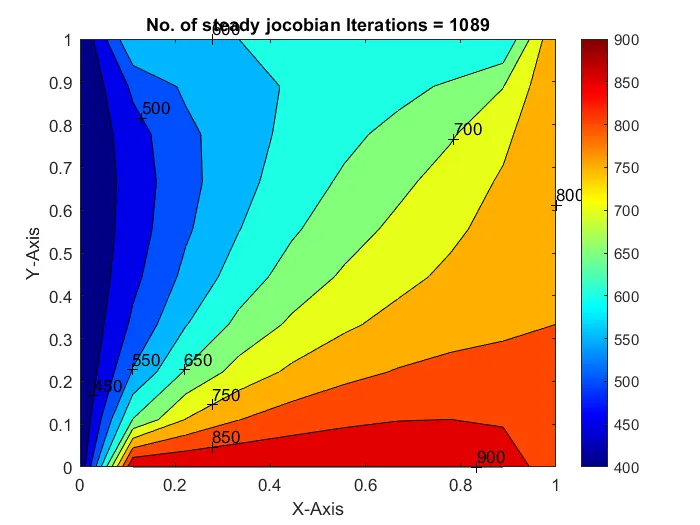
- Steady State Heat Conduction using Jacobi Method: The Jacobi method is an iterative method used to solve the system of linear equations. It involves solving the equations for each variable, while holding the other variables constant. In this code, we have used the Jacobi method to solve the steady-state heat conduction equation. The steady-state heat conduction equation is given by:
- 𝜕^2T/𝜕x^2 + 𝜕^2T/𝜕y^2 = Q/(kρCp)
- Where, T = Temperature x, y = Coordinates Q = Heat source k = Thermal conductivity ρ = Density Cp = Specific heat
- The code iterates over the matrix until the error between the new and old temperature matrix falls below a specified tolerance value. The Told matrix is used to hold the previous values of the temperature matrix, and the new values are stored in the T matrix. The function clabel(contourf(x,y,T)) is used to plot the temperature matrix as a contour plot. The color of the contour plot is set using the function colormap(jet).
- Steady State Heat Conduction using Gauss-Seidel Method: The Gauss-Seidel method is also an iterative method used to solve the system of linear equations. It is similar to the Jacobi method, but it updates the values of the variables in place. In this code, we have used the Gauss-Seidel method to solve the steady-state heat conduction equation. The implementation of the Gauss-Seidel method in the code is the same as the Jacobi method. The only difference is that we update the Told matrix in place, instead of storing it in a separate matrix.
- Unsteady State Heat Conduction using Jacobi Method: The Jacobi method can also be used to solve unsteady-state heat conduction. The unsteady-state heat conduction equation is given by:
- 𝜕T/𝜕t = 𝜕^2T/𝜕x^2 + 𝜕^2T/𝜕y^2
- The code iterates over the matrix until the error between the new and old temperature matrix falls below a specified tolerance value. The Told matrix is used to hold the previous values of the temperature matrix, and the new values are stored in the T matrix. The function clabel(contourf(x,y,T)) is used to plot the temperature matrix as a contour plot. The color of the contour plot is set using the function colormap(jet).
- Unsteady State Heat Conduction using Gauss-Seidel Method: The Gauss-Seidel method can also be used to solve unsteady-state heat conduction. The implementation of the Gauss-Seidel method in the code is the same as the Jacobi method.
- Conclusion: In this report, we have discussed the solution of steady-state and unsteady-state heat conduction using the Jacobi and Gauss-Seidel methods. We have also discussed the use of contour plots to visualize the solution. The code provided is a useful tool for understanding heat conduction and the implementation of iterative methods to solve partial differential equations.
%function for steady state heat conction

function T=jocobi_method_solver(dx,dy,k,T,Told,nx,ny,tol,error,jocobi_iter,x,y)

while (error>tol)
for i=2:nx-1
    for j=2:ny-1

    term1=((Told(i-1,j)+Told(i+1,j)))/(k*dx^2);
    term2=((Told(i,j-1)+Told(i,j+1)))/(k*dy^2);
    T(i,j)=term1+term2;
end
error=max(max(abs(T-Told)));
Told=T;
jocobi_iter=jocobi_iter+1;


figure(1)
clabel(contourf(x,y,T))
%clabel(x,y,T) labels only the contour levels specified by vector T.
    colorbar
%     colorbar Display color bar (color scale)
    colormap(jet)
%      colormap is a function that sets the Colormap property of a figure

    xlabel('X-Axis')
    ylabel('Y-Axis')
    title(sprintf('No. of steady jocobian Iterations = %d', jocobi_iter));

end
end
%function for steady state heat condyction
function T=jocobi_method_solver(dx,dy,k,T,Told,nx,ny,tol,error,jocobi_iter,x,y)

while (error>tol)
for i=2:nx-1
    for j=2:ny-1

    term1=((Told(i-1,j)+Told(i+1,j)))/(k*dx^2);
    term2=((Told(i,j-1)+Told(i,j+1)))/(k*dy^2);
    T(i,j)=term1+term2;
end
error=max(max(abs(T-Told)));
Told=T;
jocobi_iter=jocobi_iter+1;


figure(1)
clabel(contourf(x,y,T))
%clabel(x,y,T) labels only the contour levels specified by vector T.
    colorbar
%     colorbar Display color bar (color scale)
    colormap(jet)
%      colormap is a function that sets the Colormap property of a figure

    xlabel('X-Axis')
    ylabel('Y-Axis')
    title(sprintf('No. of steady jocobian Iterations = %d', jocobi_iter));

end
end
%fuction for steady state heat conction using sor method
function T=sor_method(dx,dy,k,T,Told,nx,ny,tol,error,sor_iter,x,y,alpha)

while (error>tol)
for i=2:nx-1
    for j=2:ny-1

    term1=((Told(i-1,j)+Told(i+1,j)))/(k*dx^2);
    term2=((Told(i,j-1)+Told(i,j+1)))/(k*dy^2);
    T(i,j)=Told(i,j)*(1-alpha)+(alpha*(term1+term2));
end
error=max(max(abs(T-Told)));
Told=T;
sor_iter=sor_iter+1;


figure(1)
clabel(contourf(x,y,T))
%clabel(x,y,T) labels only the contour levels specified by vector T.
    colorbar
%     colorbar Display color bar (color scale)
    colormap(jet)
%      colormap is a function that sets the Colormap property of a figure

    xlabel('X-Axis')
    ylabel('Y-Axis')
    title(sprintf('No. of steady jocobian Iterations = %d', sor_iter));

end
end
%function for unsteady heat conction using jocobal solver
function T=jocobi_method_solver_unsteady(dx,dy,k,T,Told,nx,ny,tol,error,jocobi_iter,x,y,k1,k2)

while (error>tol)
for i=2:nx-1
    for j=2:ny-1

    term1=1/(1+2*k1+2*k2);
    term2=k1*term1;
   term3=k2*term1;
   H=(Told(i-1,j))+(Told(i+1,j));
   V=(Told(i,j-1)+Told(i,j+1));
   T(i,j)=(Told(i,j)*term1)+(H*term2)+(V*term3);
end
error=max(max(abs(T-Told)));
Told=T;
jocobi_iter=jocobi_iter+1;


figure(2)
clabel(contourf(x,y,T))
%clabel(x,y,T) labels only the contour levels specified by vector T.
    colorbar
%     colorbar Display color bar (color scale)
    colormap(jet)
%      colormap is a function that sets the Colormap property of a figure

    xlabel('X-Axis')
    ylabel('Y-Axis')
    title(sprintf('No. of unsteady jocobian Iterations = %d', jocobi_iter));
    pause(0.003)
end

end
%function for unsteady state heat conduction using guass seildle method

function T=gs_method_solver_unsteady(dx,dy,k,T,Told,nx,ny,tol,error,gs_iter,x,y,k1,k2)

while (error>tol)
for i=2:nx-1
    for j=2:ny-1

    term1=1/(1+2*k1+2*k2);
    term2=k1*term1;
   term3=k2*term1;
   H=(T(i-1,j))+(Told(i+1,j));
   V=(T(i,j-1)+Told(i,j+1));
   T(i,j)=(Told(i,j)*term1)+(H*term2)+(V*term3);
end
error=max(max(abs(T-Told)));
Told=T;
gs_iter=gs_iter+1;


figure(2)
clabel(contourf(x,y,T))
%clabel(x,y,T) labels only the contour levels specified by vector T.
    colorbar
%     colorbar Display color bar (color scale)
    colormap(jet)
%      colormap is a function that sets the Colormap property of a figure

    xlabel('X-Axis')
    ylabel('Y-Axis')
    title(sprintf('No. of unsteady gauss seidel Iterations = %d', gs_iter));
    pause(0.003)
end

end
%function for steady state heat conduction usiong sor method
function T=sor_method_solver_unsteady(dx,dy,k,T,Told,nx,ny,tol,error,sor_iter,x,y,k1,k2,alpha1)

while (error>tol)
for i=2:nx-1
    for j=2:ny-1

    term1=1/(1+2*k1+2*k2);
    term2=k1*term1;
   term3=k2*term1;
   H=(Told(i-1,j))+(Told(i+1,j));
   V=(Told(i,j-1)+Told(i,j+1));
   Z=(Told(i,j)*term1)+(H*term2)+(V*term3);
   T(i,j)=((Told(i,j)*(1-alpha1))+(alpha1*Z));
end
error=max(max(abs(T-Told)));
Told=T;
sor_iter=sor_iter+1;


figure(2)
clabel(contourf(x,y,T))
%clabel(x,y,T) labels only the contour levels specified by vector T.
    colorbar
%     colorbar Display color bar (color scale)
    colormap(jet)
%      colormap is a function that sets the Colormap property of a figure

    xlabel('X-Axis')
    ylabel('Y-Axis')
    title(sprintf('No. of unsteady sor Iterations = %d', sor_iter));
    pause(0.003)
end
end
%main program
clear all
 close all
 clc
 nx=10;
 ny=nx;
 dt=0.01;
 alpha1=1.2;
 alpha=2;
 x=linspace(0,1,nx);
 y=x;
 dx=x(2)-x(1);
 dy=dx;
 [x y]=meshgrid(x,y);
 T=ones(nx,ny);
 T(1,:)=900;
 T(end,:)=600;
 T(:,1)=400;
T(:,end)=800;
 k1=alpha*dt/dx^2;
  k2=alpha*dt/dy^2;

Told=T;
tol=1e-4;
error=1;
k=(2*(dx^2+dy^2)/(dx^2*dy^2));
itteration_solver=input('enter itteration solver')
if itteration_solver==1
jocobi_iter=1;
tic
T=jocobi_method_solver(dx,dy,k,T,Told,nx,ny,tol,error,jocobi_iter,x,y);
T=jocobi_method_solver_unsteady(dx,dy,k,T,Told,nx,ny,tol,error,jocobi_iter,x,y,k1,k2);
jocobi_iter;
time=toc
end
if itteration_solver==2
tic
gs_iter=1
T=guass_seidel_method(dx,dy,k,T,Told,nx,ny,tol,error,gs_iter,x,y)
T=gs_method_solver_unsteady(dx,dy,k,T,Told,nx,ny,tol,error,gs_iter,x,y,k1,k2)
 time=toc
end
if itteration_solver==3
    sor_iter=1;
    tic
    T=sor_method(dx,dy,k,T,Told,nx,ny,tol,error,sor_iter,x,y,alpha1)
%      T=sor_method_solver_unsteady(dx,dy,k,T,Told,nx,ny,tol,error,sor_iter,x,y,k1,k2,alpha1)
    time=toc
end