Crash Box Simulation using LS-DYNA
INTRODUCTION
Passenger safety has been becoming an important criterion for vehicle manufacturers, over the years. The reason is certainly the ongoing development in road-ways and parallelly in vehicles. These two factors contribute to increasing the speed of the vehicle. This cannot behold true always, but for a vehicle manufacturer, when he develops a car and gives it a smooth and rapid speed, he also develops a risk for passenger safety. To ensure the safety of the passengers, he has to consider as much of the techniques, which would contribute to the safety and minimize the flow of external energy to the passenger compartment. Crashworthiness is a term used to signify the ability of the vehicle to absorb the energy that is coming from an impact. A crash box is an important component in the vehicle, which is located between the bumper and the rails. As the name suggests, it is the component that gets crushed during the impact, thereby absorbing the incoming energy. Traditionally, aluminum and steel materials are used to make it. However, considering the requirement of low weight and high stiffness led to the development of the composite material. In this work, a simple rectangular tube of steel material is taken as a model to study the behavior of the crash box when it gets crushed and to study the procedure of doing the simulation on it.
OBJECTIVE
- To analyze a simulation of a simple rectangular steel crash box.
PROCEDURE
In the LS-PrePost application, using the File → Open → LS-DYNA Keyword File, the keyword file is input. The file only had a rectangular meshed box. The input model can be seen in fig. 1 below.
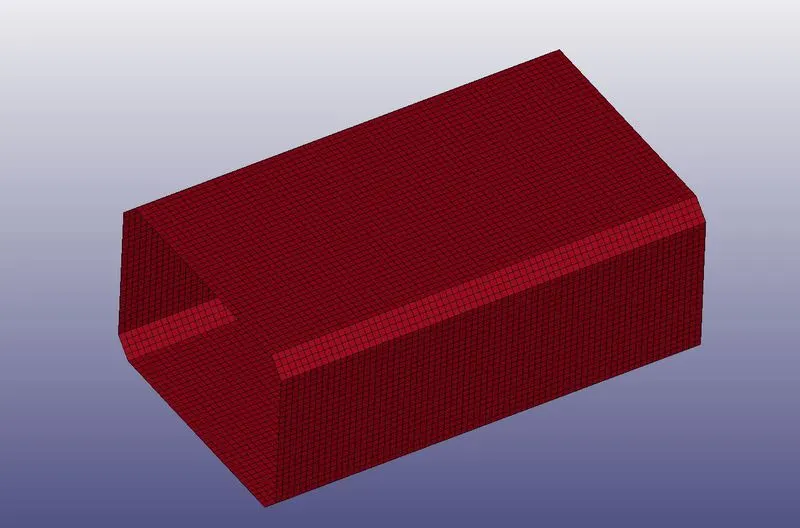
Figure 1: The meshed model of the crash box.
Fig. 2 below shows the Keyword manager dialog box. It includes limited keywords like ELEMENT, KEYWORD, NODE, PART, TITLE. But for the simulation to run some keywords have to be included here. They are material, section, contact, etc. These are the basic keywords that are always present when a model has gone under simulation in LS-DYNA.
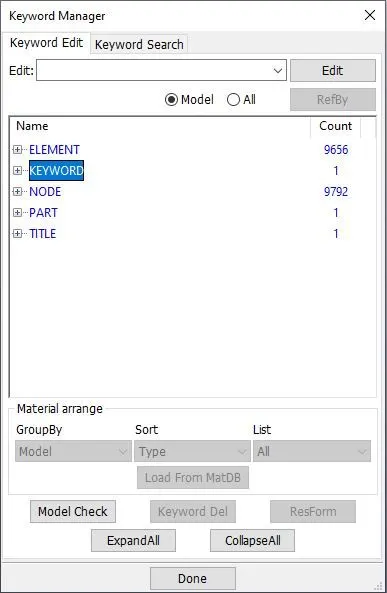
Figure 2: Keyword Manager dialog box.
There were, in total, 3 cases to analyze. The first case was to analyze the crash box with elastic material. The second case was to change the material and considering the non-linear material. And, the third case was to change the thickness of the channel from 1.2 mm to 1.5 mm.
CASE 1
- Material Definition (ELASTIC)
In this work, the (gm, mm, ms) unit was used to define the model. According to it, for steel material, the density is equal to 7.85e-3 gm/mm3, young’s modulus is equal to 210*103 (gm/mm.ms2), the yield stress is equal to 250 (gm/mm.ms2), and Poisson's ratio is equal to 0.3.
In case 1, The elastic material card was needed. Thus, in keyword manager, picking ‘All’ and selecting ‘MAT → 001-ELASTIC’ an elastic material card was selected.
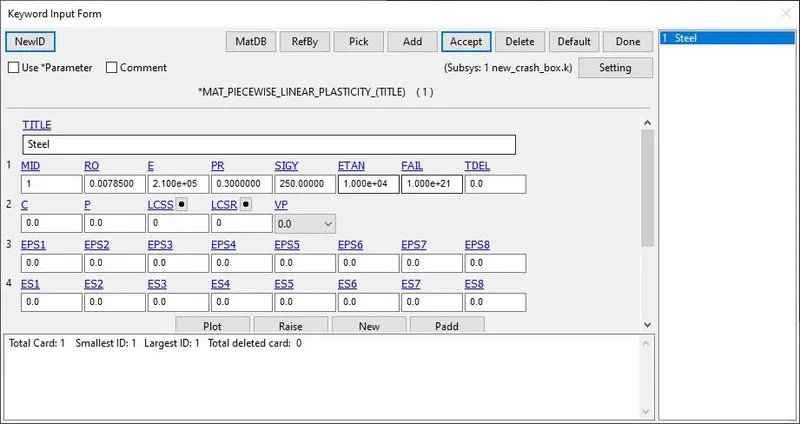
Figure 3: Material card created for the crash box channel.
The values of the material card were based on the data provided. Once the material card is created, in the part card of cell phone, the material id of this material is provided to it.
Similarly, another material card was created by selecting the card ‘020-Rigid’. The mechanical properties of concrete were provided to this card, with a material 2 (earlier material id was 1). Also, its deformation was constrained from all directions. Once created, this material was assigned to the floor part of the model.
- Section Definition
After material definition, the next necessary thing is to define the section. Defining the section means defining the elemental property viz. element formulation, number of integration points, thickness, etc. that helps in how the elements should behave.
In this model, the tube consisted of only shell elements. Therefore, in the Keyword Manager, again picking the ‘All’, and in SECTION, the SHELL was selected.
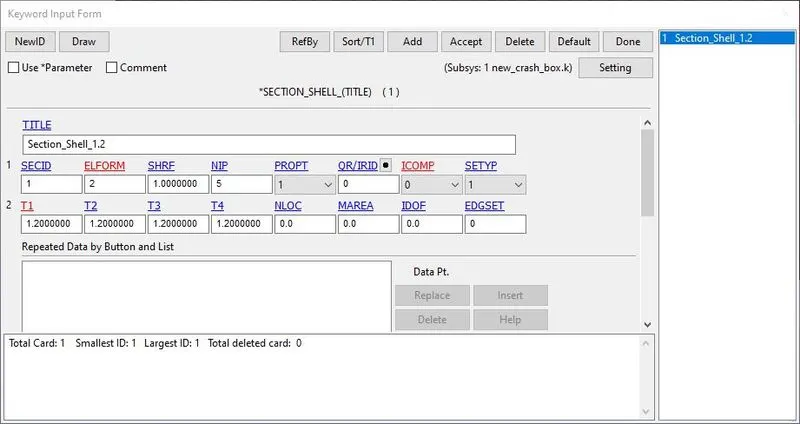
Figure 4: Shell Section Card to define the ELFORM, and thickness for all the shell elements.
As can be seen in fig. 4, in the SHELL card the SECID or section id was given as 1, and the ELFORM or the element formulation was selected 2, the default.
Once created, this SECTION was assigned to the tube part using its section id.
- Rigid Wall
For impact to occur, a rigid wall was required. Thus, using Model and Part → Create entity → Rigidwall, a rigid wall was created, as can be seen in fig. 5.
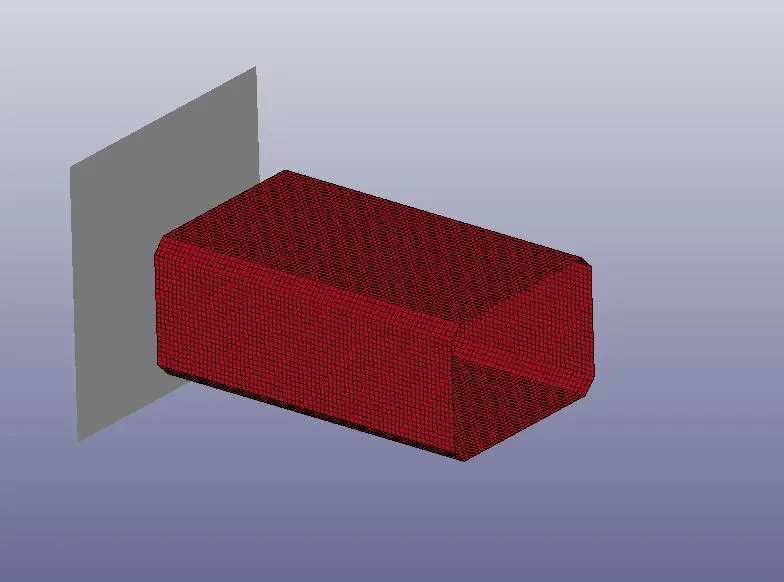
Figure 5: Rigid wall created in front of the tube, for the impact to occur.
- Contact Definition
During the analysis, the tube had to impact the wall and thus would come in its contact. Also, when it deforms, it would come in contact with itself. Thus, a contact definition was required, which would ensure the self-contact criteria. This is ensured by the AUTOMATIC_SINGLE_SURFACE card. In the model, there is only one surface, that is a tube, therefore, a single-surface contact card was needed.
To define the contact, the first set of shells was required to create. Therefore, using Create Entity → Set Data → *SET_SHELL, a set of shell elements of the tube was created.
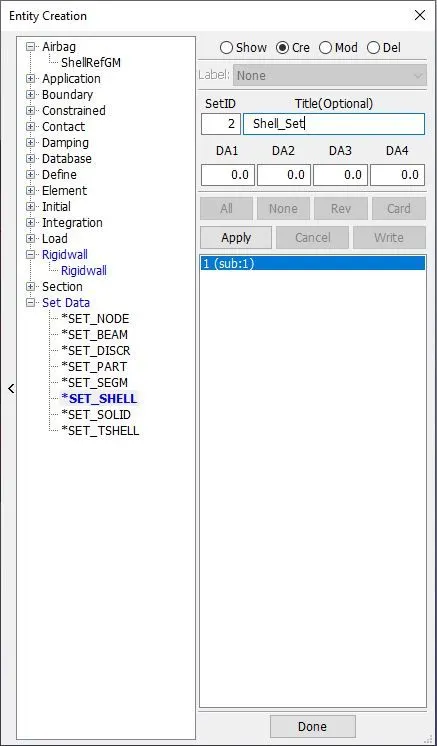
Figure 6: A set of shell elements created for the tube.
Now, to define the contact, in the keyword manager picking the ‘All’, in the CONTACT, AUTOMATIC_SINGLE_SURFACE was selected. In that, at first SSTYP and MSTYP were selected as 1, which allows selecting the set by the shell. Then in both SSID and MSID, a shell set was selected, that was created just earlier. This is how the shell elements of the tube itself have made the slave as well as the master.
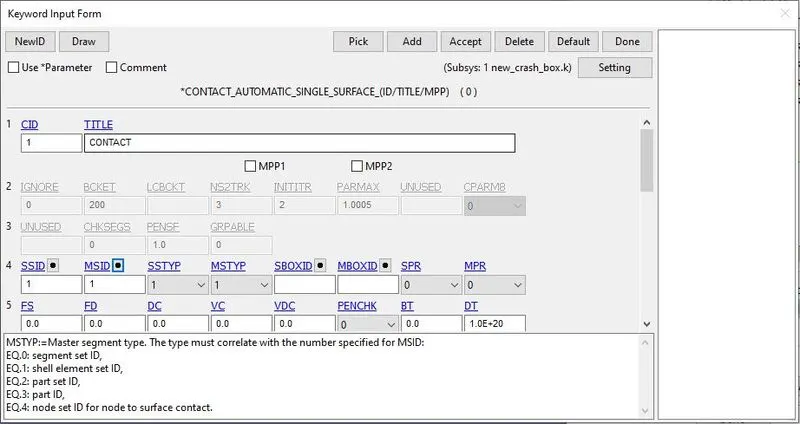
Figure 8: Contact Card was created to define automatic-single-surface contact.
- Boundary Condition
Once the model is ready with the material, elemental formulation, and contact, it is ready to define the boundary condition. In boundary conditions, the tube had to provide an initial velocity of 50 km/hr, or 13.89 mm/ms in the direction constrained to the rigid wall. Thus, to do this, firstly, a set of nodes was required. Therefore, using create entity → Set Data → *SET_NODE, a set of nodes of the tube was created.
Now, to give the initial velocity of 13.89 mm/ms to the tube, in the Keyword Manager, picking the ‘All’, INITIAL → VELOCITY was selected. In that velocity card, the nodal set id was selected that was created just earlier, and VX is given as -10 to provide the initial velocity of 13.89 mm/ms.
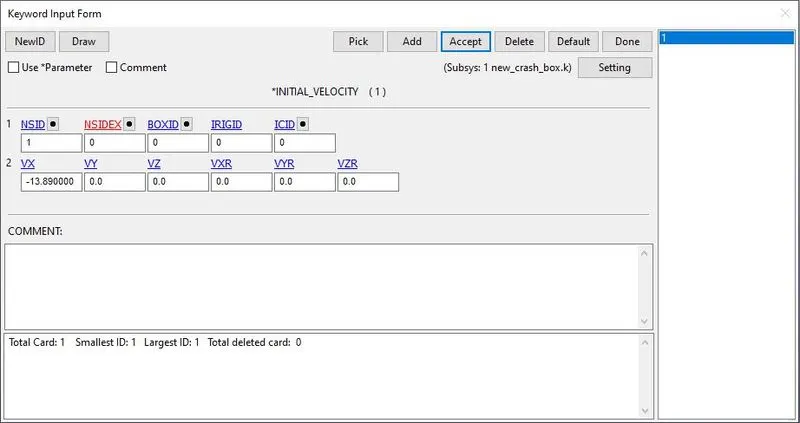
Figure 9: Initial Velocity card was created to impose the initial velocity of 13.89 mm/ms to the tube.
- Control Cards
The termination card is required to define the termination time of the simulation. The distance between the rigid wall and the closest node of the tube was 50 mm. The velocity provided was 13.89 mm/ms. Thus the total time required for the tube to touch the rigid wall is around 3.6 ms. Therefore, the termination time can be set to 5.0 ms. It was defined using the Keyword Manager, picking the ‘All’ and selecting CONTROL → TERMINATION. In that card, the ENDTIM or the end time was given as 3.0.
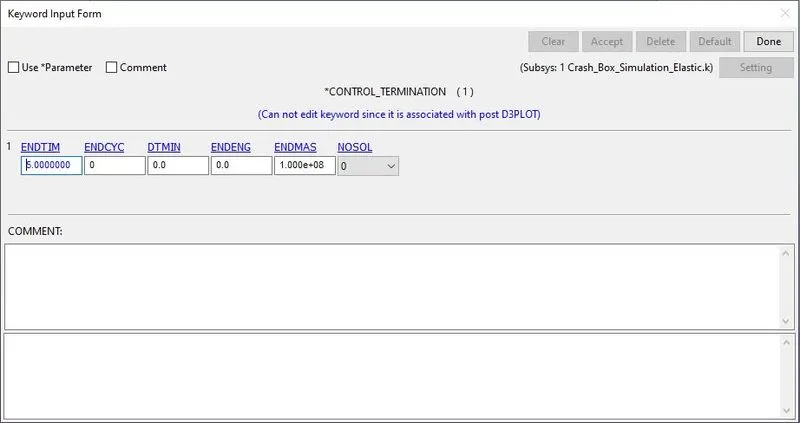
Figure 10: Card to define the termination time.
- Database Cards
Database cards are required to command the software that what files are required as output. In this simulation, binary_d3plot was required to generate. So using Keyword Manager, and selecting the ‘All’, in the DATABASE, BINARY_D3PLOT was selected. In that card, DT was given as 0.01, which plots the results at every 0.01 milliseconds.
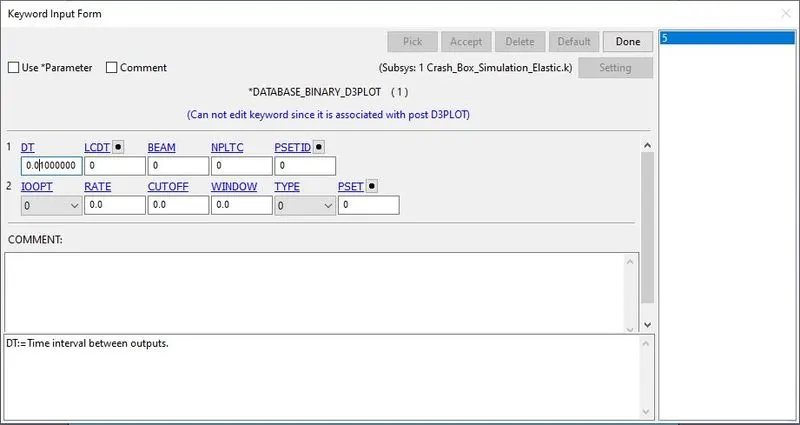
Figure 11: BINARY_D3PLOT card.
In the results, since the energy behavior was the part of the concern, in ASCII, a GLSTAT card was required to activate. Along with GLSTAT, SECFORC, SLEOUT, and RCFORC were also activated to get the sectional force, sliding interface energy, and the resultant interface forces respectively. To activate them, in the Keyword Manager, picking the ‘All’, in DATABASE, ASCII_option was selected. In that card, GLSTAT, SECFORC, SLEOUT, and RCFORC were activated, providing the DT value of 0.01, to print the results at every 0.01 milliseconds.
Once done with defining the keywords, the next essential thing is to check that if any errors are present in it. Therefore, using the Model Checking, the keywords were checked for errors and warnings. When no errors were found, after completing and defining all the keywords, the model was saved in .k format.
- Solving
When the model is all set with material, element formulation, contacts, boundary conditions, and simulation control setup, the model is ready for the simulation. To run the model, the model was first saved in .k format. Using the LS-Run application, the .k file was imported to it and ran for analysis. The run terminated normally, and the output file has shown that the run took 220 seconds for solving.
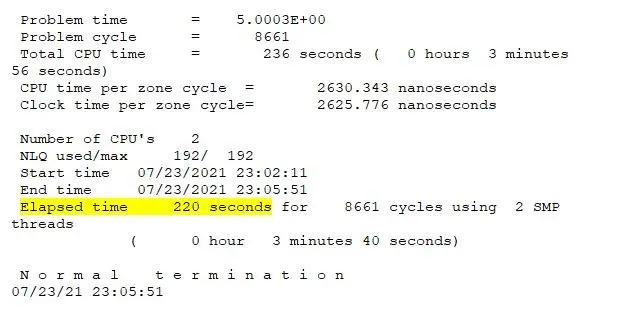
Figure 12: Output file showing the elapsed time of 14 seconds, with normal termination.
- Post-processing
After solving, the .d3plot file was imported into the LS-PrePost application. The von-mises result can be seen in the figure below.
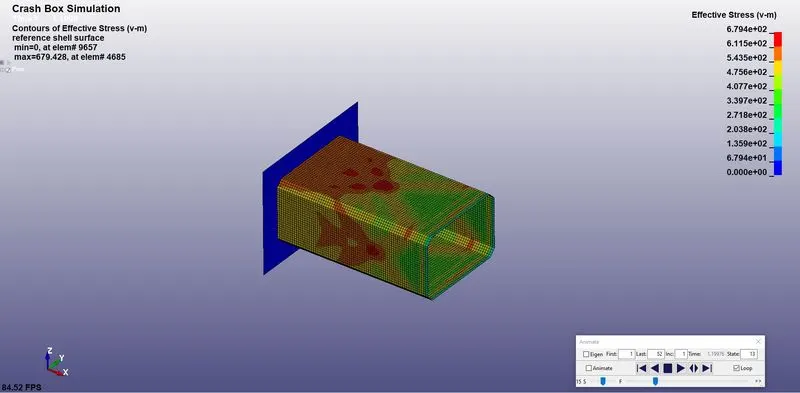
Figure 13: Von-mises stress behavior of the crash box, using an elastic material.
In the von-mises result itself, it can be observed that when the crash box impacted with a rigid wall at around 1.1998 ms, a sudden increase in stress occurred at the contact region in the crash box, and then it transferred to the rest of its body. The maximum stress at 1.1998 ms was 679.4 MPa, which was certainly not a safe stress level, and was much above the yield strength.
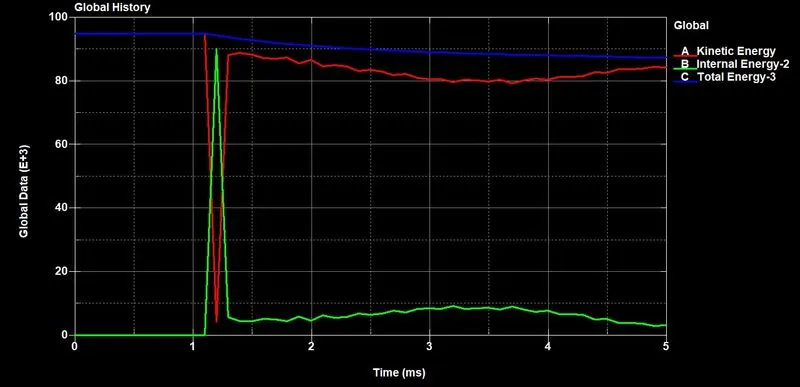
Figure 14: Energy vs. time plot.
Fig. 14 shows the energy vs. time plot. The sudden drop in kinetic energy, and the same time sudden increase in internal energy, indicates the exact time when the crash box came in contact with the rigid wall. Moreover, both energies were restored with small errors.
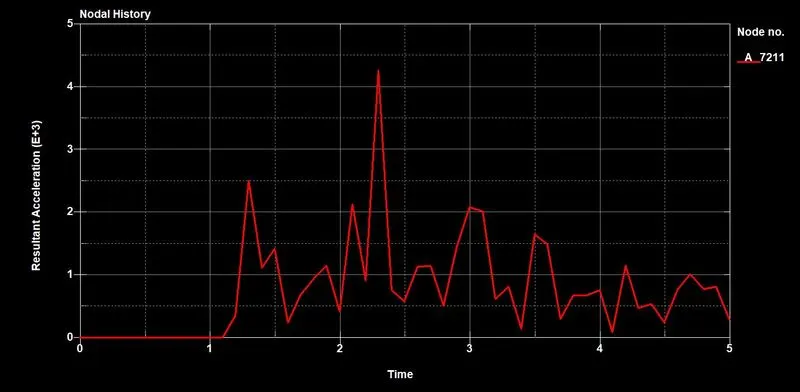
Figure 15: Resultant acceleration of a node in the middle of the crash box.
Fig. 15 is the acceleration plot of the node in the middle of the crash box. It appears from the plot that, though the crash box has come in contact with the rigid wall at 1.19 ms, the acceleration was not at its peak at the same time. When the energy started transferring to the rest of the body, then the acceleration reached its peak. When the crash box hit the rigid wall, the acceleration started increasing, reached its peak, and then started decreasing, as the energy slowly decayed.
The stresses generated in the crash box were far beyond the yield strength of the steel material. It means that the crash box has to be tested with elastic-plastic material. In case 2, the material formulation of the crash box was changed to PIECEWISE_LINEAR_PLASTICITY.
CASE 2
In case 2, all setup was kept as it was, and only the material was changed from 001-ELASTIC to 024-PIECEWISE_LINEAR_PLASTICITY.
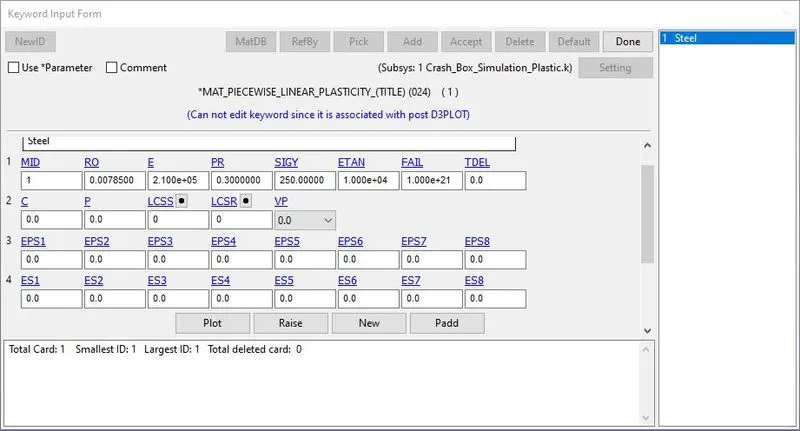
Figure 16: Material card was changed in case 2 to PIECEWISE_LINEAR_PLASTICITY.
- Post-Processing
The file was saved with a different name, and the simulation was run once again. The VonMises stress contour can be seen in the figure below.
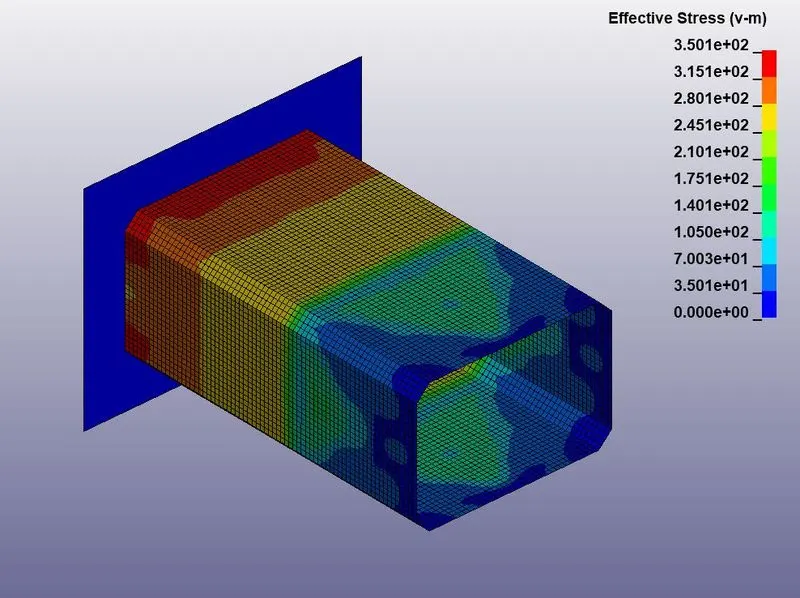
Figure 17: VonMises Stress contour using, 024-PIECEWISE_LINEAR_PLASTICITY material.
By changing the material in case 2, no significant changes were found. The material had to should had to deform, when it hit the rigid wall. But no such deformation was found, however, the stress level has decreased. The result was checked for the displacement in the z-direction, i.e. displacement normal to the width of the crash box.
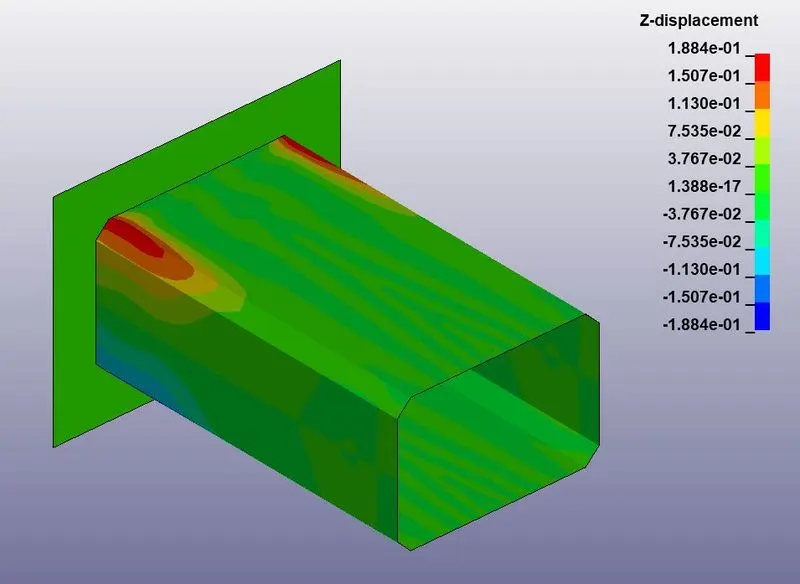
Figure 18: Nodal displacement contour in the z-direction.
In fig. 18, the z-displacement can easily be seen, however, the displacement that occurred was very negligible. The maximum displacement of 0.185 mm occurred, just after hitting the wall at 1.219 ms. To get clarity about this phenomenon, a displacement plot was created for two nodes, one near the rigid wall, and the other in the middle of the crash box.
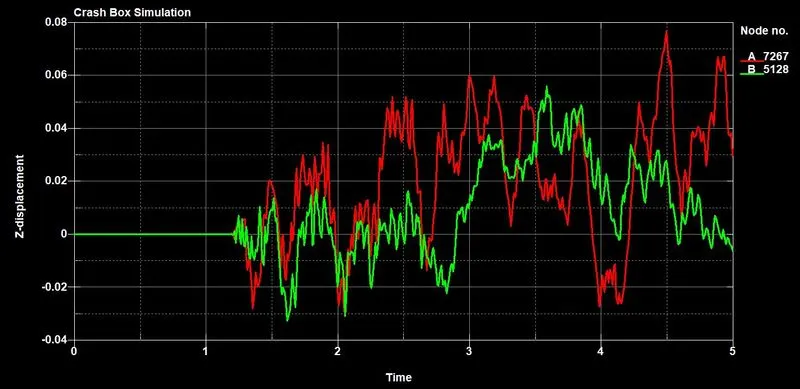
Figure 19: Z-displacement vs. time plot for two nodal points.
In fig. 19, node 7267 is near the wall, and node 5128 is in the middle of the crash box. The figure shows the time exactly when the impact occurred. Due to the impact, the nodes started showing the displacement in the z-direction. However, the maximum displacement that occurred was not even 0.1 mm. Moreover, the displacement that occurred didn’t lead to plastic deformation. The displaced nodes came to their original position after some time. They were just oscillating about their original position. This is confirmed by plotting the acceleration vs. time plot, shown below.
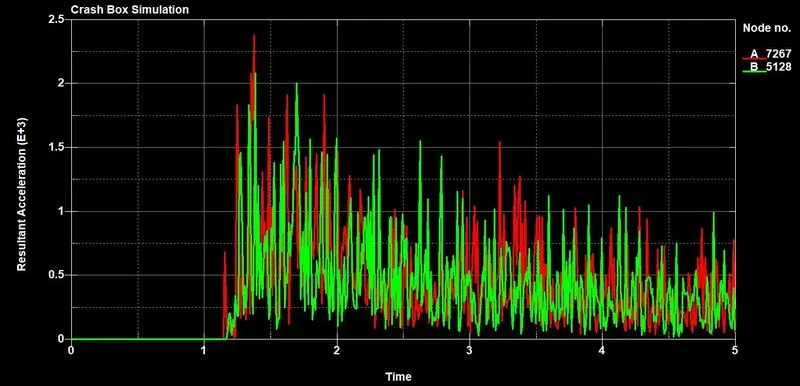
Figure 20: Acceleration vs. time plot for node 7267 (near the wall), and 5128 (middle of the crash box).
The maximum acceleration of around 2.7E+3 mm/ms^2, which is a very huge transient acceleration, to consider. There has no considerable deformation occurred, but the acceleration was huge. This indicates that the shock imparted in the crash box was significant, however, it didn’t lead to any permanent deformation. If it would have occurred, the measure would be very less. The other plots are shown below.
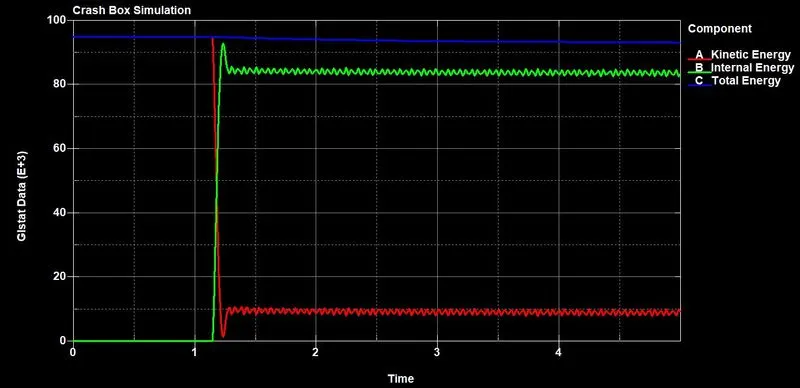
Figure 21: Energy vs. time plot for 1.2 mm thickness crash box.
Fig. 21 tells the exact time when the crash box hit the wall. Comparing fig. 14, and fig. 21, it can be observed that, in case 1, elastic material was used, therefore, the energies were restored. But in case 2, though the deflection of energy is almost the same because the material was plastic, thus the energy was not restored.
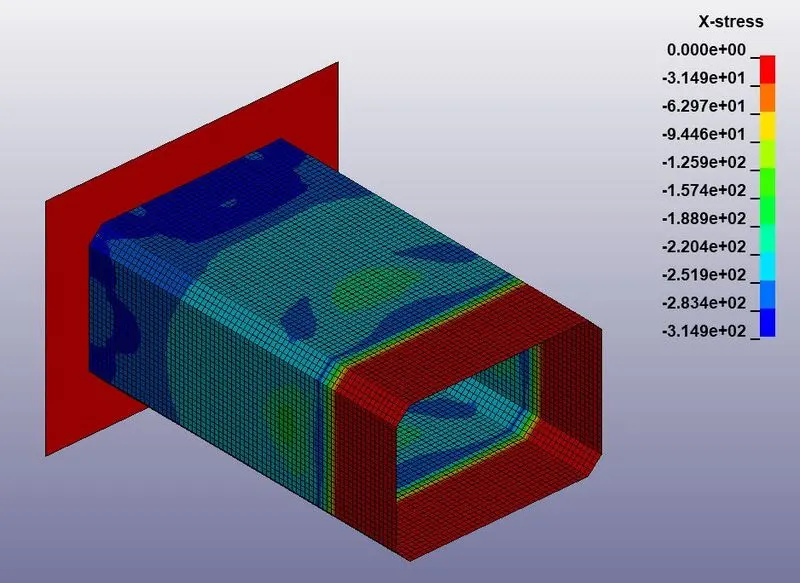
Figure 22: X-directional stress (along the length of the crash box).
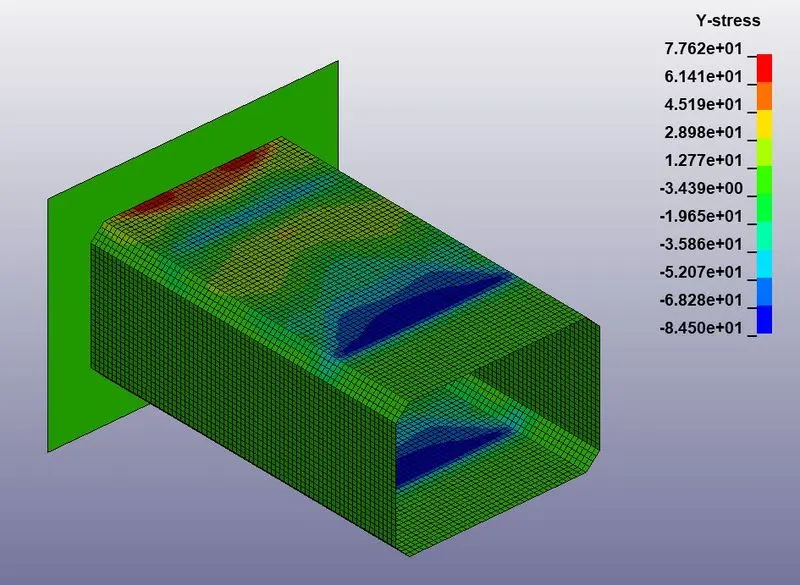
Figure 23: Y-directional stress (along the width of the crash box).
CASE 3
In case 3, the thickness of the crash box was changed to 1.5 mm. To change that, the keyword file was opened, and in the SECTION_SHELL section, the thickness was changed to 1.5, as shown below.
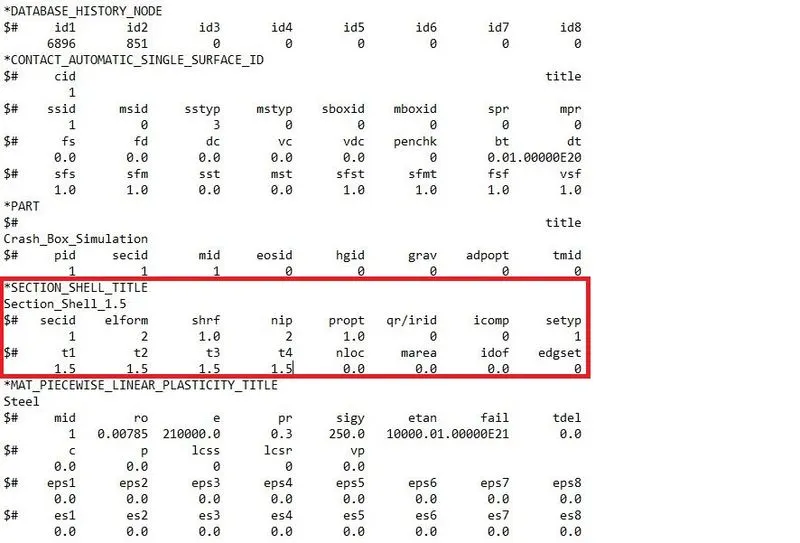
Figure 24: Thickness of shell elements changed to 1.5 mm.
Thus, without opening the application, the thickness can also be changed using the in-built Notepad application. This file was then run, to see the change. The VonMises contour of the result is as shown below.
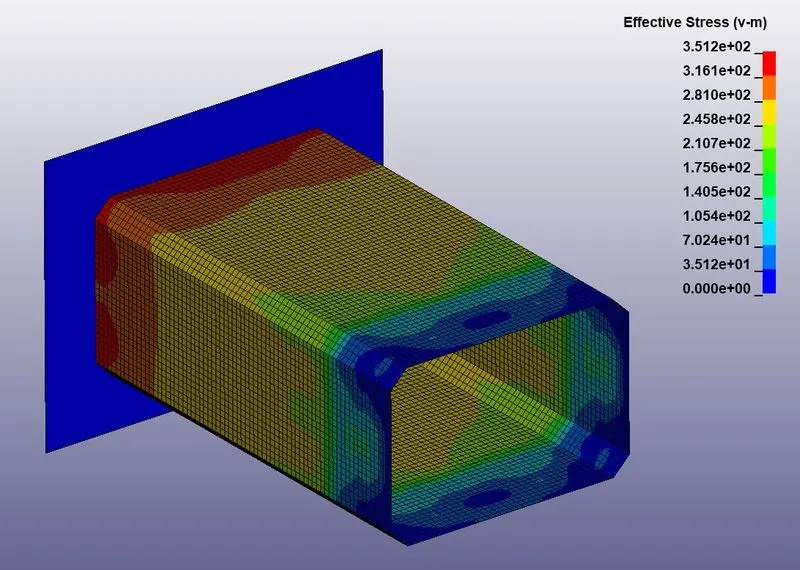
Figure 25: Von mises contour of the crash box with 1.5 mm of thickness.
The VonMises plot alone cannot tell important things about the results. However, in the scale, the maximum stress level was increased to 351.2 MPa, which was nearly 350.1 MPa in the earlier case 2.
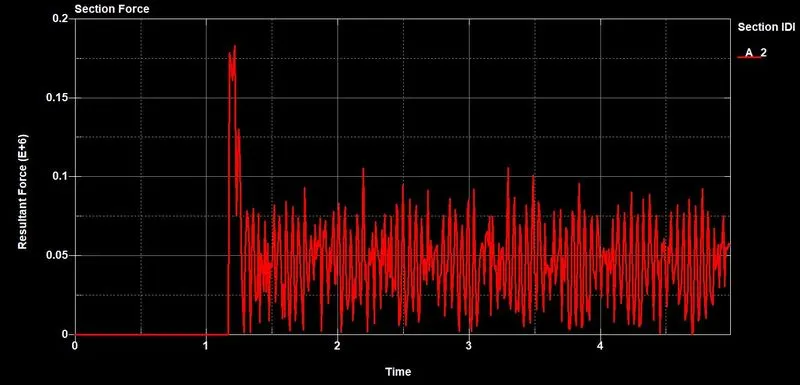
Figure 26: Sectional resultant force at the middle of the crash box.
The maximum sectional resultant force of 0.175E+6 was a very huge force to note.
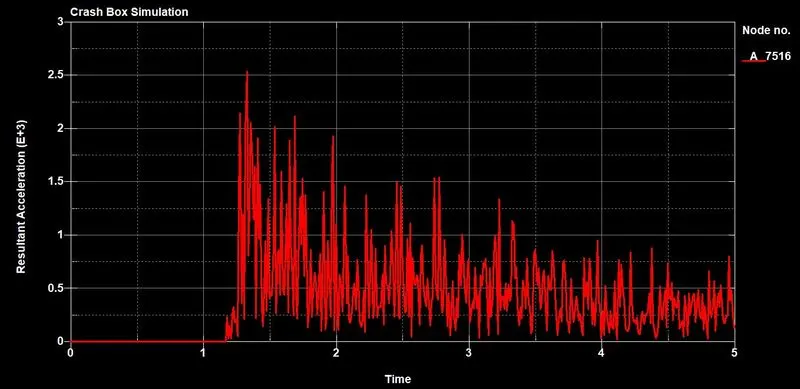
Figure 27: Acceleration plot for the node in the middle of the crash box.
Fig. 27 shows the maximum acceleration of around 2.5 mm/ms^2 occurred on the node in the middle of the crash box. Comparing fig. 20, and fig. 27, it can be observed that after increasing the thickness, the acceleration in the node has slightly reduced. The maximum acceleration in the 1.5 mm thickness crash box is 2.5E+3, which was around 2.7E+6 earlier. The stresses in X-direction and Y-direction are as shown below.
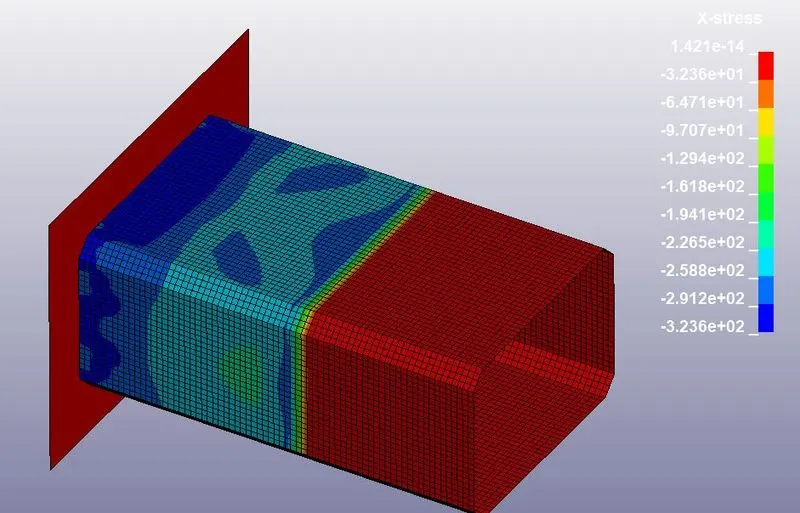
Figure 28: X-directional stress, in 1.5 thickness crash box.
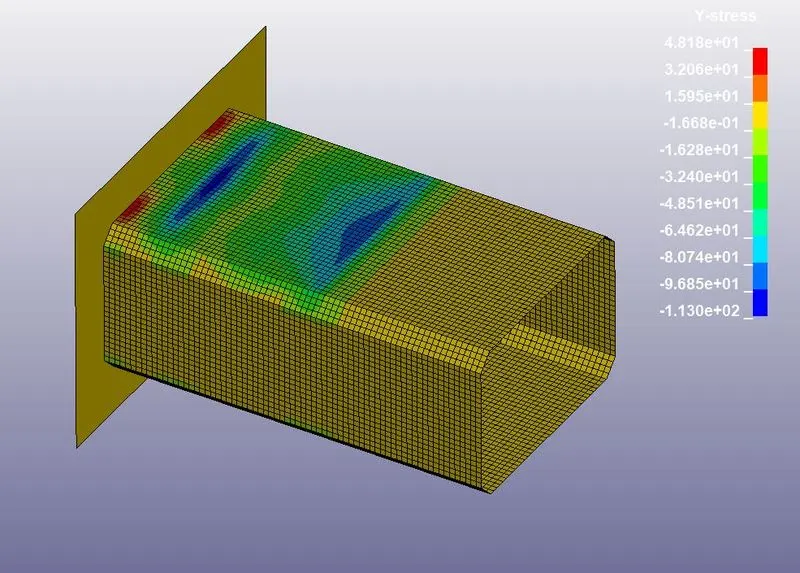
Figure 29:Y-directional stress, in 1.5 thickness crash box.
The energy plot for the crash box with 1.5 mm thickness is as shown below.
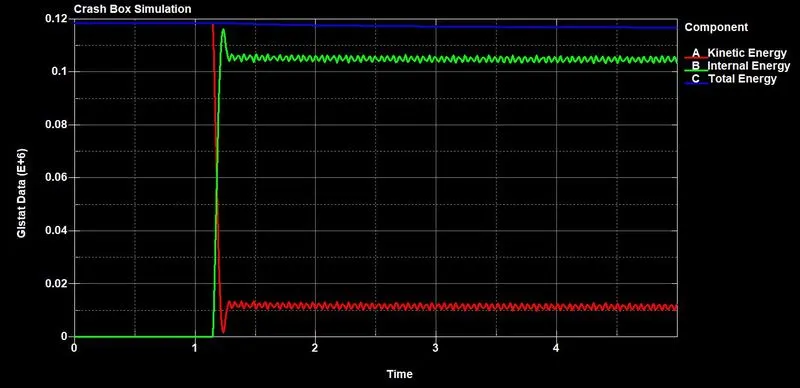
Figure 30: Energy plot for 1.5 mm thickness crash box.
Comparing the fig. 21, and fig. 30, it can be observed that in case 3 the internal energy has been increased dramatically. Earlier, in case 2, the maximum internal energy was 92E+3 kg.mm^2/ms^2, and in case 3, it has increased to around 1.15E+6 kg.mm^2/ms^2. This is solely due to the increase in the mass. An increase in thickness not only caused an increase in stress level but also led to increasing in the energy in the crash box body.
CONCLUSION
The crash box was analyzed for the impact test. The actual crash box is much more complex, but in this simulation a rectangular tube has been taken as a simple model, to study how variations can be seen when the material property is changed and when the thickness is changed. And from the test, it is observed that, while using elastic material, the energy was restored after the impact, while it doesn’t when the plastic material is used. Secondly, when the thickness of the material was increased, certainly the stress level increased in the body of the crash box, but along with that, the energy level also increased due to the increase in mass of its body. This suggests that the idea of increasing the thickness has to be taken very strict, and if possible other method has to be checked, like changing the material, or changing the geometry. Because, the idea of increasing the thickness is not a good option considering the energy aspect, because it is directly dependent on the mass, and considering the stress. The crash box has to be less stiff, which could absorb a large amount of energy, and not let the energy transfer so that less energy would transfer to the rest of the vehicle parts.