WOT Condition
AIM :
To perform the various operations considering Electric vehicles inorder to fulfill the required objectives.
OBJECTIVE :
- To state the difference between mapped and dynamic model of engine, motor and generator and the way to change model type.
- To determine the process and factors involved in calculating MPGe.
- To perform certain analysis on running the HEV ReferenceApplication with WOT drive cycle.
- To compare the simulated results of hybrid and pure electric powertrains under WOT drive cycle.
POWER-TRAIN BLOCKSET :
- Powertrain Blockset provides fully assembled reference application models of automotive powertrains, including gasoline, diesel, hybrid, and electric systems.
- It includes a component library for simulating engine subsystems, transmission assemblies, traction motors, battery packs, and controller models.
- Powertrain Blockset also includes a dynamometer model for virtual testing. MDF file support provides a standards-based interface to calibration tools for data import.
Powertrain Blockset provides a standard model architecture that can be reused throughout the development process. You can use it for design tradeoff analysis and component sizing, control parameter optimization, and hardware-in-the-loop testing. You can customize models by parameterizing components in a reference application with your own data or by replacing a subsystem with your own model.
1. Mapped and Dynamic Engine models
Powertrain blocksets provides two types of combustion engine models, Mapped and Dynamic.
Mapped Engine Models :
- Mapped Engine model uses a set of steady-state lookup tables to characterize engine performance.
- These tables provide overall engine characteristics, including actual torque, fuel flow rate, BSFC, and engine-out exhaust emissions.
- In the mapped systems the computational level is less compared to dynamic models.
- This system implements a model using a stored data i.e., power, air mass flow, fuel flow,wfficiency and emmission are some examples for performance lookup table.
- Here the system is easy to solve and the results are obtained quickly.
Dynamic Engine Models :
- In Dynamic engine system the model decomposes the engine behavior into engine characteristics that are separated into lower-level components.
- In this way the models are combined to capture the dynamic effects.
- The dynamic system solves the entire system and its sub-system based on the input given.
- Dynamic systems are computationally heavy compared to the mapped systems.
- The output in a dynamic system is obtained by solving the equations based on the real-time input conditions.
- These systems are complex and they generally required more time to provide results compared to mapped systems.
Changing the model type according to the requirements can be done using the Variant sub-system option.
2. Calculation of MPGe
About MPGe :
MPGe stands for Miles per gasoline equivalent.
Generally MPGe is the number of miles your car can drive per gallon of gas. Since engines that use an alternative source of fuel can't be measured by liquid gallons of fuel, the MPGe rating is calculated by figuring out the number of miles a vehicle can go using the same energy content as a gallon of gas.
The Environmental Protection Agency (EPA) established MPGe as an energy efficiency metric. Introduced in 2010, its mission is to relate the amount of energy expended by alternative fuel vehicles to that of traditional gas-powered variants.
MPGe doesn't necessarily equate to a solid comparison between operating costs with these two types of engine types due to the wide variation in costs between alternative fuel vehicles and internal combustion engines. Therefore the EPA assumes prices that represent national averages.
The unit of energy consumed is deemed to be 33.7 Kilowatt-hours without regard to the efficiency of conversion of heat energy into electrical energy, also measured in Kilowatt hours.
Calculation :
MPGe is determined by converting the vehicle consumption per unit distance, as determined through computer modeling or completion of an actual driving cycle, from its native units into a gasoline energy equivalent. A general formula for MPGe is,

The major factors considered for the modelling of fuel flow are,
- Fuel Economy
- Fuel Consumption
Fuel Economy :
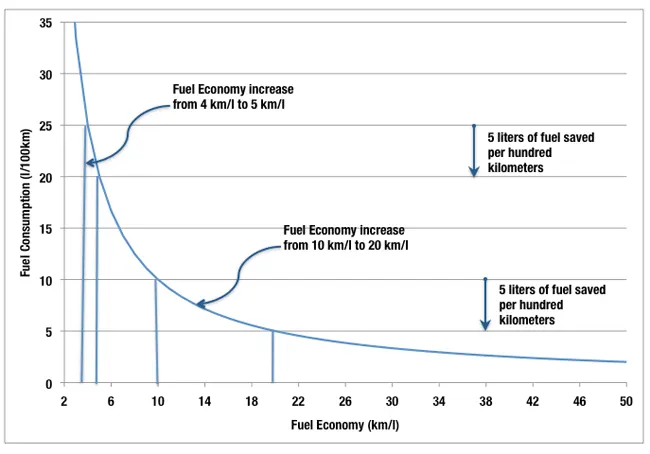
The Fuel Economy of an automobile relates distance traveled by a vehicle and the amount of fuel consumed. Consumption can be expressed in terms of volume of fuel to travel a distance, or the distance travelled per unit volume of fuel consumed.
Since fuel consumption of vehicles is a significant factor in air pollution, and since importation of motor fuel can be a large part of a nation's foreign trade, many countries impose requirements for fuel economy.
Fuel Consumption :
Fuel Consumption is the inverse of fuel economy. It is the rate at which an engine uses fuel, expressed in units such as miles per gallon or liters per kilometer.
Engine designers strive for more power, lower fuel consumption, lighter weight, and better reliability. Short journeys can double fuel consumption, especially when the engine is cold.
3. Analysis on HEV ReferenceApplication with WOT drive cycle
Hybrid Electric Vehicle :
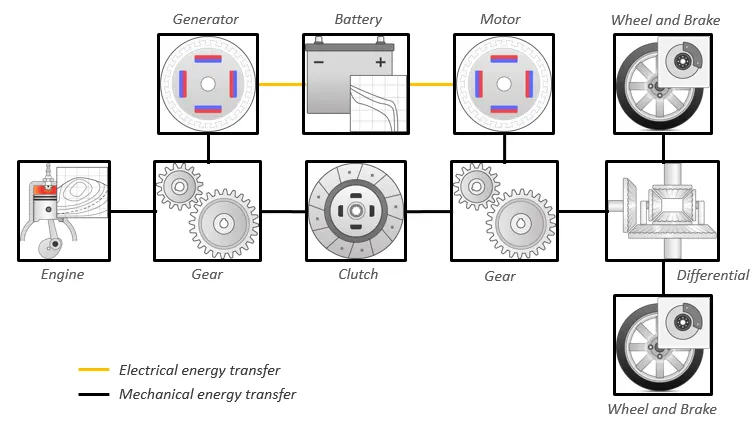
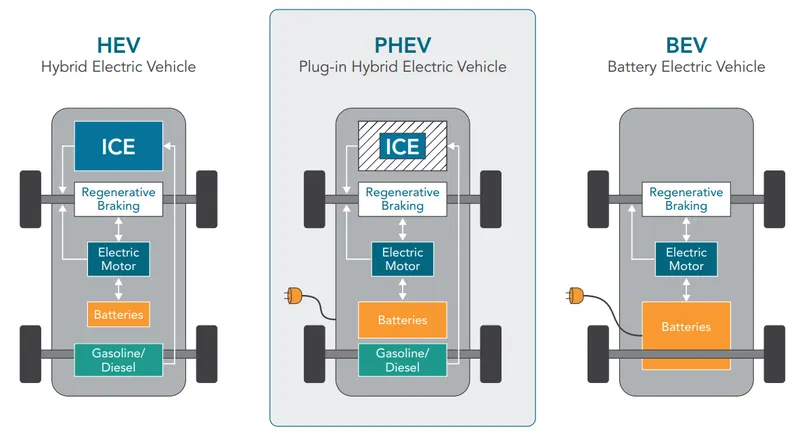
The hybrid electric vehicle reference application represents a full multimode hybrid electric vehicle (HEV) model with an internal combustion engine, transmission, battery, motor, generator, and associated powertrain control algorithms. Use the reference application for powertrain matching analysis and component selection, control and diagnostic algorithm design, and hardware-in-the-loop (HIL) testing.
By default, the HEV multimode reference application is configured with:
- Mapped motor and generator
- 1.5–L spark-ignition (SI) dynamic engine
This diagram shows the powertrain configuration,
HEV Reference model in Simulink :
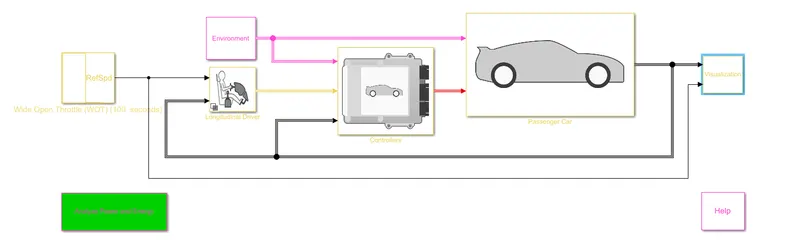
The main objective of this simulation is to analyse the HEV reference model with respect to the Grade and Wind velocity conditions.
The drive cycle used for this simulation was WOT condition.
The configuration of the parameters under WOT condition was attached below,
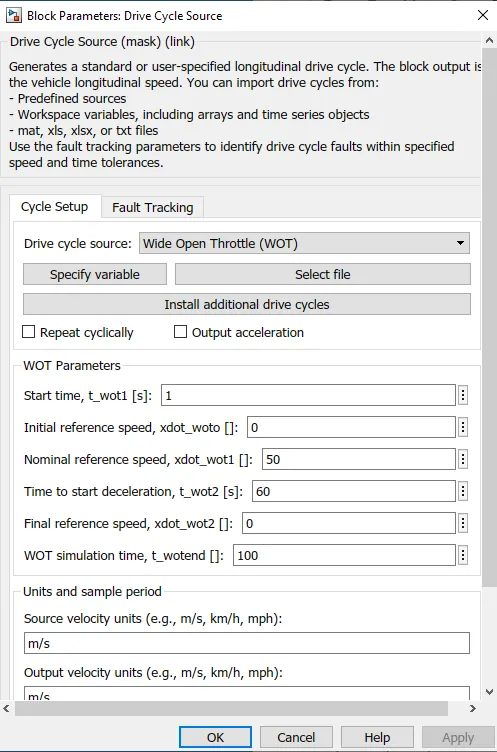
The simulation had a total run time of 100 s.
The acceleration took place from 0 to 50 s.
Condition 1 :
Initially the default values of grade and wind velocity were used which is 0.
These parameters were present under the Environment sub-system which was attached below,
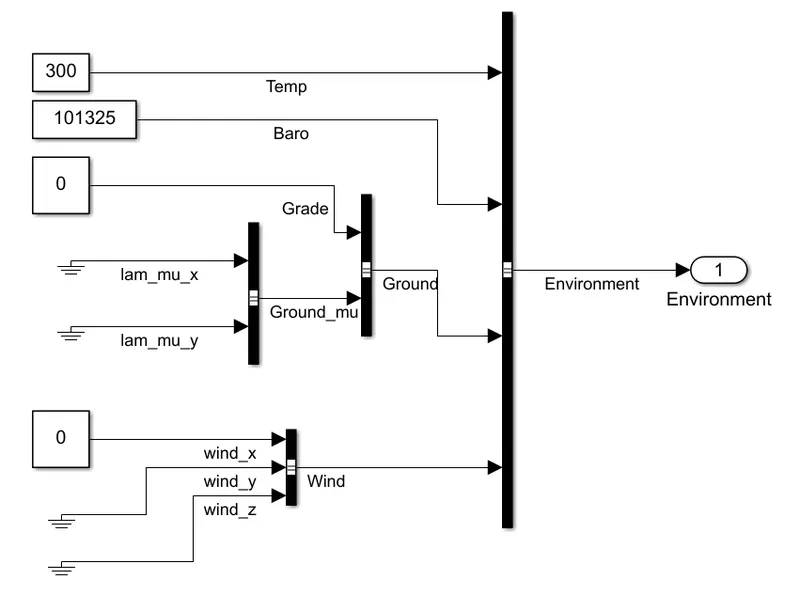
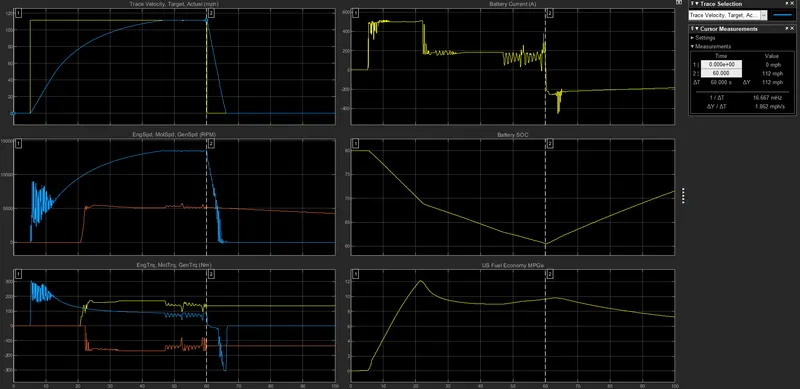
The plot had been generated involving various aspects as given,
The maximum velocity of the vehicle was found to be 112 mph (180 km/h).
Condition 2 :
In this case the grade and wind velocity values were changed to 10 and 8 respectively inside the Environment sub-system.
The modification in the parameters are stated below,
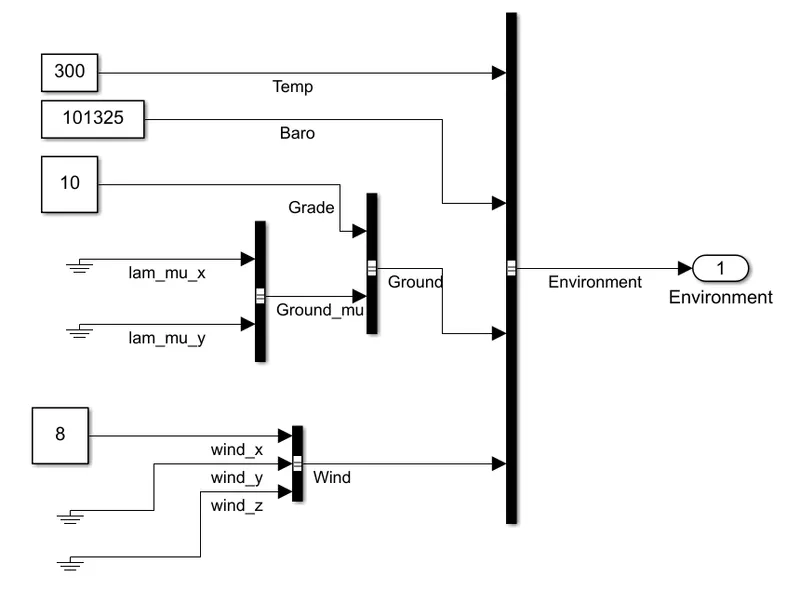
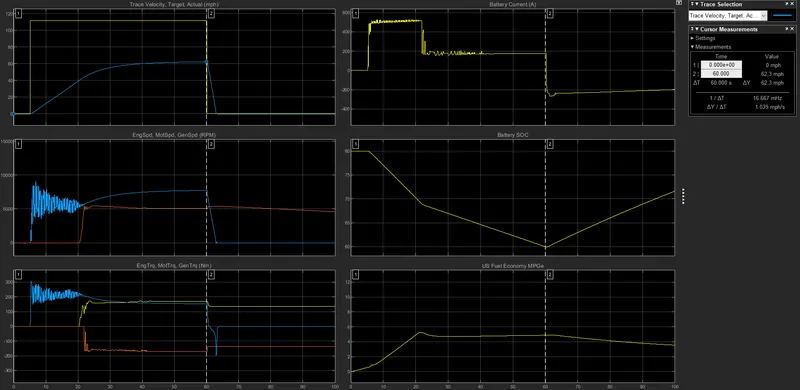
The plot had been generated involving various aspects as given,
The maximum velocity of the vehicle was found to be 62.3 (100 km/h).
Inference :
Thus the increase in the grade and wind velocity in the environment limits the acceleration of the vehicle and thereby reduces the maximum velocity of the vehicle which was clearly depicted in the above given plots.
4. Comparison of Hybrid and Pure Electric vehicles under WOT drive cycle
Pure Electric Vehicle :
The electric vehicle reference application represents a full electric vehicle model with a motor-generator, battery, direct-drive transmission, and associated powertrain control algorithms. Use the electric vehicle reference application for powertrain matching analysis and component selection, control and diagnostic algorithm design, and hardware-in-the-loop (HIL) testing.
The electric vehicle reference application is configured with a mapped motor and battery. This diagram shows the powertrain configuration.
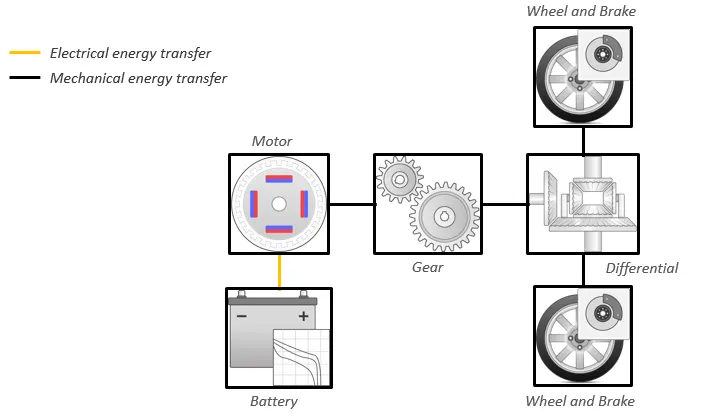
EV Reference model in Simulink :
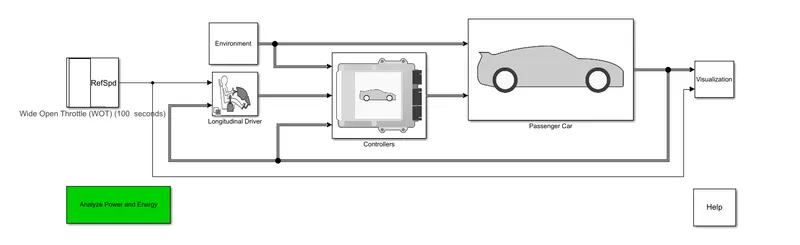
In this case the EV Reference model was compared to the HEV Reference model based on the previous conditions performed on the HEV model.
The results from the previous model was analysed and compared with the current model.
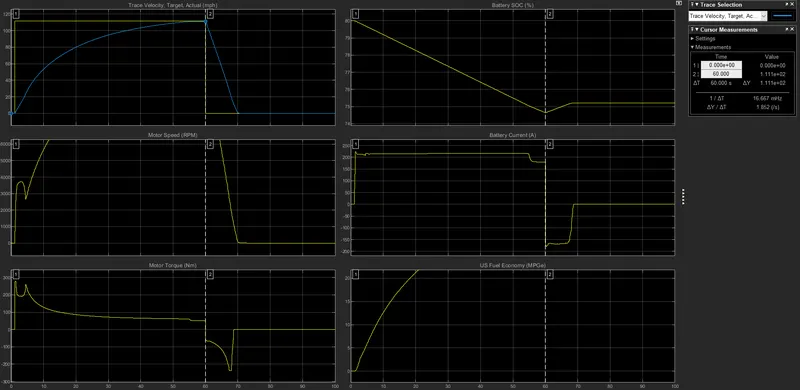
The results of BEV model under default conditions had been attached below,
The simulation had a runtime of 100s.
The acceleration took place from 0 to 50 s.
The maximum velocity of the vehicle was found to be 111 mph (178 km/h).
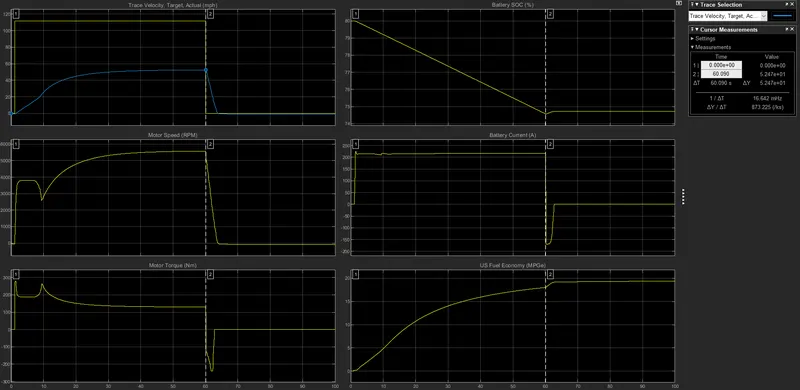
Based on WOT condition for the BEV the results were attached for the grade and wind velocity values of 10 and 8 respectively,
The maximum velocity of the vehicle was found to be 52.47 mph (84 km/h).
For the HEV model from the previous conditions for WOT condition ,
The maximum velocity of the vehicle was found to be 62.3 (100 km/h).
Inference :
On comparing the HEV and BEV under WOT drive cycle the following observations were made
- The HEV has clearly more acceleration compared to the BEV under same circumstances.
- The BEVs used lithium ion battery, thus compared to HEVs the dicharge rate is very high in BEVs.
- The SOC is high in BEVs compared to HEVs and thereby the more torque and power is obtained in BEVs
- In BEVs there is no pollution from the vehicle rather than HEVs which has some emmissions.
- The Efficiency of BEV is greater than HEV.
CONCLUSION :
Numerous operations were performed with the HEVs and BEVs .
All the operations were analysed and presented according to the requirements.
Necessary images were attached to explain the observations.